
How Support and Resistance Levels Work in Trading
Support and resistance levels are specific price points on a financial chart where the forces of supply and demand temporarily halt or reverse an asset's price trajectory. Traders intensely monitor these invisible floors and ceilings because they provide critical geographical markers for identifying potential entry and exit points, managing risk, and anticipating major momentum breakouts. Ultimately, these levels are driven by a complex combination of historical price action, behavioral psychology, and algorithmic trading behavior.
The Invisible Ceilings and Floors of Financial Markets
If one observes a stock chart for an extended period, a peculiar phenomenon emerges: prices rarely move in straight, uninterrupted lines. Instead, they zig-zag, frequently bouncing off invisible boundaries as if striking a glass ceiling or a concrete floor 1. In the discipline of technical analysis, these boundaries are known as support and resistance levels. These levels form the foundational architecture of technical market analysis, providing structure to what otherwise appears to be chaotic price fluctuations 22.
At its core, the financial market operates as an ongoing tug-of-war between buyers representing demand and sellers representing supply. Support and resistance levels are the distinct battlegrounds where this struggle becomes visible on a price chart 235. The interaction between these two forces dictates whether a trend will continue, pause, or violently reverse.
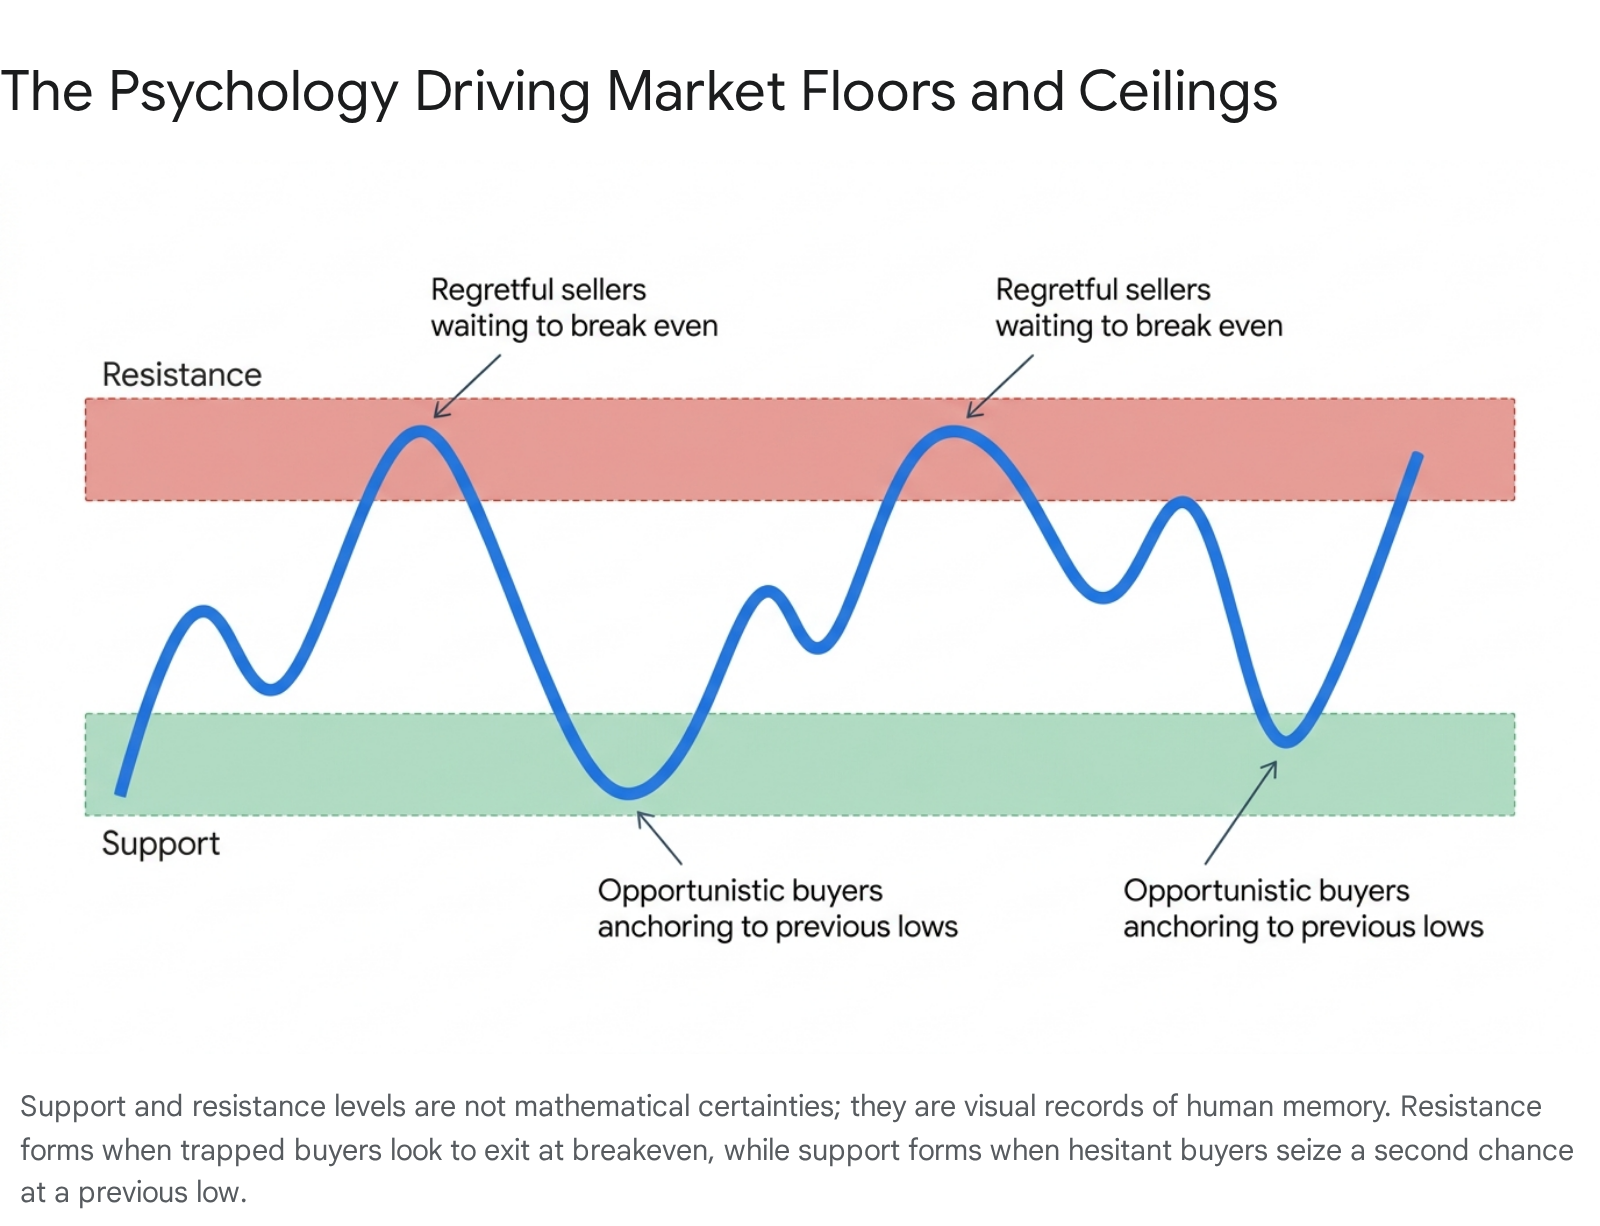
Support is defined as a price level where a downtrend tends to pause or reverse because it acts as a structural "floor" for the asset. When an asset's price drops to this specific level, market demand becomes strong enough to overcome the prevailing supply 245. Buyers step into the market in large volumes, believing the asset is undervalued or "cheap" at this particular price, while existing owners become reluctant to sell their shares at a perceived discount. This heavy concentration of buying interest halts the decline, absorbs the selling pressure, and often forces the price to bounce back upward 269.
Resistance represents the exact opposite market dynamic. It acts as a structural "ceiling" where an established uptrend loses momentum and reverses downward. As the price climbs toward a resistance level, the supply of the asset begins to overwhelm market demand 24. Sellers eagerly step into the market to lock in profits, while potential buyers hesitate, fearing the asset has become too expensive or overvalued. This formidable wall of selling pressure halts the upward movement and typically pushes the price back down to lower valuations 269.
Professional traders do not view these concepts as infallible mathematical laws or guaranteed physical barriers. Rather, they treat them as visual representations of human memory and collective market mechanics 510. An asset that has bounced off the $50 mark three times in the past year has established a highly credible support level; an asset that repeatedly fails to break above $100 has established a firm resistance level. The more frequently these price points are tested without breaking, the more significance market participants attribute to them 57.
The Behavioral Psychology Behind Price Barriers
To a casual observer, drawing horizontal lines on a financial chart might look like a futile exercise in pattern-seeking. However, support and resistance levels are deeply rooted in behavioral finance and the predictable cognitive biases of human psychology 58. These levels function effectively because market participants remember past prices, assign emotional weight to those memories, and adjust their future trading behavior accordingly 51013.
Anchoring Bias and Loss Aversion
The primary psychological driver responsible for the creation of support and resistance is known as "anchoring bias." Documented extensively by behavioral economists such as Daniel Kahneman and Amos Tversky, anchoring is a cognitive heuristic where individuals rely too heavily on an initial piece of information - the "anchor" - when making subsequent decisions under conditions of uncertainty 81314.
In the context of trading, this anchor is almost always a highly specific price point. It might be the exact price a trader originally paid to acquire a stock, a prominent 52-week high featured in financial news, or the absolute bottom price at which an asset previously rebounded 1315. These mental reference points exert a powerful influence over how investors evaluate current market opportunities, often overriding changes in the underlying fundamental data of the company or macroeconomic environment 15169.
The psychology of a support level is primarily driven by opportunism and regret. Consider an scenario where a stock drops sharply to $40, bounces off that low, and subsequently rallies to $60. Investors who watched the stock hit $40 but hesitated to buy will experience intense regret. They mentally anchor the asset's "true value" or "best entry point" to that $40 price. If the stock eventually drops back to $40 a month or a year later, these historically hesitant investors aggressively buy in, eager not to miss the opportunity a second time 2. Concurrently, traders who successfully bought at $40 the first time and took profits at $60 often seek to replicate their success. They place new buy orders at their original entry point, collectively contributing to the massive buying pressure that solidifies the support floor 26.
Conversely, the psychology of a resistance level is heavily influenced by loss aversion and the desire to break even. If an investor purchases a stock at $100 right before an unexpected market crash drives the price down to $70, they will likely experience the pain of loss aversion 1315. Rather than accepting the loss, they hold onto the losing position, vowing to sell as soon as they can recover their initial investment. When the price slowly climbs back to the $100 mark, a massive wave of sell orders floods the market from these regretful buyers, creating a heavy, unnatural ceiling of resistance 2. Furthermore, short-term momentum traders who bought the dip at $70 recognize that the stock previously peaked at $100. They preemptively place sell orders just below $100 to lock in their gains, reinforcing the resistance barrier before the price even reaches the exact peak 26.
The Magnetism of Round Numbers
Beyond historical highs and lows, human beings possess an innate psychological attraction to round numbers. Market practitioners and behavioral finance academics have extensively documented the phenomenon of "psychological price barriers" manifesting at integers, half-dollars, and powers of ten 1011.
A landmark peer-reviewed study published in the journal Management Science analyzed a random sample of over 100 million stock transactions to test this phenomenon. The researchers found massive, statistically significant buy-sell imbalances clustered entirely around round numbers 12. The study revealed that traders frequently set their limit orders and stop-losses at whole numbers like $10, $50, or $100 rather than arbitrary fractions like $49.73. Specifically, the data showed excessive buying by liquidity demanders at price points exactly one penny below round numbers, and excessive selling exactly one penny above them 12. The financial impact of this cognitive bias is staggering; the researchers estimated that buying below and selling above round numbers results in collective losses for liquidity demanders approaching $1 billion per year 12.
This irrational clustering behavior stems from the "left-digit bias" - the same psychological pricing quirk used in retail that makes a $19.99 product feel significantly cheaper to a consumer than a $20.00 product 1012. In global financial markets, this clustering of orders transforms round numbers into highly predictable, self-fulfilling support and resistance zones 1513. When an asset like Bitcoin approaches the $100,000 mark or Gold nears $2,000 an ounce, the sheer volume of limit orders clustered at those round numbers forms an immense, natural barrier that requires extraordinary macroeconomic catalysts to break 151423.
Technical Methods for Identifying Key Levels
Because financial markets are dynamic and constantly evolving, there is no single mathematically perfect way to draw a support or resistance line. Technical analysts utilize a wide variety of tools to locate these zones, ranging from simple visual observations of past price action to complex algorithmic indicators. Broadly, these tools fall into two distinct categories: static levels that remain fixed at specific price points, and dynamic levels that shift over time in response to ongoing price action.
Static Levels and Historical Price Action
Static levels maintain a fixed numerical value on a chart regardless of how much time passes. The most fundamental method traders use to identify them is by looking left on a price chart and drawing horizontal lines connecting historical peaks (swing highs) and historical troughs (swing lows) 2415.
If an asset repeatedly falls to $150 and bounces back up, a horizontal line drawn at $150 represents static horizontal support 24. If it rallies to $200 and consistently fails to break higher, $200 becomes static horizontal resistance 24. The more times a specific price level is tested without breaking, the more reliable and significant it is considered to be by the broader market 15. Furthermore, previous areas of tight consolidation - where prices traded sideways in a narrow band for an extended period - often act as thick horizontal zones of support or resistance when the price eventually returns to them 2.
In trending markets, analysts look for diagonal static lines. Assets trending steadily upward or downward create predictable diagonal support and resistance boundaries. In an uptrend, drawing a line connecting the sequentially higher lows forms a rising support trendline 425. As long as the price remains above this ascending line, the uptrend is considered structurally intact. In a downtrend, a line connecting the lower highs acts as diagonal resistance, indicating that sellers are stepping in at progressively lower prices and suppressing any attempted recovery 42516.
Dynamic Levels Using Moving Averages
Unlike static lines, dynamic support and resistance levels shift automatically as new price data is printed on the chart. The most ubiquitous tool for this is the Moving Average (MA), which smooths out volatile daily price data over a specific number of days to reveal the broader underlying trend 21517.
Institutional traders and algorithmic trading systems closely monitor major moving averages, particularly the 50-day and 200-day simple moving averages (SMA) 21518. In a healthy bull market, a stock's price will frequently pull back to touch its 50-day or 200-day moving average and immediately bounce, treating the curved moving average line as a dynamic trampoline 151930. Conversely, in a protracted bear market, the 200-day moving average often acts as a sloping ceiling of resistance that the asset continually struggles to surpass 30.
Another highly utilized dynamic tool is the Volume Weighted Average Price (VWAP). While simple moving averages only account for closing prices, the VWAP factors in the trading volume at each price level, representing the true average price paid by all market participants throughout the day 31. Traders deploy various strategies around the VWAP, utilizing it as a strict support or resistance filter 31. For instance, crossover strategies interpret a price moving above the VWAP as a bullish momentum shift where buyers have taken control, treating the VWAP line as new support. Slope momentum strategies examine whether the VWAP itself is rising or falling to confirm the broader trend direction 31.
Mathematical Models, Oscillators, and Volatility Bands
More advanced technical analysts rely on mathematical models and volatility bands to identify potential support and resistance zones that are not immediately obvious from simple price action.
One of the most popular mathematical methods relies on the Fibonacci sequence. Traders use Fibonacci retracement ratios - primarily 38.2%, 50%, and 61.8% - to identify potential reversal levels after a massive price swing 152520. If a stock rockets from $10 to $20, technical analysts will apply a Fibonacci grid to that $10 move. According to the theory, the stock is highly likely to find support when it "retraces" either 38.2% (dropping to $16.18), 50% (dropping to $15.00), or 61.8% (dropping to $13.82) of the original move 2520. While some attribute this to natural mathematical market symmetry, others argue it works simply because millions of algorithms and human traders are simultaneously watching and placing limit orders at these exact Fibonacci levels, creating a self-fulfilling prophecy 151321.
Volatility bands, such as Bollinger Bands and Keltner Channels, provide dynamic boundaries that expand and contract based on market volatility 222. Bollinger Bands plot an upper and lower envelope two standard deviations away from a simple moving average 22. These outer bands frequently act as exhaustion points; when an asset's price touches the upper band, it encounters heavy resistance as it is statistically overextended, and when it touches the lower band, it often finds support as it is statistically oversold 2322.
Traders also utilize momentum oscillators to confirm whether a support or resistance level is likely to hold. Indicators like the Relative Strength Index (RSI), Moving Average Convergence Divergence (MACD), and the Know Sure Thing (KST) oscillator help gauge the underlying strength of a move 172324. For example, the KST oscillator applies varying weights to multiple smoothed moving averages to identify cyclical momentum shifts; when the KST crosses above its moving average, it generates a bullish signal that can validate a successful bounce off a support level 24.
Comparison of Key Identification Methods
The following table summarizes the primary tools analysts use to establish structural market boundaries.
| Identification Method | Classification | Core Mechanism | Practical Application |
|---|---|---|---|
| Historical Price Action | Static | Connecting past swing highs and swing lows to find fixed price ceilings and floors. | Identifies major horizontal supply and demand zones 215. |
| Psychological Levels | Static | Focusing on whole numbers, half-dollars, and powers of 10. | Highlights areas where retail and institutional limit orders naturally cluster 1512. |
| Trendlines & Channels | Dynamic | Diagonal lines connecting higher-lows (uptrends) or lower-highs (downtrends). | Defines the structural boundaries of an ongoing directional trend 1525. |
| Moving Averages (SMA/VWAP) | Dynamic | Curves tracking average price over a set period (and volume for VWAP). | Acts as a trailing floor in bull markets and a trailing ceiling in bear markets 21531. |
| Fibonacci Retracements | Mathematical | Ratio-based calculations estimating natural percentage pullbacks. | Predicts where a correction will halt after a major impulsive price wave 1520. |
| Volatility Bands | Dynamic | Standard deviation boundaries (Bollinger) or Average True Range limits (Keltner). | Identifies statistically overbought (resistance) and oversold (support) extremes 222. |
The Mechanics of Breakouts, Breakdowns, and Role Reversals
Support and resistance levels are not impenetrable, permanent barriers. Eventually, the fundamental balance of supply and demand shifts decisively, and the price will punch through the boundary. How the market behaves during and immediately after these breaks dictates massive shifts in capital allocation.
When the Barrier Breaks
When an asset's price surges above an established resistance ceiling, the event is called a breakout 415. A breakout is widely viewed as a highly bullish technical signal 1021. It indicates that the sellers who previously defended the ceiling have been entirely exhausted, and aggressive buyers are now willing to pay increasingly higher prices for the asset. To confirm that a breakout is legitimate and not a temporary anomaly, analysts look for a massive surge in trading volume 91537. High volume during a breakout confirms that strong institutional demand is driving the move, rather than low-liquidity retail speculation 2325.
Conversely, when an asset plunges below an established support floor, it is called a breakdown 24. This is a severe bearish signal. It means the structural floor has collapsed; buyers have evaporated, and sellers are capitulating to unload their positions 22126. A breakdown often triggers a violent cascade of stop-loss orders that have been resting just below the support level, further accelerating the downward momentum in a highly volatile spike 226. Short sellers - traders who borrow shares to sell with the intent of buying them back lower - frequently use technical breakdowns as primary triggers to initiate their bearish positions 2327.
The Principle of Role Reversal
One of the most fascinating and consistent concepts in technical market analysis is the principle of "role reversal." When a major support or resistance level finally breaks, it frequently reverses its function entirely 236.
If a stock struggles to pass $100 for a year, establishing it as heavy resistance, but finally breaks out to $110 on positive earnings, the $100 level will almost certainly act as a floor of support in the future 2920. Traders who missed the initial explosive breakout will eagerly wait for a natural "pullback" to the $100 mark to buy in, treating the old ceiling as a new, safe entry floor 620.
The inverse is equally true. If a stock crashes below a reliable $50 support level and drops to $40, the $50 mark becomes a formidable new resistance ceiling 239. Investors who bought at $50 right before the crash are now trapped holding losing positions. If the price slowly recovers back toward $50, these trapped investors will aggressively sell to exit the trade at breakeven, creating immense new supply exactly at the old support level 1320.
Formulating Trading Strategies Around Key Levels
Identifying these boundaries is merely an analytical exercise; the primary reason traders dedicate so much effort to locating them is to formulate actionable, risk-managed trading strategies 4515.
Range Trading and Breakout Trading
When an asset is moving sideways in a period of extended consolidation, it is said to be "range-bound." Range traders exploit this lack of directional trend by executing a remarkably simple strategy: they buy when the price drops to the support floor and sell when the price rises to the resistance ceiling 21528. Because the market is not trending aggressively in either direction, traders can repeatedly capture the spread between the two levels until the range eventually breaks 2321.
Breakout traders deploy a completely different philosophy. Instead of buying the bounce within a range, breakout traders wait patiently for the exact moment a support or resistance level decisively fails. Their explicit goal is to "jump on the bandwagon" and ride the explosive momentum that typically follows a structural market break 152125. For instance, if an index breaks above a multi-year resistance level, a breakout trader will enter a long position immediately, anticipating that the sudden lack of overhead supply will allow the asset to run freely into price discovery mode 212529.
Risk Management and Stop-Loss Placement
Perhaps the most vital, structural function of support and resistance is assisting traders in strict risk management 1530. Professional institutional traders rarely enter a position without knowing exactly where they will exit if their thesis is incorrect. Support and resistance levels provide highly logical, non-emotional reference points for placing stop-loss orders 2931.
If a trader buys a stock bouncing off a well-established support level at $50, they might place a protective stop-loss order slightly below it, at $48.50. The logic is defensive: if the $50 floor cracks, the original premise for entering the trade is completely invalidated. The trader exits automatically with a tiny, controlled loss before the stock has a chance to plummet to $40 152629.
Similarly, traders actively shorting a stock at resistance will place stop-losses just above the ceiling. This is particularly crucial for short sellers due to the risk of a "short squeeze" 27. If a heavily shorted stock suddenly breaks above resistance, short sellers must rapidly buy back shares to cover their positions, which inadvertently drives the price exponentially higher. Monitoring the "short interest ratio" helps traders identify resistance levels that are vulnerable to these explosive squeezes 27. By placing stops just above resistance, short sellers protect themselves from unlimited upside risk 151629.
Asset Class Variations: From Equities to Cryptocurrencies
While the fundamental mechanical concepts of support and resistance apply universally across global markets, the behavioral nuances and reliability of these levels vary significantly across different asset classes. This variance is due to differences in market structure, liquidity profiles, and the underlying fundamental drivers of the assets 314546.
Equities, Bonds, and the Influence of Fundamentals
In the stock market, resistance might be established because a company's price-to-earnings ratio becomes historically expensive at a certain point, drawing in fundamental value sellers alongside technical traders 945. Equities often respect levels associated with fundamental corporate news, such as price gaps created during earnings announcements 245.
In sovereign bond markets, technical levels often align with critical macroeconomic policy thresholds. For instance, in the UK Gilt market, the 5% yield level acted as a massive psychological ceiling for 30-year yields from the late 1990s all the way to the 2008 financial crisis, repeatedly repelling upward moves 32. Similarly, in the Eurozone, a 3% yield on the 10-year German Bund has historically acted as a hard floor during multiple economic cycles 32. These levels reflect deep, structural consensus on sovereign fiscal policy.
Commodities and Forex Dynamics
Commodities markets are driven heavily by physical supply constraints, geopolitical risk, and seasonal patterns, but they show acute, almost irrational sensitivity to major psychological round numbers 232045. Academic studies testing the presence of psychological barriers in energy futures discovered that Brent Crude Oil exhibits distinct barrier behavior precisely around $10 increments 46. Interestingly, the data showed that when Brent Crude breaches a $10 barrier level from below during a rising trend, the immediate subsequent trend is for prices to fall on average, indicating massive supply clustered specifically at the tens 46.
The foreign exchange (Forex) market operates differently. Because FX is a decentralized, over-the-counter global market, traditional equity volume analysis is highly unreliable 45. Forex traders rely heavily on Fibonacci retracements and macroeconomic pivot points generated by central bank policy announcements. Currency pairs also exhibit extreme respect for "double zero" psychological round numbers 72045.
Cryptocurrencies and Pure Psychological Support
Cryptocurrencies represent a unique technical environment. Characterized by extreme historical volatility and a complete lack of traditional valuation metrics (such as cash flow or earnings per share), crypto relies vastly on pure psychological barriers 1310. Without fundamental anchors to tie value to, traders exhibit amplified "anchoring bias" to historical all-time highs and round numbers 1310.
Peer-reviewed studies on cryptocurrency market dynamics have found highly significant evidence of price clustering in Bitcoin, Litecoin, and Ripple 1033. Research indicates that Bitcoin daily closing prices heavily cluster around round numbers, and intraday trading shows psychological barriers forming systematically at round integers 141033. Because the market is heavily populated by inexperienced retail investors susceptible to decision-making biases, technical charting and psychological price barriers often dictate crypto market structure more heavily than in deeply institutionalized equity markets 10.
Summary of Asset Class Differences
| Asset Class | Behavioral Nuances for Support & Resistance | Primary Technical Drivers |
|---|---|---|
| Equities (Stocks) | Heavily influenced by fundamental anchors like earnings reports, valuation multiples, and dividend yields. Levels often align with 52-week highs/lows. | Moving averages, gap zones, corporate news events 3045. |
| Sovereign Bonds | Yield levels act as profound psychological floors/ceilings reflecting structural consensus on inflation and central bank monetary policy. | Decadal historical yield peaks/troughs (e.g., 5% ceilings) 32. |
| Forex (Currencies) | Extremely sensitive to macroeconomic data. Because FX is decentralized, traditional volume is less reliable. Pure price action dominates. | Fibonacci retracements, round numbers, central bank pivots 2045. |
| Commodities | Driven by physical supply constraints. Exhibits acute sensitivity to major psychological numbers (e.g., $10 increments in Brent Crude). | Previous peaks/troughs, supply/demand imbalances 234546. |
| Cryptocurrencies | Characterized by a lack of traditional valuation metrics. Relies vastly on pure psychological barriers and historical peaks, amplifying clustering. | Round numbers (e.g., $50k, $100k), all-time highs 131410. |
Historical Case Studies in Technical Price Barriers
Observing real-world historical examples illustrates precisely why professional analysts fixate on these geographical chart levels, particularly during times of extreme macroeconomic stress, broad market panic, or speculative euphoria.
The 2008 Financial Crisis and 2020 Market Crash
During the brutal, protracted bear market of 2008, analysts closely watched long-term moving averages and historical floors to gauge systemic risk. By late 2008, the S&P 500 had violently broken below major support levels that had successfully held for years, signaling widespread capitulation and a total loss of liquidity 4950. The breach of these support levels coincided with massive spikes in the VIX (Volatility Index), confirming that fear had overridden any rational valuation metrics 34. It was not until the index found a definitive bottom in March 2009 that a new multi-year diagonal support trendline was established, providing the structural foundation for the subsequent decade's historic bull market 49.
A similar, though much faster, dynamic played out during the 2020 COVID-19 crash. When global markets collapsed in March 2020, fear was rampant and valuations were discarded. However, institutional technical traders noticed that the Dow Jones Industrial Average abruptly halted its freefall and found a hard floor right around the 18,000 level 23. This was not a random stabilization point; 18,000 was a highly significant historical support and resistance zone dating back to 2016. The fact that this deep support level held amidst unprecedented global panic gave institutional investors the technical confirmation required to begin accumulating shares again, sparking a massive V-shaped reversal 2349.
Tesla's Post-Earnings Value Rejection
Technical levels are highly effective for gauging shifts in individual corporate sentiment. In May 2026, Tesla (TSLA) stock presented a textbook example of a failed resistance breakout. Following an earnings report, the stock attempted a strong post-earnings repair, pushing aggressively into an upper resistance zone 53.
However, buyers failed to maintain control at those higher valuations. The stock suffered an "upper-zone rejection" at the $422-$428 resistance band, failing to sustain acceptance near the upper part of its post-event range 53. Quantitative models, such as the InvestingLive structure read, assigned Tesla a bearish score of -5 out of +10, noting that the failure at resistance signaled a rapid rotation from "repair mode" back into "distribution risk" 53. The stock's inability to turn that $428 resistance ceiling into a new support floor dictated a tactical bearish bias for the weeks following the earnings event 53.
Gold's Multi-Year Battle with the $2,000 Ceiling
Commodities often wage multi-year wars against round-number psychological barriers. For over a decade, Gold struggled against heavy historical resistance. After peaking near $1,900 in 2011, that exact price level acted as an impenetrable ceiling for years, repeatedly repelling any attempted rallies 23.
In 2020, amidst pandemic uncertainty, Gold finally broke out above $1,900, shifting the battleground slightly higher. By early 2024, Gold was repeatedly testing the ultimate psychological resistance level of $2,000 per ounce. Every time it touched $2,000, sellers emerged to push it down. When it finally broke decisively above $2,000 in March 2024, the technical breakout triggered a massive algorithmic momentum rush, sending the precious metal to successive all-time highs over $2,600 within months 14. The $2,000 ceiling had effectively shattered, and per the strict rules of technical role reversal, would subsequently be viewed by global markets as a long-term foundational floor 1423.
Why Support and Resistance Levels Fail
For all their utility and prevalence in professional analysis, support and resistance levels are not foolproof mechanisms. Traders who treat them as guaranteed safety nets or infallible mathematical laws frequently incur devastating losses. Understanding precisely why these levels fail is arguably more important than knowing how to find them 26.
First, a common mistake among novice traders is assuming levels are exact, razor-thin lines rather than broad zones 145. Assuming a stock will reverse exactly at $100.00 is a statistical improbability. In reality, the stock might dip to $99.10 or bounce early at $101.50 due to minor supply/demand imbalances. Market mechanics are inherently messy. Treating support and resistance as thick, porous bands on a chart prevents premature exits and unrealistic entry expectations 4526.
Second, markets frequently produce "false breakouts," colloquially known as "whipsaws" or "bull/bear traps" 162526. A stock might break above a heavy resistance level, triggering a flood of retail breakout buyers, only to abruptly collapse back below the line the very next day, trapping the new buyers in a losing position 25.
False breakouts are frequently the result of institutional "liquidity hunting." Large institutional traders and algorithmic market makers are acutely aware that retail traders place dense clusters of stop-loss orders just below major support or just above major resistance 26. To execute massive institutional block trades without moving the market against themselves, these entities will intentionally push the price through a key technical level just enough to trigger that cluster of stop-loss orders. This creates an artificial flush of liquidity, which the institution absorbs to fill their own orders, before immediately reversing the price back into the original range 26.
Finally, and most importantly, macroeconomic events unconditionally override technical analysis 2326. No matter how robust a support level looks on a weekly chart, if a company announces an SEC investigation, or a central bank unexpectedly hikes interest rates by 50 basis points, the resulting panic will tear through technical boundaries as if they did not exist 26. Resistance and support are born from historical memory, anchoring bias, and standard market psychology; a sudden, disruptive shift in real-world fundamental data will reset the entire playing field instantly, rendering past chart patterns entirely obsolete.
Bottom line
Support and resistance levels serve as the foundational architecture of technical market analysis, providing investors with a visual map of where supply and demand are most heavily concentrated. By understanding that these geographical boundaries are ultimately driven by predictable human psychology - specifically anchoring bias, loss aversion, and a documented attraction to round numbers - market participants can better anticipate where price trends might logically halt, reverse, or accelerate. While they are invaluable tools for identifying trade setups, managing risk, and placing logical stop-loss orders, prudent analysts must remember that these lines are pliable zones, not impenetrable walls, and they remain permanently vulnerable to shifting macroeconomic fundamentals and institutional liquidity hunting.