
What Is a Pullback and How to Trade It
A pullback is a temporary price decline within an established overarching trend, often caused by short-term profit-taking or shifting market sentiment. Traders use these brief dips as strategic entry points, aiming to buy into a strong asset at a more favorable price just before the primary upward trend resumes.
The Mechanics of Market Movement
Financial markets do not move in straight lines. Whether you are observing individual equities, foreign exchange pairs, or major indices like the S&P 500, price action unfolds in waves. Even in the most aggressive bull markets, upward surges are periodically interrupted by counter-trend declines 123.
These temporary pauses are known as pullbacks, retracements, or consolidations. For an intelligent investor or trader, recognizing a pullback is a foundational skill. It is the practical application of the oldest adage in finance: "Buy low, sell high." Rather than chasing an asset after it has already surged to new highs - a scenario that leaves the buyer vulnerable to a sudden correction - pullback traders wait patiently for the market to catch its breath. They aim to enter the market along the path of least resistance, aligning their capital with the dominant trend while defining their risk tightly 13.
Understanding pullbacks requires a mix of technical market analysis, an understanding of human psychology, and strict risk management. Entering on a pullback assumes that the primary trend remains intact and that the short-term counter-move is merely a temporary fluctuation driven by market mechanics rather than fundamental failure 343. The goal is to identify zones where institutional demand historically overpowers retail supply, offering a high-probability opportunity to join a mature trend.
Pullbacks vs. Reversals: Spotting the Difference
One of the most common and costly challenges traders face is confusing a temporary pullback with a permanent trend reversal 245. At first glance, both phenomena look identical on a price chart: an asset that has been climbing steadily suddenly changes course and begins to drop. However, beneath the surface, the mechanics and institutional footprints of these two events tell completely different stories. If a trader mistakes a reversal for a pullback, they will buy into a falling market and watch their losses mount. If they mistake a pullback for a reversal, they will prematurely exit a winning position 24.
The Psychology and Anatomy of a Pullback
A pullback is typically a symptom of short-term exhaustion and routine market mechanics. Imagine a stock that has just rallied twenty percent over two weeks following a surprisingly positive earnings report. Early investors and short-term speculators who rode the wave up will inevitably begin to sell some of their shares to lock in their gains 56. This profit-taking creates a temporary surplus of supply in the order book, pushing the asset's price down.
Because the underlying fundamentals and the broader market sentiment remain positive, this downward move lacks aggressive conviction. Volume usually contracts, meaning significantly fewer shares are changing hands during the decline than during the preceding rally 3497. The broader market is essentially waiting for the asset to reach a "fairer" or more discounted price before stepping back in to buy. During this phase, price dips but ultimately creates a "higher low" compared to the previous trough, preserving the structural integrity of the uptrend 198.
The Anatomy of a Trend Reversal
A reversal, conversely, signals a genuine, long-lasting shift in the overall trend direction 44. In an uptrend, a reversal marks the death of the bull run and the birth of a new downtrend. Reversals are not driven by light retail profit-taking; they are driven by a fundamental shift in valuation, negative macroeconomic news, or heavy institutional distribution, where large funds aggressively unwind massive positions.
Because of this aggressive selling pressure, reversals are typically accompanied by a sharp spike in trading volume - often surging fifty to over one hundred and fifty percent above the average daily volume 459. Furthermore, while a pullback will respect key support levels and maintain a pattern of higher highs and higher lows, a reversal will slice completely through those support levels, breaking the market's structural foundation and establishing a lower low 29.
Price alone is rarely enough to tell the full story in the early stages of a decline. The interaction between price, volume footprints, and major moving averages provides the necessary context to determine whether an asset is merely catching its breath or beginning a sustained decline 3412.
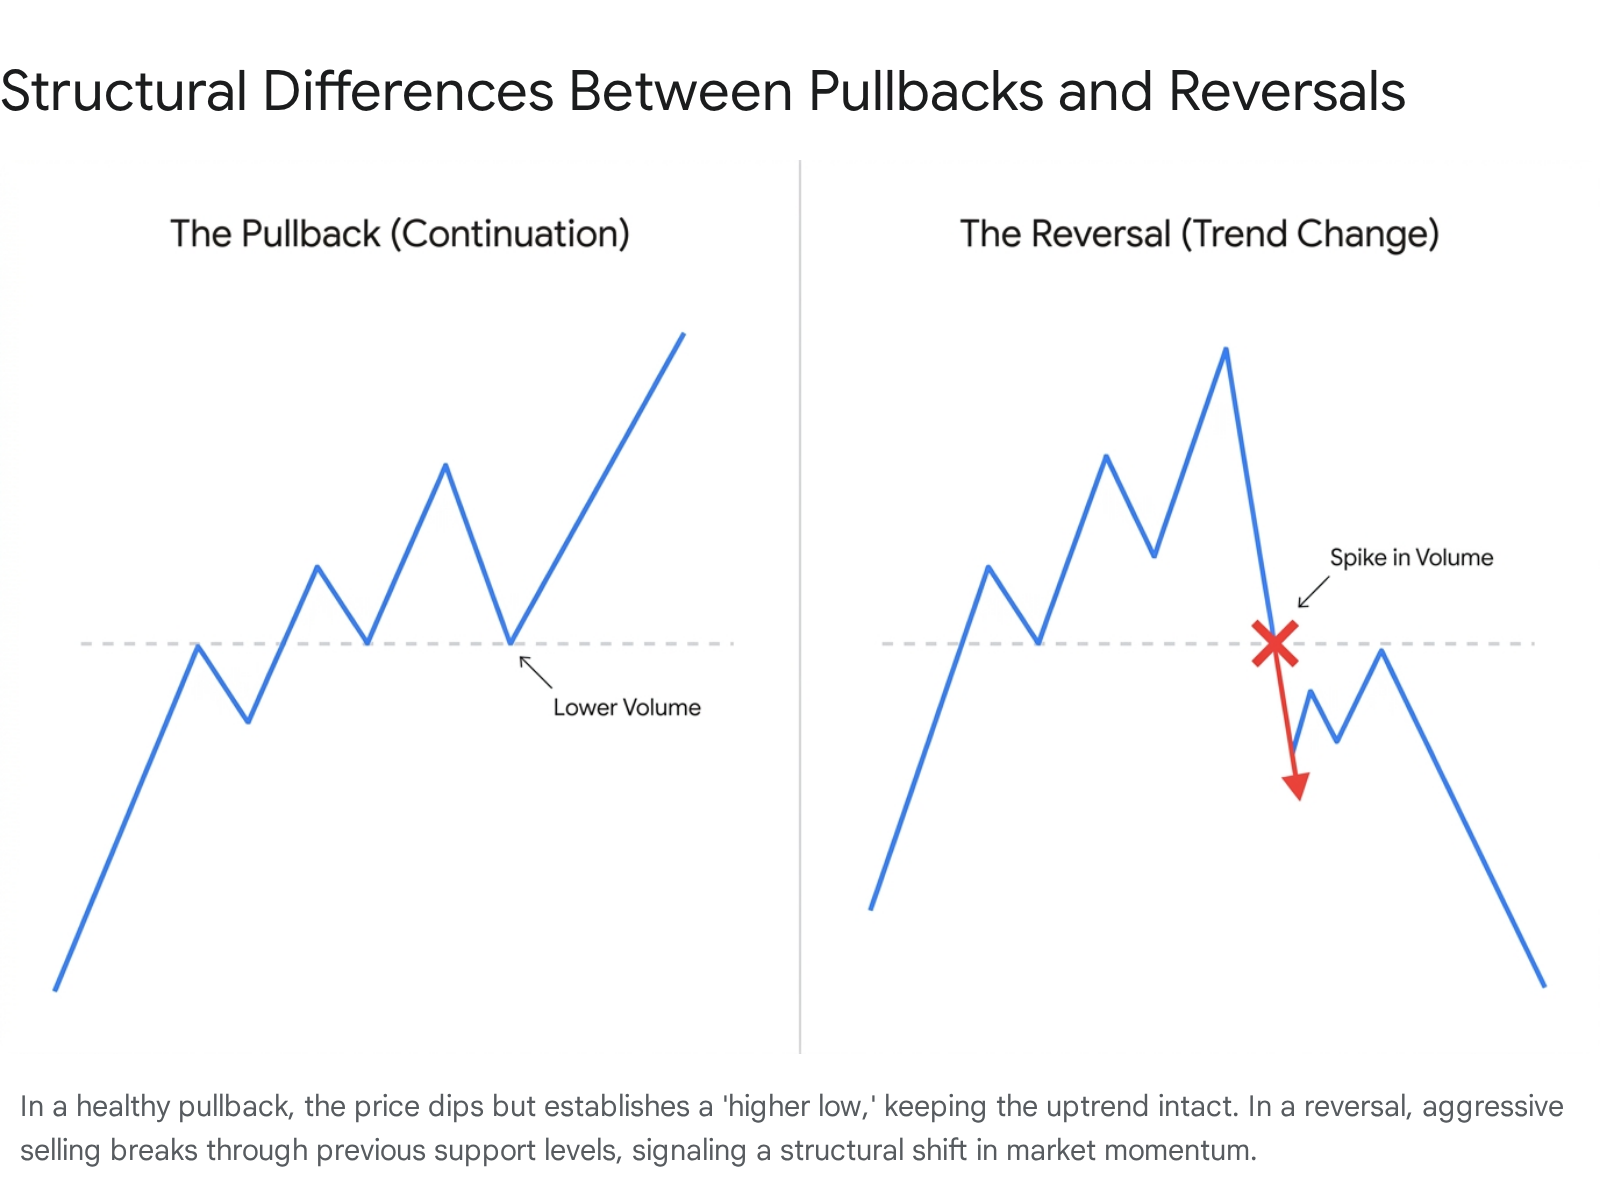
Summary of Structural Differences
| Market Characteristic | Pullback (Temporary Dip) | Trend Reversal (Permanent Shift) |
|---|---|---|
| Market Structure | Maintains higher highs and higher lows. | Breaks trend entirely; creates lower lows. |
| Typical Duration | Short-term (e.g., three to five periods). | Long-lasting (weeks, months, or years). |
| Trading Volume | Noticeable drop; typically declines twenty to thirty percent. | Sharp spike; often surges fifty percent or more above average. |
| Technical Support | Respects moving averages and trendlines. | Slices through major moving averages and structural support. |
| Market Psychology | Routine profit-taking, short-term hesitation. | Institutional exit, fundamental shift in macroeconomic sentiment. |
(Data compiled from standard technical analysis definitions and volume footprint characteristics 3499)
The Academic Divide: Efficient Markets vs. Behavioral Finance
Before diving into the specific tactical execution of buying a pullback, it is crucial to address a long-standing divide in the financial world. Does buying the dip based on chart patterns actually yield market-beating returns, or is it merely an illusion of control? The answer depends heavily on whether one views the market through the lens of traditional economic theory or behavioral finance.
The Efficient Market Hypothesis (EMH)
For decades, the dominant academic framework for understanding financial markets has been the Efficient Market Hypothesis (EMH), popularized by economist Eugene Fama in the late 1960s and 1970s. EMH argues that financial markets are highly efficient information-processing machines, quickly and accurately reflecting all known variables into an asset's current price.
In its "weak form," the EMH explicitly states that current asset prices already fully reflect all historical trading data, including past prices, historical volume, and trend trajectories 101112. If the weak-form EMH holds true, then technical analysis - the practice of studying charts, trendlines, and pullbacks to predict future price movements - is essentially useless. Under this strict theoretical framework, prices follow a "random walk," meaning tomorrow's price movement is entirely independent of today's, making it impossible to consistently profit from historical patterns 171314. From a strict academic standpoint, any trader who claims to consistently profit by buying pullbacks is either experiencing temporary luck, falling prey to data-snooping biases, or taking on hidden risks, as an efficient market would rapidly arbitrage away any predictable patterns 131516.
Behavioral Finance and the "Herd Mentality"
However, the daily realities of professional traders, quantitative analysts, and proprietary trading desks tell a distinctly different story. Trillions of dollars are managed by institutions that actively exploit chart patterns, algorithmic trend-following, and momentum 1017. The academic counter-argument that justifies this reality is found in Behavioral Finance.
Behavioral finance studies the psychological biases and cognitive errors that human beings exhibit when making financial decisions under pressure. Proponents of this field argue that markets are absolutely not perfectly efficient because humans are not perfectly rational actors. Investors routinely exhibit "herd mentality," systematically overreacting to bad news (causing exaggerated, deeply discounted sell-offs) and underreacting to gradual, positive fundamental changes 101217.
A pullback is viewed by behavioral economists as a measurable, repetitive manifestation of these inefficiencies. When a stock climbs rapidly, the human fear of losing unbooked profits triggers a premature wave of selling, artificially depressing the price below its intrinsic momentum value. Technical traders who buy the pullback are essentially providing liquidity to these emotional sellers, acting as a stabilizing force and earning a risk premium for doing so 1017.
The Real-World Synthesis
While academic research yields mixed results on the profitability of basic charting rules, several extensive studies acknowledge that technical analysis can provide substantial aggregate returns when applied with sophisticated risk management, particularly in foreign exchange markets and high-frequency trading 1716.
Furthermore, as the market becomes increasingly dominated by algorithmic trading, certain technical levels - like a fifty-day moving average or a major trendline - become self-fulfilling prophecies. If enough institutional computers are programmed to buy a stock when it pulls back exactly ten percent to a major trendline, the market will bounce at that precise level regardless of fundamental efficiency 710. Ultimately, while EMH suggests that casually outperforming the market is nearly impossible long-term, practitioners maintain that human emotion guarantees that trends will continue to "breathe" through predictable pullbacks, creating actionable opportunities for the disciplined trader.
Technical Entry Strategies: How to Buy the Dip
Assuming a market is in an established, confirmed uptrend, how does a trader decide exactly when to buy the dip? Entering a pullback is never a matter of random guessing or gut feeling; it relies on identifying specific areas of historical or dynamic support where institutional buying pressure is highly likely to overwhelm retail selling pressure. Traders generally rely on four primary structural strategies to pinpoint their entries 11824.
Moving Average Bounces (Dynamic Support)
Moving averages (MAs) are technical indicators that smooth out erratic daily price data by creating a constantly updated average price over a specific number of historical periods. In strong trends, moving averages act as "dynamic support" - an invisible, rising floor that tracks upward alongside the price 1819.
The most common moving averages used for pullback entries are the twenty-period, fifty-period, and two-hundred-period Exponential Moving Averages (EMA) or Simple Moving Averages (SMA) 181920. * In a fast-moving, aggressive uptrend, price will often dip slightly, touch the sensitive twenty-day MA, and immediately bounce higher, providing rapid entry signals. * In a more moderate, sustained trend, the fifty-day MA is widely considered the gold standard for pullback entries, heavily monitored by mutual funds and institutional investors 1319. * The strategy requires deliberate patience: the trader waits for the price to fall back to the moving average, watches for the price action to stabilize, and buys the bounce, placing a stop-loss just below the moving average line 21921.
The Break and Retest (Horizontal Support)
One of the foundational axioms of technical analysis is that "old resistance becomes new support." This concept relies heavily on market memory and order clustering.
Imagine a stock that has struggled to break past the one-hundred-dollar mark for several months. The one-hundred-dollar level acts as a firm ceiling, or resistance. Eventually, strong buying pressure shatters that ceiling, and the stock rapidly surges to one hundred and ten dollars. As profit-taking eventually sets in, the stock begins to pull back. According to the break-and-retest strategy, that old one-hundred-dollar ceiling will now act as a hard floor 122.
Traders will place buy orders near the one-hundred-dollar mark, anticipating that the market will "retest" the breakout level before continuing its ascent. This is considered one of the safest and most reliable pullback entries, as it relies on clearly established historical price zones that all market participants can easily identify 122.
Trendlines, Channels, and the Two-Legged Pullback
For traders who prefer minimalist price action without relying on lagging mathematical indicators, manually drawn trendlines are the tool of choice. An uptrend line is drawn by connecting at least two distinct "higher lows" on a chart, creating a visual diagonal floor 181923. As the trend progresses, the market will often trade within a defined diagonal channel. Traders will wait for the price to drop and touch the ascending trendline for a third or fourth time, buying upon contact 2419.
Within trendline trading, advanced practitioners often look for complex corrections, such as the "Two-Legged Pullback" popularized by price action expert Al Brooks. In this scenario, the market pulls back from a high (leg one), attempts a brief but weak rally, and then pulls back a second time to touch a trendline or moving average (leg two). This two-legged structure effectively traps impatient counter-trend sellers, creating a powerful slingshot effect when the primary trend resumes 24.
Fibonacci Retracements and the Golden Ratio
The Fibonacci retracement tool is based on a mathematical sequence that frequently appears in nature, architecture, and, remarkably, in human trading behavior. Technical analysts use this tool to measure the absolute size of a prior upward surge and project percentage levels where a pullback is statistically likely to exhaust itself 1519.
The most commonly watched Fibonacci retracement levels are 38.2 percent, 50.0 percent, and 61.8 percent 17824. * 38.2% Retracement: Indicates a shallow pullback. This is typical of a very aggressive, high-momentum bull market where eager buyers refuse to let the price drop significantly before stepping in. * 50.0% Retracement: A massive psychological midpoint. The market gives back exactly half of its recent gains before resuming the trend. This level is intensely defended by algorithmic trading systems. * 61.8% Retracement: Known mathematically as the "golden ratio." This is often considered the deepest acceptable pullback in a healthy trend. If the price falls significantly below the 61.8 percent level, the underlying market structure is likely broken, suggesting the pullback is actually mutating into a full reversal 1192425.
Comparing Pullback Entry Triggers
| Strategy Trigger | Best Market Environment | Main Advantage | Primary Vulnerability |
|---|---|---|---|
| Moving Averages (e.g., 50-day) | Smooth, sustained trends. | Dynamic; automatically adjusts upward as the price climbs higher over time. | Lags behind sudden, sharp price actions, potentially giving late signals. |
| Horizontal Support (Break & Retest) | Breakout markets clearing major resistance ceilings. | Uses hard historical price data that all participants, including algorithms, easily recognize. | May not occur at all if the asset is too strong to ever return to the breakout point. |
| Trendlines / Channels | Orderly markets with clear, rhythmic swing highs and lows. | Highly visual; explicitly clear when a structural trend is definitively broken. | Highly subjective; different analysts may draw the lines at slightly different angles. |
| Fibonacci Retracements (61.8%) | Deep corrective phases following massive momentum surges. | Provides precise, mathematical target zones calculated in advance of the price dropping. | Can result in "catching a falling knife" if the 61.8% level fails to hold. |
Confirming the Entry: Candlesticks and Momentum
Identifying a support zone using a moving average or a Fibonacci level is only half the battle. A disciplined pullback trader does not place a blind buy order simply because a price touched a line on a screen. They wait for explicit confirmation that the selling pressure has actually stopped and that buyers have decisively regained control. This confirmation is primarily found using Japanese Candlestick patterns and mathematical Momentum indicators 12024.
Bullish Candlestick Reversal Patterns
Candlesticks represent price action within a specific time frame (such as one day, or one hour), showing the opening, highest, lowest, and closing prices. When a pullback reaches a predetermined support level, traders heavily scrutinize the shape of the candlesticks to prove buyers are stepping in 2426.
The Hammer (or Bullish Pin Bar) is widely considered one of the most reliable pullback confirmation signals. This candlestick has a small "real body" located at the top of its range and a disproportionately long lower wick, resembling a hammer. The long lower wick is the footprint of a battle: it shows that sellers tried to push the price down aggressively during the session, but buyers fought back fiercely, rejecting those lower prices and driving the asset back up by the time the session closed 24273428. When a hammer forms exactly on a fifty-day moving average, it is a high-probability buy signal.
Another powerful signal is the Bullish Engulfing Pattern. This is a two-candle sequence occurring at the bottom of a pullback. A small red (downward) candle is immediately followed the next day by a massive green (upward) candle that completely "engulfs" the previous day's entire price movement. It signals a sudden, violent shift in momentum, indicating that bears have exhausted their supply and bulls have taken complete command of the order book 242634.
Validating with Momentum Indicators
Traders also utilize mathematical oscillators to confirm that a pullback has run out of downward steam, adding a layer of objective data to the visual chart patterns.
The Relative Strength Index (RSI) measures the speed and change of price movements on a fixed scale of zero to one hundred. During a healthy uptrend, a pullback will often drag the RSI down into "oversold" territory (typically a reading dipping below 45 or 30). A trader will wait for the RSI to bottom out, turn back up, and cross out of the oversold zone. This mechanical trigger indicates that the temporary selling pressure has abated and the primary trend is resuming 7892021.
Similarly, the Moving Average Convergence Divergence (MACD) can be utilized to show when downward momentum is decelerating. Even if the price is still dropping slightly, a MACD histogram that begins ticking upward indicates "bullish divergence," offering a green light to buy the dip with confidence 78.
Risk Management: Protecting Capital from False Pullbacks
Because even the most picture-perfect, deeply researched pullback can fail due to sudden news or macroeconomic shifts, professional traders rely heavily on rigid risk management. Without it, a single failed pullback that spirals into a broader market crash can wipe out months of meticulously accumulated profits 23637.
The Mathematics of Position Sizing (The 1% Rule)
Position sizing is the mathematical heartbeat of trader survivability. The golden rule among professional risk managers is the "1% Rule": a trader should never risk losing more than one percent (or a similarly small, fixed percentage) of their total trading capital on any single trade 363729.
For example, if a trader operates a $10,000 account and rigorously applies the one percent rule, their maximum allowable loss on a trade is exactly $100. If their technical analysis dictates that their protective stop-loss order must be placed $0.50 below their entry price, they simply divide the total risk amount ($100) by the stop distance ($0.50). This calculation reveals they can safely buy exactly 200 shares 37. By treating risk as a fixed mathematical constant, the pullback trader ensures that a failed trade is merely a routine business expense, not an account-destroying event 3637.
Strategic Stop-Loss Placement
A stop-loss is an automated, resting order placed with a brokerage to immediately sell the asset if it drops to a certain price, capping the maximum allowable loss 193729. In pullback trading, precision in stop-loss placement is vital. The stop-loss is usually placed just below the recent "swing low" - the absolute lowest point of the pullback dip 2912.
The logic here is purely structural. If the price breaks firmly below that swing low, it mathematically invalidates the entire premise of the uptrend (since the market is now making "lower lows" rather than "higher lows"). Once the structure is broken, the trader has no business being in the position. Institutional traders generally risk one to two percent beneath the entry point, or use a slightly wider stop (three to five percent) to account for daily volatility and algorithmic "stop hunting" - a phenomenon where high-frequency trading computers temporarily spike prices down to trigger retail stop-loss orders before immediately rallying the price 93730.
In highly volatile environments, some professionals utilize a "staggered stop" approach, placing a tight one-to-two percent stop on half their position to minimize immediate damage, while giving the remaining half an eight-to-ten percent breathing room to weather exceptionally choppy conditions 12.
Real-World Case Studies in Major Global Indices
To fully grasp how these concepts operate outside of textbooks, it helps to examine how pullbacks manifest across different global assets and indices, each with their own unique structural quirks and economic drivers.
The S&P 500: Interest Rates and Tech Sector Rotations
In the United States equity markets, broad capitalization-weighted indices like the S&P 500 frequently experience violent pullbacks driven by macroeconomic fears, even when underlying corporate fundamentals and earnings remain incredibly strong.
For example, during extended technology and artificial intelligence-driven rallies, sudden upward spikes in Treasury yields or unexpected inflation data can trigger sharp, sudden sell-offs. This is particularly prevalent in the semiconductor space, tracked by indices like the Philadelphia Semiconductor Index (SOX) 3132. In these environments, high-flying tech stocks often drop quickly to test their twenty-day or fifty-day moving averages as institutional portfolios rapidly rebalance their risk.
For technical traders, if the broader economic indicators (like employment and GDP growth) remain expansionary, these interest-rate-driven dips are aggressively treated as classic, buyable pullbacks. The underlying thesis is that the AI infrastructure build-out remains intact, and the drop is merely a temporary repricing of valuation multiples rather than the onset of a structural bear market 313233.
The Nikkei 225: Currency Correlations and Price Weighting
Japan's Nikkei 225 index offers a highly unique and volatile environment for pullback traders. Because it is a price-weighted index - meaning constituents are weighted by their absolute share price rather than their total market capitalization - it is heavily influenced by a handful of massive, high-priced export companies like Fast Retailing (Uniqlo) and Tokyo Electron 343536. A ten percent move in Fast Retailing alone can shift the entire Nikkei average by hundreds of points 34.
Furthermore, the Nikkei's movements are deeply intertwined with the Japanese Yen (USD/JPY). When the Yen strengthens significantly, Japanese exporters face severe profit headwinds, often triggering sharp, immediate pullbacks in the Nikkei index. Shrewd index traders do not just look at isolated chart support levels; they cross-reference the currency markets. If the Bank of Japan maintains a loose monetary policy and the Yen resumes its long-term weakening trend, technical pullbacks in the Nikkei down to historical round numbers (e.g., the 40,000 level) or major Fibonacci extensions become incredibly high-probability entry points 343537.
The DAX 40: Seasonal Cyclicality and Technical Cleanliness
In European markets, the German DAX 40 exhibits fascinating, highly repetitive seasonal pullbacks that technical analysts have exploited for decades. Historical data spanning thirty years reveals that the DAX consistently experiences pronounced weakness in late summer, specifically in August and September. These months average losses of 2.3 percent and 1.7 percent, respectively, driven largely by reduced summer trading volumes across European desks and institutional portfolio rebalancing ahead of the fourth quarter 38.
Rather than panicking or assuming the European economy is collapsing, experienced traders recognize this autumn weakness as a purely structural, seasonal pullback. Because the DAX is traded on the highly centralized Xetra electronic platform, it compresses institutional activity into a tight daily window, resulting in very "clean" technical movements that respect trendlines beautifully 25. Traders will patiently scale into long positions at key Fibonacci and horizontal support levels during these dark September months, directly anticipating the historically robust November rally, which has historically averaged exceptional gains exceeding 3.2 percent 253848.
Bottom line
A pullback is a natural, healthy feature of all trending financial markets, providing disciplined traders with a defined-risk opportunity to buy into an appreciating asset at a temporary discount. By combining structural market analysis - such as identifying dynamic moving averages and horizontal support - with momentum confirmation tools like candlesticks, traders can systematically exploit these dips without relying on guesswork. However, the strategy demands immense discipline and rigorous position sizing; the line between a brief market correction and a permanent trend reversal is exceedingly thin, and failing to execute a strict stop-loss plan when a pullback breaks structural support can turn a calculated risk into a devastating financial loss.