
Efficacy of Fibonacci retracement in financial markets
The application of Fibonacci retracement levels within financial technical analysis remains a subject of rigorous debate between academic econometricians and market practitioners. Derived from a mathematical sequence introduced to Western European mathematics in the 13th century, the technical indicator overlays specific percentage ratios onto asset price charts to predict zones of future support and resistance 12. Proponents theorize that these ratios reflect intrinsic mathematical laws governing human behavioral economics and market dynamics 23. Conversely, skeptics and proponents of the Efficient Market Hypothesis (EMH) categorize the practice as market numerology, attributing any apparent success to cognitive biases, data-snooping artifacts, or pure randomness 156.
A comprehensive examination of empirical evidence reveals a highly nuanced operational reality. Academic backtesting indicates that while Fibonacci ratios lack inherent macroeconomic causality, they frequently demonstrate statistically significant predictive power under specific market regimes 28. This efficacy does not stem from mystical mathematical alignment. Instead, it is the product of behavioral coordination, self-fulfilling prophecies, and modern institutional liquidity engineering, wherein algorithmic actors explicitly exploit the psychological predictability of retail traders who rely on these exact ratios 291011.
Mathematical Derivation of Retracement Ratios
The structural architecture of the Fibonacci retracement tool relies entirely on the Fibonacci sequence, a series of integers where each subsequent number is the sum of the two preceding values (0, 1, 1, 2, 3, 5, 8, 13, 21, 34, 55, 89, 144, 233...). While the integer sequence is unbounded, the mathematical relationships between the numbers converge toward specific limits that form the core of the technical indicator 12.
Core Sequence Convergence
The primary ratios utilized in financial charting are derived through specific divisional relationships within the progression of the sequence. As the sequence approaches infinity, the ratio of any number to the immediate succeeding number converges to approximately 0.618 13315. This specific value is mathematically recognized as the inverse of the Golden Ratio (Phi) and serves as the foundational 61.8% retracement level in technical analysis, widely regarded by practitioners as the most critical reversal zone 123.
Additional retracement levels are derived by systematically modifying the divisional gap between sequence numbers. The table below outlines the mathematical derivations of the standard Fibonacci coordinates deployed on modern charting platforms.
| Retracement Level | Mathematical Derivation | Market Significance |
|---|---|---|
| 23.6% | Number divided by the value three places to the right (e.g., 21/89). | Indicates a shallow pullback; typically observed only in exceptionally strong, high-momentum trends 1316. |
| 38.2% | Number divided by the value two places to the right (e.g., 34/89). | Represents a moderate pullback; frequently utilized as an initial entry zone by retail trend-followers 1317. |
| 50.0% | Derived from Dow Theory; not a true Fibonacci sequence calculation. | Serves as a psychological midpoint and mean-reversion equilibrium level 51718. |
| 61.8% | Number divided by the immediate succeeding value (e.g., 55/89). | The "Golden Ratio"; statistically the most robust zone for coordinated trend reversals and institutional entries 31719. |
| 78.6% | The square root of 0.618. | Represents a deep retracement; frequently serves as the final structural defense before a trend is entirely invalidated 171920. |
Execution Mechanics on Price Charts
In applied technical analysis, traders overlay these mathematical ratios onto a price chart by identifying a significant prior trend, marked distinctly by a swing low and a swing high 34. The absolute vertical distance between these two price extremes is divided by the core Fibonacci percentages to project horizontal price coordinates. These horizontal lines designate potential demand (support) or supply (resistance) zones where a corrective price pullback might encounter opposing institutional order flow, causing the price to consolidate or reverse before resuming the primary macroeconomic trend 1316.
The fundamental assumption underlying this application is that market price corrections are rarely linear or random. Instead, they exhibit a tendency to exhaust their counter-trend momentum at proportional fractions of the initial impulse wave, allowing traders to mathematically structure their entry, stop-loss, and take-profit parameters 3422.
Empirical Testing in Equity and Commodity Markets
The academic finance community has historically viewed technical analysis with profound skepticism, heavily favoring asset pricing models and the Efficient Market Hypothesis, which posits that asset prices fully reflect all available fundamental information 5. However, recent empirical studies utilizing advanced computational backtesting have sought to quantify the actual predictive power of Fibonacci retracements across varied asset classes and market microstructures.
Evaluation of Energy Equities and Cryptocurrencies
Investigations into traditional equity markets provide mixed but highly informative results regarding the operational validity of Fibonacci levels. A comprehensive study analyzing leading U.S. energy companies mapped Fibonacci retracements as an active trading system against a standard buy-and-hold benchmark between 2017 and 2020 26. The findings indicated that a systematic Fibonacci-based strategy resulted in superior total returns compared to the naive buy-and-hold model, capturing energy stock price fluctuations more efficiently than digital assets 2. For instance, applying the Fibonacci strategy to ConocoPhillips (COP) yielded a 177% return, radically outperforming the 29.8% return generated by the buy-and-hold strategy 2.
However, the efficacy of the indicator demonstrated significant directional asymmetry, revealing structural limitations. Price violations - instances where the asset price decisively breached the retracement level without reversing - were substantially more frequent during broader macroeconomic downtrends than during uptrends 26. During bullish market regimes, the 61.8% level experienced the most violations as momentum carried prices through initial support. Conversely, during bearish trends, the 23.6% level saw the highest failure rate 2. This asymmetric failure rate suggests that the tool's reliability is not absolute but is highly dependent on the overarching market regime and prevailing investor sentiment.
Efficacy in Emerging Market Exchanges
In emerging markets, similar modest but statistically notable efficacy has been documented. An analysis of the Pakistan Stock Exchange (PSX) focusing on four randomly selected companies within the cement sector evaluated the predictive power of Fibonacci sequences over a targeted fiscal quarter. The researchers empirically identified that 27% of major support levels (17 out of 63) and 36% of major resistance levels (24 out of 66) aligned precisely with standard Fibonacci retracements 16727.
While these percentages indicate that the majority of turning points occurred at non-Fibonacci coordinates, the concentration of reversals directly at Fibonacci nodes was high enough to lead researchers to conclude that trend reversals follow these mathematical ratios to a statistically relevant extent in specific equities 727. Furthermore, structural differences between Asian and Western exchanges heavily influence these outcomes. Asian markets, such as Taiwan, South Korea, and China, historically exhibit higher retail investor participation compared to the institutional dominance seen in Western exchanges 28. This retail density fosters stronger momentum effects, sentiment-driven price volatility, and a higher reliance on technical indicators, which can inadvertently increase the efficacy of technical tools through mass behavioral coordination 28.
Predictive Power in Foreign Exchange and Digital Asset Markets
The extreme volatility and distinct 24/7 microstructure of foreign exchange (FX) and digital asset markets offer a robust testing environment for technical indicators. In these highly liquid arenas, empirical backtests provide deep insights into the limits and capabilities of mathematical retracement strategies.
Scalability in Statistical Arbitrage and Cryptocurrencies
Algorithmic testing of Fibonacci trading signals in the Binance USDS-M perpetual futures market revealed that the performance of Fibonacci-based strategies scales dynamically with the breadth of the asset universe being traded 15. Research conducted by Presto Labs assessed quantitative alphas specifically programmed to execute mean-reversion and momentum bets from the 61.8% retracement level 15.
The empirical results were striking. Single-asset strategies (e.g., executing the algorithm solely on the BTC/USDT pair) yielded poor risk-adjusted returns. A variable Gross Market Value (GMV) algorithm applied only to Bitcoin resulted in high volatility, significant drawdowns, and an annualized return of just 6.49%, translating to a near-zero Sharpe ratio of 0.04 15. Conversely, when the exact same Fibonacci algorithm was deployed across a broad universe of the top 50 most liquid cryptocurrency assets, the strategy achieved an annualized return of 77.83% and a robust Sharpe ratio of 3.2 15.
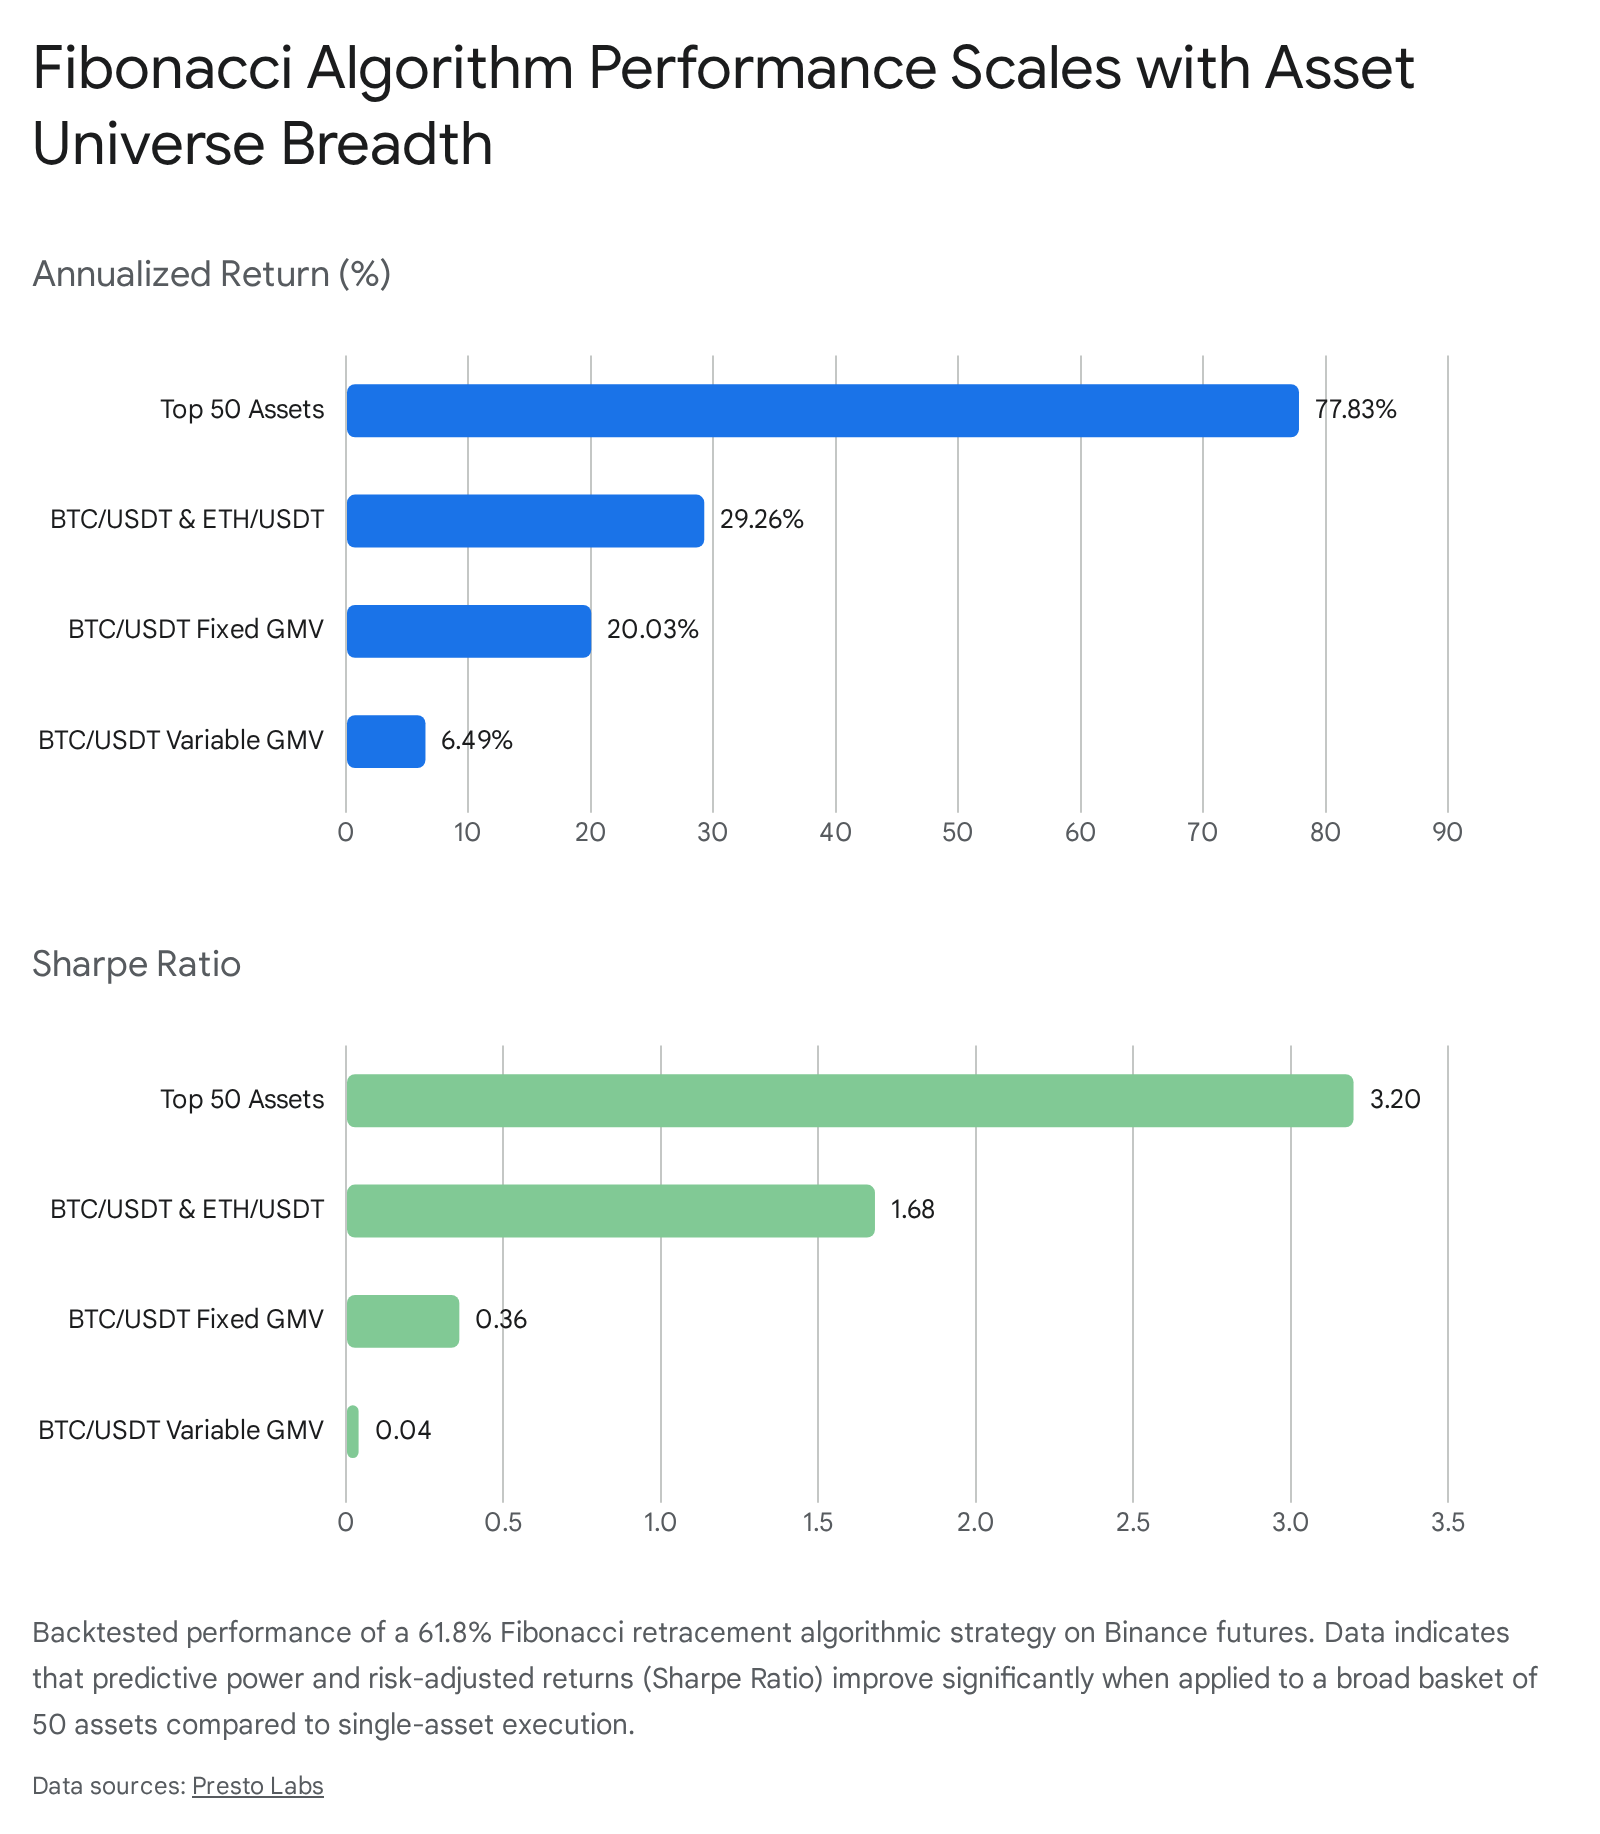
This divergence fundamentally redefines the utility of the indicator. It indicates that while Fibonacci levels struggle to forecast absolute returns on singular, highly volatile assets, they possess significant predictive power for statistical arbitrage and relative return forecasting when executed across broad, diversified portfolios 15.
Foreign Exchange and Optimal Holding Periods
In the FX market, vast liquidity and continuous trading facilitate deep analysis of technical rules. A comprehensive empirical investigation analyzing 497 distinct technical trading rules across 10 currencies over a 22-year period (2000 to 2022) found strong evidence of predictability, particularly in swing trading windows of one to seven days 89.
The study established that technical indicators maintain predictive power in both developed and emerging market currencies, though the specific efficacy varies. Oscillators tend to perform better in developed markets, while moving averages perform optimally in emerging markets 9. Crucially, the research highlighted the necessity of determining an "optimal holding period" after a signal is generated. Technical patterns, including deep retracements, do not trigger immediate reversals; rather, price movements align with the mathematical signal only after varying temporal lags, requiring practitioners to calibrate their holding durations based on the specific asset's historical volatility 89.
Methodological Challenges and Data-Snooping Bias
Any rigorous evaluation of technical trading rules must aggressively address and quantify the risk of data-snooping bias. Data snooping, or data mining, occurs when researchers retrospectively test thousands of parameter combinations on a single historical dataset until they inevitably discover a rule that yields profitable results purely by random chance 6910.
The Illusion of Retrospective Optimization
Historically, many positive academic findings regarding technical analysis were artifacts of uncorrected data-snooping. When researchers arbitrarily test various lengths of moving averages or multiple combinations of Fibonacci swing-high and swing-low anchors without pre-specifying their parameters, the mathematical likelihood of finding a seemingly profitable, yet completely spurious, pattern approaches certainty 911.
Because Fibonacci retracements lack inherently predefined structural rules for selecting which specific market highs and lows to use as measurement anchors, the tool is deeply susceptible to this bias 2012. Analysts can inadvertently manipulate the starting and ending coordinates to ensure the mathematical ratios perfectly align with historical price bounces, creating a compelling but false narrative of predictive power 234.
Advanced Statistical Correction Frameworks
To counteract this pervasive issue, modern econometricians employ advanced statistical frameworks, most notably White's Reality Check and the Stepwise Single-Period Approximation (SPA) tests 913. These sophisticated models evaluate the performance of an individual trading rule strictly in the context of the entire universe of tested rules, mathematically penalizing the final results to account for the sheer number of attempts made 13.
When these stringent tests are applied to broad datasets - such as a landmark study examining over 21,000 technical trading rules across 30 currencies over 40 years - the results shift dramatically 814. Adjusting for data-snooping bias and transaction costs frequently causes a sharp decline in the number of technical trading rules that maintain genuine, out-of-sample predictive power 89. While certain momentum and oscillator strategies survive these corrections, standalone Fibonacci retracement levels often fail to consistently outperform a buy-and-hold strategy once optimized parameters and trading frictions are fully accounted for 81538. This reinforces the academic consensus that Fibonacci levels, utilized in isolation without additional technical filtering, do not constitute a complete, statistically robust trading methodology.
Algorithmic Identification and Objective Evaluation
To definitively evaluate Fibonacci efficacy without human drawing bias, researchers have engineered automated algorithms capable of identifying retracements strictly through mathematical pattern recognition.
Performance Against Non-Fibonacci Price Zones
An algorithmic evaluation of equity markets published in Expert Systems with Applications (2022) utilized a computational framework to construct objective support and resistance zones around Fibonacci levels across the Dow Jones, NASDAQ, and DAX indices 12. By generating "Fibonacci zones" rather than rigid lines, the researchers sought to quantify how price interacts with the spatial area surrounding the theoretical ratio 12.
The study discovered a positive correlation between the width of the defined Fibonacci zone and the probability of identifying a price bounce 12. However, this finding alone did not validate the tool. When the performance of the Fibonacci zones was strictly benchmarked against randomly selected, non-Fibonacci horizontal zones, the predictive advantage was neutralized. The empirical results demonstrated that prices were equally likely to bounce on non-Fibonacci levels as they were on Fibonacci levels 12. The study ultimately concluded that a trading rule based solely on Fibonacci support and resistance zones failed to outperform a benchmark strategy based on randomized horizontal zones, suggesting the ratios do not inherently possess superior mathematical forecasting capabilities .
Conflicting Evidence: Statistically Significant Bounce Probabilities
Conversely, an econometric analysis titled "Can Returns Breed Like Rabbits? Econometric Tests for Fibonacci Retracements" directly challenged these null findings. Utilizing an expanded dataset and advanced harmonic regression models, the analysis demonstrated that specific core retracement levels exhibited statistically significant higher bounce probabilities compared to random price intervals 81216.
| Retracement Level | Bounce Probability | Standard Error | T-Statistic | Statistical Significance |
|---|---|---|---|---|
| 23.6% | 0.524 | 0.018 | 1.33 | 0.184 (Not Significant) |
| 38.2% | 0.547 | 0.019 | 2.47 | 0.013 (Significant at 5%) |
| 50.0% | 0.562 | 0.020 | 3.10 | 0.002 (Significant at 1%) |
| 61.8% (Golden Ratio) | 0.559 | 0.021 | 2.81 | 0.005 (Significant at 1%) |
| 78.6% | 0.531 | 0.019 | 1.63 | 0.103 (Not Significant) |
| Random Levels | 0.498 | 0.016 | - | Control Benchmark |
The data indicates that the 38.2%, 50.0%, and 61.8% retracement levels consistently demonstrate statistically significant higher bounce probabilities than random noise 8. These conflicting academic results highlight the profound complexity of the indicator. While the levels are not infallible deterministic laws, the specific ratios of 61.8% and 50.0% demonstrate enough statistical deviation from random control levels to warrant their categorization as structural market phenomena.
Psychological Frameworks and Behavioral Coordination
If Fibonacci ratios do not represent an intrinsic macroeconomic law of asset valuation, their observable statistical success in specific market regimes demands an alternative explanation. The fields of behavioral economics and market microstructure provide the necessary framework, suggesting that the efficacy of the tool is a byproduct of collective human psychology rather than mathematical destiny 2.
Fibonacci Levels as Schelling Focal Points
Game theory introduces the concept of a Schelling point (or focal point) - a solution that participants tend to choose by default in the absence of direct communication, simply because it appears natural, salient, or culturally relevant. In decentralized, global financial markets, where millions of participants operate independently, Fibonacci levels act as profound natural coordination mechanisms 2.
Because the 61.8% and 38.2% levels are universally recognized and embedded as default overlays in virtually every modern charting platform, a critical mass of market participants simultaneously observes the exact same potential reversal zones 2312. This "simultaneity of interpretive framing" concentrates trader attention and order flow 212. The 61.8% Golden Ratio, in particular, attracts the highest concentration of resting limit orders, functioning as a shared psychological language that synchronizes market expectations 2.
The Mechanics of the Self-Fulfilling Prophecy
This behavioral coordination physically manifests in the market's centralized limit order book, establishing a self-fulfilling prophecy. A Fibonacci retracement level acts as dynamic support not because of the underlying 13th-century sequence, but because thousands of retail traders and algorithmic bots actively place buy limit orders at that precise price coordinate 2317. Concurrently, traders who capitalized on the initial impulse wave frequently utilize these identical levels as targets for take-profit execution, while traders betting against the trend use them to anchor stop-loss orders 2216.
When the asset price drifts toward the 61.8% level, the massive, concentrated cluster of resting limit orders absorbs the prevailing selling pressure. The collective action of the market participants physically forces the price to pause or reverse, thereby validating the technical indicator and further reinforcing the participants' belief in its efficacy for subsequent trades 123. The predictive power of the tool is therefore a direct reflection of its own popularity; its operational validity is derived entirely from the aggregated behavioral biases - specifically anchoring, loss aversion, and herding - of the global trading public 2.
Institutional Algorithmic Order Flow and Liquidity Engineering
While retail traders utilize Fibonacci levels in an attempt to capture trend continuations, institutional participants managing substantial capital scale employ sophisticated algorithmic strategies to explicitly exploit this retail coordination. The severe divergence in how retail and institutional entities interact with Fibonacci retracements explains why shallow levels frequently fail and deep levels offer vastly superior risk-adjusted returns.
Algorithmic Exploitation of Retail Predictability
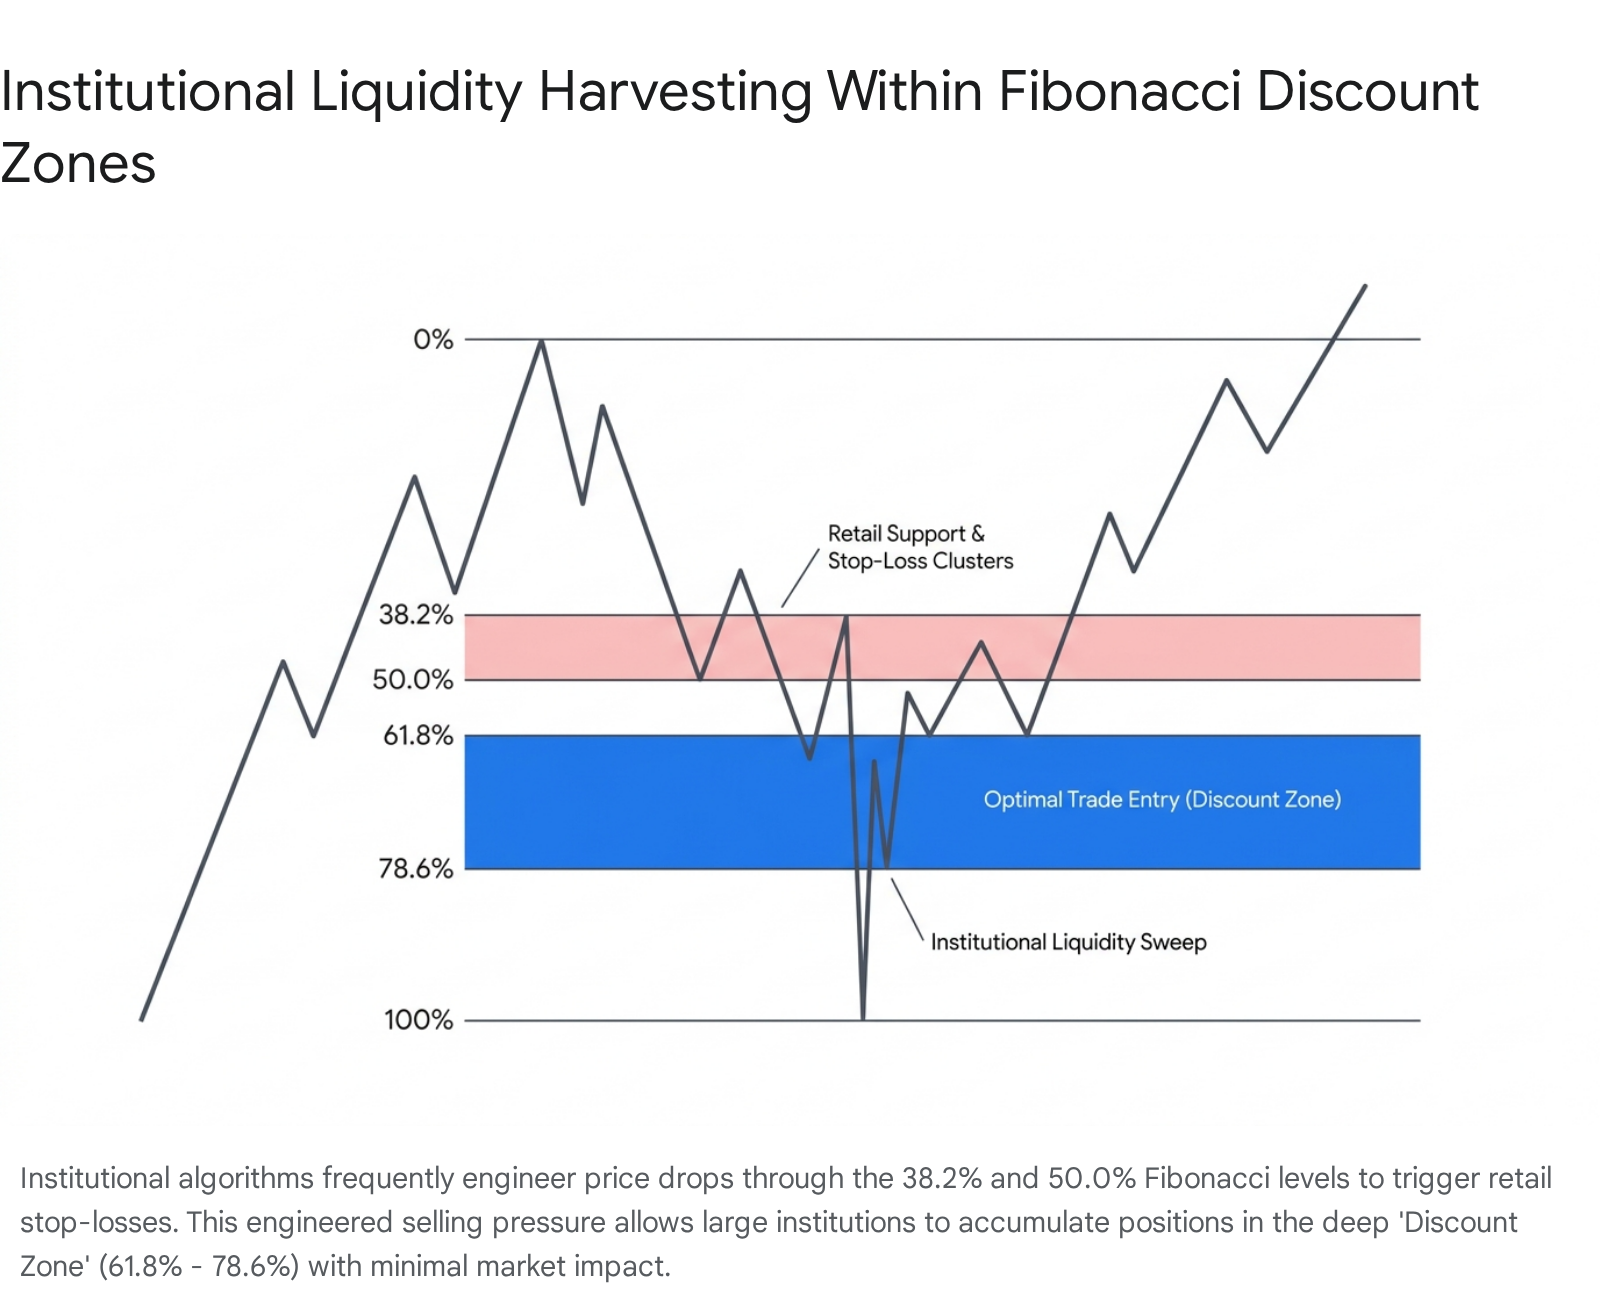
Institutional algorithms are fundamentally designed to secure massive liquidity. To fill multi-million dollar orders without causing adverse price slippage, institutions require an equivalent counterparty; to buy heavily, they must systematically induce retail traders to sell 104041. Retail trading curricula traditionally instruct participants to buy shallow retracements - specifically the 38.2% or 50.0% levels - during an established uptrend, placing their protective stop-loss orders marginally below these support lines 101117.
Institutional liquidity models precisely identify these clustered stop-loss orders as highly concentrated pools of "sell-side liquidity." High-frequency and algorithmic actors will deliberately engineer short-term downward price momentum to shatter the 38.2% and 50.0% support zones. This predatory action triggers a cascade of retail stop-losses, generating an artificial surge of selling pressure 9104117. The institutional algorithms immediately absorb this engineered selling pressure, executing their own massive buy orders at a deeply discounted price 101117.
Smart Money Concepts and the Optimal Trade Entry Zone
This structural exploitation of retail mechanics is formalized in advanced algorithmic trading frameworks, frequently referred to in modern market theory as Smart Money Concepts (SMC). Within these institutional models, shallow retracements are actively ignored as high-risk traps. Instead, sophisticated analysts and algorithms target the "Optimal Trade Entry" (OTE) zone, strictly defined as the spatial area situated between the 61.8% and 78.6% Fibonacci retracement levels 10114118.
This deep discount zone represents the mathematical sweet spot where the asset price has pulled back far enough to provide institutions with a highly favorable risk-to-reward ratio, yet not so far as to invalidate the structural integrity of the primary macroeconomic trend 1011. Furthermore, institutions anticipate that price action will frequently print rapid "wicks" or "liquidity sweeps" through the 78.6% level to hunt the final layer of retail stop-losses before reversing sharply 4117. Consequently, Fibonacci retracements are highly effective technical tools when interpreted not as rigid, impenetrable barriers, but as behavioral maps that highlight exactly where institutional capital is most likely to trap and harvest retail liquidity.
Synergistic Application and Technical Confluence
Given the extreme risks of data-snooping bias and the predatory nature of high-frequency institutional algorithms, relying on Fibonacci retracements as a standalone, isolated indicator is a mathematically fragile and empirically unproven approach 52019. Academic research and institutional practice consistently indicate that the tool's true efficacy emerges only through technical confluence - the intersection of multiple, highly independent analytical methods confirming the exact same price zone.
Integration with Market Structure and Candlestick Morphology
A Fibonacci retracement level holds exponentially more statistical weight when it aligns simultaneously with pre-existing structural market features, such as previous horizontal resistance turning into support, dense volume clusters, algorithmic fair value gaps (FVGs), or major psychological round numbers 5101720.
Furthermore, integrating Fibonacci coordinates with short-term price action, specifically Japanese candlestick reversal patterns, radically improves the predictive accuracy of the signal. A quantitative thesis testing the accuracy of historical candlestick patterns filtered by Fibonacci retracement lines demonstrated massive performance enhancements. When specific patterns formed exactly at a predefined Fibonacci coordinate, the probability of a successful trend reversal surged significantly above random distribution 45.
| Candlestick Reversal Pattern | Signal Accuracy at Fibonacci Level | Trade Direction |
|---|---|---|
| Bullish Engulfing | 90% | Long |
| White Marubozu | 78% | Long |
| Bearish Engulfing | 78% | Short |
| Doji in Uptrend | 71% | Short |
| Hammer | 70% | Long |
| Bearish Harami | 67% | Short |
| Bullish Harami | 59% | Long |
Note: Data representing the empirical accuracy of standard candlestick patterns when their formation strictly coincides with a major Fibonacci retracement zone. Patterns failing to align with the mathematical coordinates were excluded from the accuracy metric 45.
By utilizing Fibonacci retracements strictly as a spatial filter rather than an absolute trigger, algorithmic systems and discretionary traders can effectively discard low-probability candlestick signals that occur in "empty" chart space. They instead deploy capital only on high-probability signals localized in areas of heavy algorithmic and behavioral coordination 1945. This confluence model is further enhanced when integrated with momentum oscillators like the RSI or MACD to confirm exhaustion at the retracement level prior to entry 946.
Broader Portfolio Optimization and Asset Allocation
Beyond isolated technical charting and swing trading, Fibonacci ratios are increasingly applied to broader portfolio management and macroeconomic risk controls. Sophisticated trading systems utilize the 61.8% and 38.2% parameters not merely for entry coordinates, but for dynamic position sizing, partial profit-taking, and trailing stop-loss architectures 224647.
Furthermore, advanced macroeconomic studies have tested the Golden Ratio in long-term asset allocation. Empirical research found that a mathematically derived portfolio weighting utilizing the ratios - specifically deploying a 61.8% equity to 38.2% fixed-income split - offers marginal outperformance over traditional 60/40 strategies regarding risk-adjusted returns during specific periods of market stress, providing a mathematically elegant alternative for capital structure construction 8.
Conclusions on Fibonacci Retracement Validity
The assertion that Fibonacci retracement is nothing more than "market numerology" severely mischaracterizes the operational reality of modern, hyper-connected financial exchanges. While it is accurate that the mathematical sequence developed by a 13th-century mathematician exerts no invisible, fundamental macroeconomic pull on corporate valuations or sovereign currency rates, dismissing the tool entirely ignores the deep structural mechanics of market behavior and liquidity provision.
Fibonacci retracements are undeniably supported by empirical evidence, provided the definition of "evidence" is rooted in behavioral economics, focal point theory, and liquidity dynamics, rather than classical fundamental asset pricing. The ratios function as a highly efficient, self-fulfilling coordinate system. They highlight profound Schelling focal points where millions of retail participants cluster their buy, sell, and stop-loss orders, thereby creating the massive, dense liquidity pools that institutional algorithmic models are actively programmed to harvest.
When utilized in strict isolation, the predictive power of a Fibonacci level is statistically weak, highly vulnerable to market noise, and deeply susceptible to data-snooping biases. However, when integrated into a comprehensive, rule-based system of confluence - aligning with volume profiles, historical market structure, institutional order flow logic, and explicit price action confirmations - Fibonacci retracement serves as a highly robust mathematical framework for measuring optimal trade entry zones and navigating the extreme psychological fluctuations of global financial markets.