How to Choose Stocks for Swing Trading
To choose the best stocks for swing trading, investors must filter for high liquidity (at least 500,000 to 1 million shares traded daily) to ensure rapid entry and exit without excessive slippage. They should target healthy volatility, utilizing metrics like the Average True Range (ATR) to ensure the stock moves sufficiently to generate short-term profits, while strictly avoiding the erratic, unpredictable price action of low-float penny stocks. Ultimately, balancing these three pillars - liquidity, volatility, and float - allows traders to execute technical strategies effectively while managing downside risk.
The modern financial markets offer a vast spectrum of investment horizons, tailored to varying degrees of risk tolerance, capital availability, and psychological endurance. On one extreme lies the frenetic environment of day trading, where positions are opened and closed within minutes or hours, demanding relentless attention to the ticker tape and an ironclad ability to manage intraday emotional swings 1. On the opposite end sits retirement investing, a passive "buy and hold" methodology designed to weather decades of macroeconomic cycles without the need for daily intervention.
Swing trading occupies the strategic, highly practical middle ground between these two extremes. By holding positions for a few days to several weeks, swing traders aim to capture intermediate price trends, relying heavily on technical analysis and market momentum rather than long-term fundamental valuation 23. It is a methodology tailored for those who seek active market participation and the potential for compounded short-term gains, but without the minute-by-minute anxiety of day trading.
However, the success of a swing trade relies less on predicting the future and more on robust asset selection. Choosing the wrong stock - one that is too stagnant to generate a return, too erratic to manage risk, or too illiquid to exit gracefully - can turn a well-planned trade into a costly capital trap. This comprehensive report deconstructs the science of selecting stocks for swing trading, focusing on the critical triad of liquidity, volatility, and float.
The Core Pillars of Asset Selection: Liquidity, Volatility, and Float
Before an investor applies a single technical indicator, analyzes a moving average, or plots a trendline, they must ensure a stock possesses the structural integrity to be traded safely. In the equities market, this structural integrity is defined by three interrelated concepts: liquidity, float, and volatility.
Liquidity: The Honda vs. The Rare Antique
Liquidity refers to how easily an asset can be bought or sold in the open market without causing a significant shift in its price 45. To understand the practical implications of liquidity, consider the difference between selling a popular, gently used Honda Civic and selling a rare, 17th-century antique grandfather clock.
If an individual lists a well-maintained Honda Civic at a fair market price, they will likely find a buyer within hours. The market for reliable commuter cars is vast, active, and highly standardized. Buyers and sellers agree on a tight range of acceptable prices. This is a highly liquid market. Conversely, listing the antique clock requires finding a highly specific buyer - perhaps an eccentric collector or a specialized museum. Weeks, months, or even years may pass without a single offer. If the seller requires cash immediately, they will be forced to drastically slash the price to entice a buyer, taking a massive loss on the asset's theoretical value. The antique clock represents an illiquid market.
In the stock market, liquidity functions identically 3. Highly liquid stocks, such as mega-cap technology firms listed on the Nasdaq or the New York Stock Exchange (NYSE), have tens of millions of shares exchanging hands daily. A trader can enter and exit positions instantly at the exact quoted price. Illiquid stocks, however, lack eager buyers and sellers. Executing a large trade in an illiquid stock will directly influence the order book, forcing the trader to pay a premium to buy the shares or accept a steep discount to sell them - a phenomenon universally known as "slippage" 78. For swing traders, who rely on precise entry and exit points to maintain strict risk-reward ratios, high liquidity is non-negotiable.
Float: The Concert Ticket Dilemma
A company's "float" refers to the specific number of outstanding shares that are actually available for public trading, explicitly excluding closely held shares owned by corporate insiders, founders, employees, or early venture capital investors 9.
To visualize the mechanics of float, imagine a major stadium concert. The stadium may have a total theoretical capacity of 50,000 seats (representing total "shares outstanding"). However, if 45,000 of those seats are permanently reserved for VIPs, corporate sponsors, and the band's family members, only 5,000 tickets are actually available for purchase by the general public. These 5,000 active tickets represent the "float."
If a sudden surge of popularity hits the band - akin to a positive earnings report or a viral news catalyst - thousands of fans will scramble for those 5,000 public tickets. Because the available supply is artificially constrained, the price of the tickets will skyrocket exponentially on the resale market as buyers outbid each other. Conversely, if negative news breaks about the band, those ticket holders will panic-sell, and because there are so few natural buyers, the price will crash just as violently.
In the stock market, low-float stocks are incredibly susceptible to these exact supply-and-demand shocks 10. A minor press release or a sudden surge in retail attention can cause a low-float stock to gap up or down by double-digit percentages in a matter of minutes 11. While this explosive movement might appeal to intraday momentum traders seeking extreme action, it introduces unpredictable, asymmetric risk that is highly dangerous for swing traders who hold positions overnight when they cannot actively manage the trade 1.
Volatility: The Engine of Profit
If liquidity ensures a trader can efficiently enter the vehicle, and float determines how bumpy the underlying road will be, volatility is the engine that actually moves the car forward. Volatility measures the rate, frequency, and magnitude of price changes over a given period 3.
A stock that never moves provides no opportunity for capital appreciation. Swing traders rely on "healthy volatility" - predictable, measurable oscillations within established upward or downward trends 5. The goal is to identify equities that routinely swing between technical levels of support (where buyers historically step in) and resistance (where sellers historically take profits), providing clearly defined entry triggers and exit targets 4.
FAQ: Why is the bid-ask spread so important?
The bid-ask spread represents the fundamental, often overlooked transaction cost of entering and exiting the financial markets. The "bid" is the highest price a prospective buyer is currently willing to pay for a stock, while the "ask" (or offer) is the lowest price a prospective seller is willing to accept 145.
When an investor places a standard "market order" to buy a stock immediately, they are forced to execute at the ask price. If they immediately panic and sell that exact same stock a second later using a market order, they will receive the bid price 14. The difference between the two prices - the spread - is instantly lost capital. This gap serves as the financial compensation and profit margin for market makers, the institutional intermediaries who take on the inventory risk to facilitate smooth, continuous trading 16.
The Hidden Tax on Returns in the Zero-Commission Era
In the modern era of retail brokerages like Schwab and Fidelity offering zero-commission trading, many novice investors mistakenly believe that trading is entirely free 17. This is a dangerous misconception. While explicit commissions have vanished, the bid-ask spread remains a relentless, hidden tax on performance.
The impact of the spread should never be viewed merely in absolute dollar terms; it must always be calculated as a percentage of the stock's price to understand its true drag on a portfolio 176. The formula is straightforward:
$$\text{Spread Percentage} = \left( \frac{\text{Ask Price} - \text{Bid Price}}{\text{Ask Price}} \right) \times 100$$
As liquidity drops, market makers intentionally widen the spread to compensate themselves for the heightened risk of holding illiquid, hard-to-sell assets 17. This dynamic creates a mathematical trap for beginners who dabble in cheap, thinly traded securities.
How Bid-Ask Spreads Eat Into Trading Profits
| Stock Category | Example Ticker | Bid Price | Ask Price | Spread ($) | Spread (%) | Required Gain Just to Break Even |
|---|---|---|---|---|---|---|
| Mega-Cap Tech | AAPL | $\$213.45$ | $\$213.47$ | $\$0.02$ | 0.009% | 0.009% |
| Large-Cap Tech | MSFT | $\$441.80$ | $\$441.85$ | $\$0.05$ | 0.011% | 0.011% |
| Small-Cap Growth | (Generic) | $\$18.40$ | $\$18.65$ | $\$0.25$ | 1.36% | 1.36% |
| Micro-Cap | (Generic) | $\$3.10$ | $\$3.35$ | $\$0.25$ | 7.46% | 7.46% |
| Penny Stock | (Generic) | $\$0.28$ | $\$0.35$ | $\$0.07$ | 20.0% | 20.0% |
Data representation sourced from standard market maker spread analysis across varying capitalization tiers 177.
As the table clearly illustrates, trading a highly liquid mega-cap stock incurs a mathematically negligible transaction cost. However, a novice trading a penny stock with a 20% spread is at an immediate, catastrophic disadvantage 17.
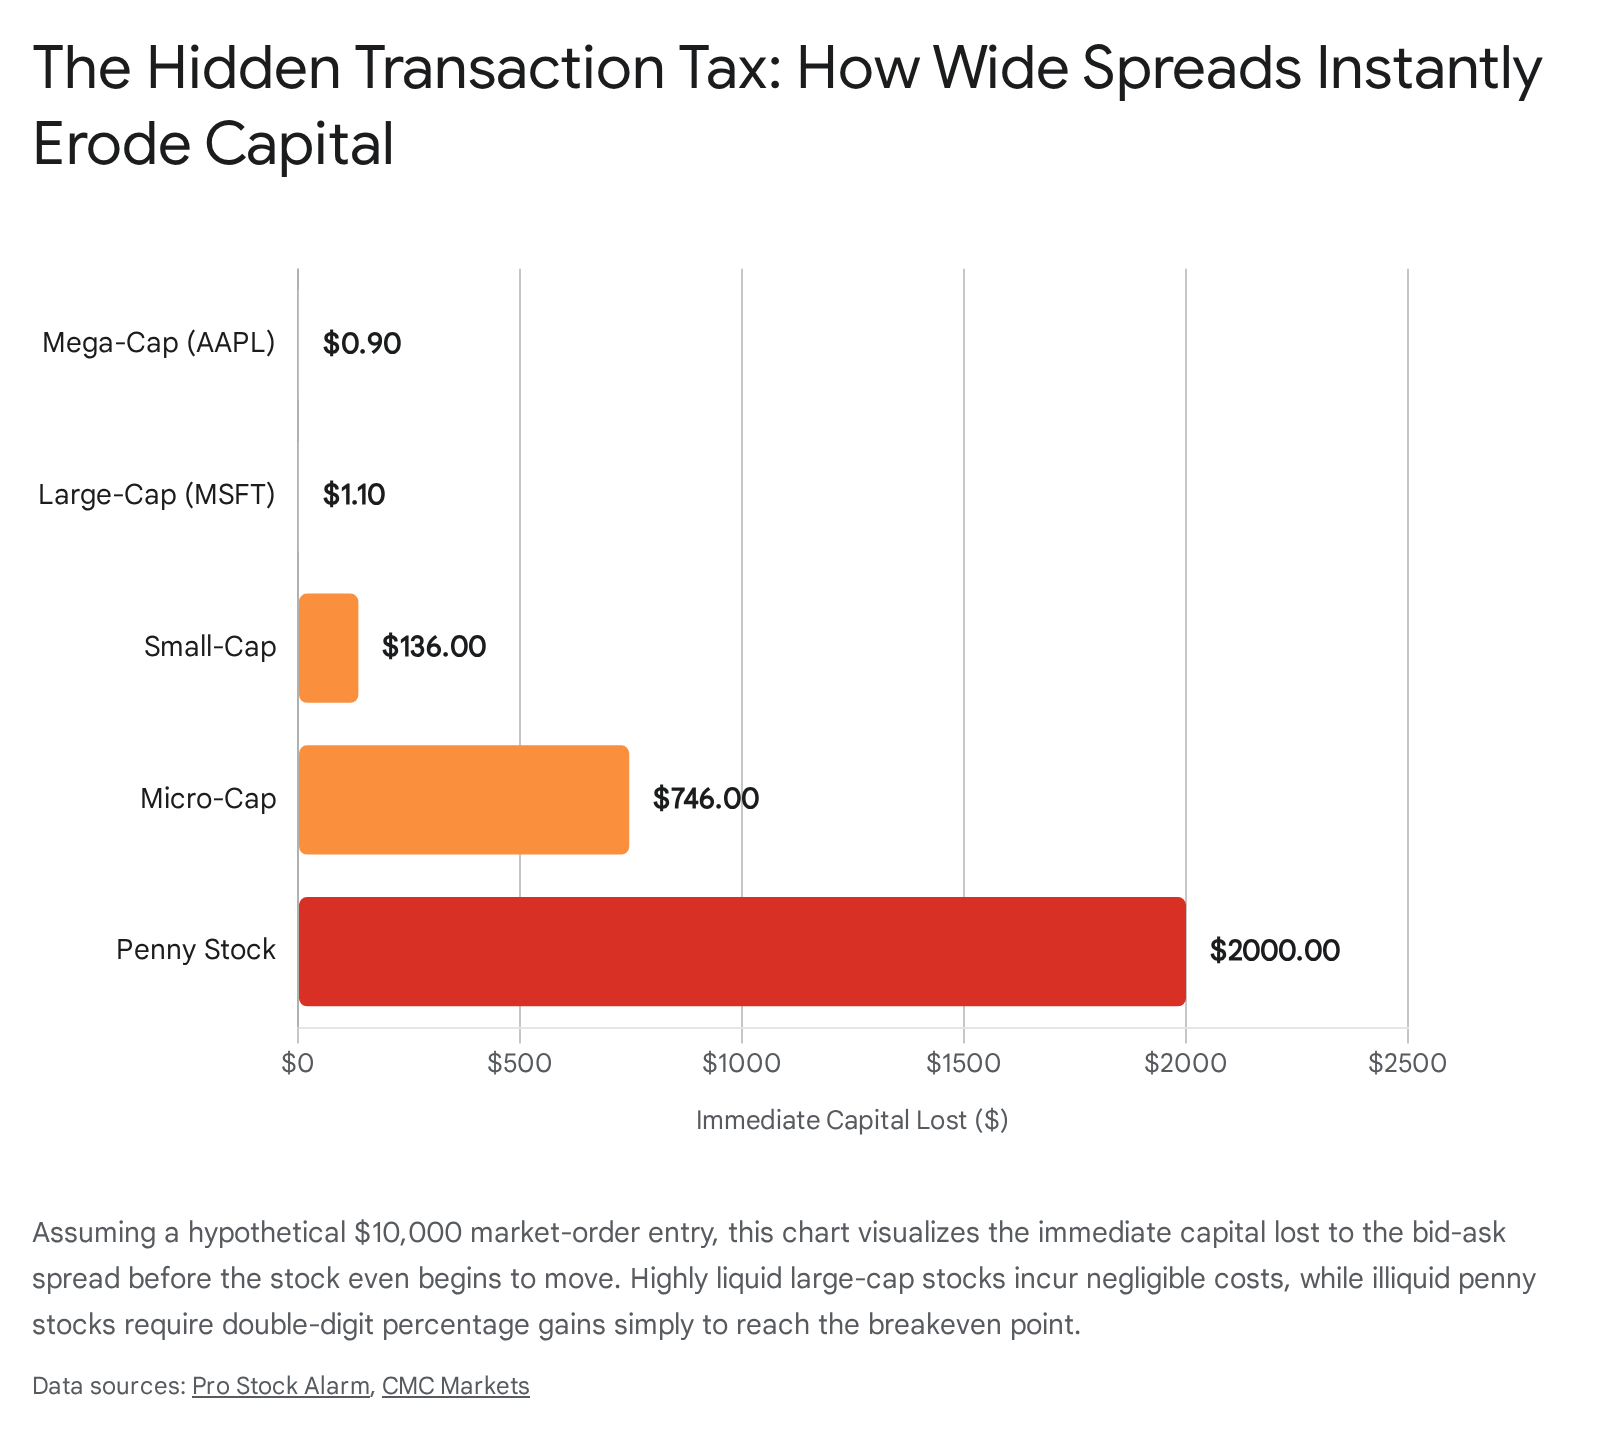
Before the underlying business has even begun to trend in the desired direction, the trader's position is already down 20%. The stock must rally 20% simply to break even on the round-trip transaction.
This mathematical reality is precisely why professional swing traders universally avoid illiquid assets. Furthermore, it highlights the critical importance of using limit orders rather than market orders. A limit order dictates the exact maximum price a trader is willing to pay, ensuring they never cross the spread inadvertently and overpay due to sudden, algorithmic shifts in the order book 146.
Decoding Volume Thresholds for Swing Trading
The primary metric for measuring liquidity is Average Daily Volume (ADV). ADV represents the total number of shares traded per day, mathematically averaged over a specific historical period - typically 50 or 90 trading days 4.
For retail swing traders, the established consensus baseline is to filter exclusively for stocks with an ADV of at least 500,000 to 1,000,000 shares 5711. This robust threshold ensures that the stock experiences consistent, reliable trading interest from both retail and institutional participants. This depth of interest minimizes slippage and guarantees that a trader can execute their protective stop-loss orders precisely when needed.
Average Dollar Volume: The Institutional Metric
While ADV is highly useful, it can sometimes present a misleading picture of liquidity if not contextualized by the stock's actual share price. For example, a micro-cap stock trading at $\$1$ with an ADV of 1,000,000 shares is only processing $\$1,000,000$ in daily capital turnover. Conversely, a large-cap stock trading at $\$200$ with an ADV of 500,000 shares is processing $\$100,000,000$ in daily capital turnover.
To account for this discrepancy, institutional traders and sophisticated retail swing traders often prioritize Average Dollar Volume, which is calculated by multiplying the current share price by the ADV 4. A standard institutional rule of thumb is to seek an Average Dollar Volume of at least $\$20$ million 3. This advanced metric ensures that the market depth is genuinely sufficient to absorb sizable orders without jarring the prevailing price structure 4.
International Volume Discrepancies and Market Mechanics
It is crucial for global investors to note that baseline volume thresholds vary significantly across international exchanges. A high-volume stock on the New York Stock Exchange (NYSE) will display drastically different nominal metrics than a highly liquid stock on the London Stock Exchange (LSE) or the Australian Securities Exchange (ASX).
- United States (NYSE & Nasdaq): The US stock market represents the most liquid financial ecosystem in the world, benefiting from massive institutional and retail participation 821. The 500,000 to 1,000,000 ADV threshold is easily met by thousands of mid- and large-cap equities. Furthermore, the NYSE actively utilizes Designated Market Makers (DMMs) who have a regulatory obligation to maintain liquidity and tighten spreads, particularly during the highly volatile open and closing auction periods 9.
- United Kingdom (LSE): The LSE is a dominant European hub, but its absolute trading volumes are lower than those of the US 2110. However, liquidity on the LSE is often measured more accurately by the average daily free-float adjusted turnover ratio - the percentage of available shares actually traded daily. This ratio for the FTSE 100 is roughly 0.96%, which is highly comparable to the 0.76% of the S&P 500. This indicates that while the absolute share volume is lower, the relative liquidity and ease of trading remain exceptionally healthy 11. When screening LSE stocks, traders may safely lower the nominal ADV threshold to 250,000 shares, provided the underlying market capitalization remains robust.
- Australia (ASX): The ASX is heavily weighted toward resource, mining, and financial sectors, offering different thematic exposures than the tech-heavy Nasdaq 821. Daily volatility is generally lower on the ASX. Notably, the ASX does not utilize traditional market-wide circuit breakers. Instead, it relies on sophisticated Anomalous Order Thresholds (AOT) and Extreme Trade Range (ETR) mechanisms to automatically pause trading in individual stocks for two minutes if they experience violent, unnatural swings 12. Due to its smaller overall market capitalization, an ADV of 100,000 to 300,000 shares may be considered highly liquid for an ASX mid-cap stock.
- Hong Kong (HKEX): The HKEX boasts massive institutional volume but possesses a unique structural environment. Over 34% of the Hong Kong market consists of equities priced at or below HK$\$0.50$, which generally suffer from minimal ADV and remarkably thin order books 13. Swing traders operating on the HKEX should strictly restrict their screens to equities priced well above HK$\$0.50$ to ensure proper liquidity dynamics. Furthermore, the HKEX employs a Volatility Control Mechanism (VCM) that confines a stock's trading to a 10% price band for a five-minute "cooling period" if it deviates too rapidly from its five-minute reference price, preserving market order during sudden macroeconomic shocks 1415.
Float vs. Average Daily Volume: Clearing Up Beginner Misconceptions
One of the most persistent and destructive traps for retail investors is conflating low nominal share prices with fundamental "value," leading to a fatal attraction to penny stocks. Penny stocks are typically defined as shares trading below $\$5$, often belonging to micro-cap or nano-cap companies listed on Over-The-Counter (OTC) bulletin boards rather than major, highly regulated exchanges like the NYSE or Nasdaq 2930.
The Danger of Penny Stocks and the Illusion of Leverage
Beginners are frequently lured into penny stocks by the psychological illusion of leverage and scale. An investor with a modest account of $\$1,000$ can purchase 10,000 shares of a $\$0.10$ stock. The underlying assumption is that if the stock simply moves up by a dime to $\$0.20$, they have doubled their capital 31.
However, major financial journalism outlets and institutional hedge fund managers consistently warn that retail penny stock trading is less akin to investing and more akin to asymmetric gambling 3233. Penny stocks suffer from chronic, severe illiquidity and massive bid-ask spreads, as outlined earlier.
Furthermore, because these companies are extremely small, their float is often easily manipulated by coordinated online groups or unscrupulous stock promoters - a nefarious practice known as the "pump and dump" 734. These companies frequently lack viable commercial products and survive solely by issuing new shares, consistently diluting existing shareholders to zero 3334. The belief that one can consistently apply sophisticated technical analysis to penny stocks is a fundamental fallacy. Technical analysis works reliably on large-cap stocks because their prices reflect the aggregate psychology of millions of institutional and retail participants. The price action of an OTC penny stock merely reflects the whims of a few isolated actors manipulating a dangerously thin order book 3536.
Confusing ADV with Float: The Turnover Trap
Another critical error made by novice swing traders is confusing Average Daily Volume (ADV) with the actual structural Float of the company. A stock may present an ADV of 10 million shares on a screener, leading a beginner to confidently believe it is highly liquid and structurally safe.
However, if the stock's total available float is only 2 million shares, that means the entire tradable supply of the company is turning over five times in a single trading session. This extreme "turnover rate" is a massive red flag. It indicates frenzied, speculative retail day trading rather than organic, sustained institutional investment 437.
A swing trader stepping into a high-turnover, low-float stock is effectively walking into a casino where the price could gap down 40% overnight as the speculative fervor evaporates. For stability and reliable technical setups, swing traders should target mid-to-large cap stocks where the ADV represents only a small, healthy fraction of the total float, ensuring that the price action is driven by sustained institutional accumulation rather than transient retail mania 437.
FAQ: What makes a stock too volatile to swing?
While volatility is the necessary fuel required to generate a profit, "erratic volatility" is the nemesis of the disciplined swing trader. When a stock's price movements are driven by random noise, sudden social media manipulation, or a total lack of institutional sponsorship, it becomes mathematically impossible to manage risk.
A stock becomes objectively too volatile to swing trade when its intraday price swings routinely bypass technical support and resistance levels without warning, rendering protective stop-loss orders entirely ineffective.
Mastering the Average True Range (ATR)
To quantify and filter for healthy volatility, professional swing traders rely heavily on a technical indicator known as the Average True Range (ATR). Developed by renowned technical analyst J. Welles Wilder Jr., the ATR measures a stock's historical volatility by calculating the average range between the daily high and low over a specific lookback period - usually 14 days - importantly accounting for any overnight price gaps that occur between trading sessions 3.
If a large-cap stock priced at $\$100$ has a 14-day ATR of $\$2.50$, it indicates the stock moves an average of $\$2.50$ (or 2.5%) per day. This represents healthy, tradable volatility.
The ATR is vital for two distinct operational reasons: 1. Setting Realistic Profit Expectations: If a trader's specific strategy requires a stock to move $\$5$ to hit a profit target within a three-day holding period, but the stock's ATR is only $\$0.50$, the trade setup is mathematically improbable. The stock simply lacks the historical energy to reach the target in the required timeframe. 2. Dynamic Risk Management and Stop-Loss Placement: Professional swing traders do not use arbitrary percentage losses (e.g., "I will sell if I lose 5%"). Instead, they use the ATR to place intelligent, mathematically grounded stop-loss orders. Traders typically place their stops at a multiple of the ATR - such as 1.5x or 2.0x the ATR below their entry price 3839. This dynamic spacing allows the stock enough "breathing room" to experience normal daily market noise without prematurely stopping the trader out of a structurally sound winning position.
If a stock's ATR is excessively high relative to its price (e.g., a high-beta tech stock swinging 15% daily), the required 2x ATR stop-loss becomes so wide that the fundamental risk-to-reward ratio breaks down. In these scenarios, the stock is mathematically untradable for sensible risk management, and the disciplined trader will move on to the next candidate 39.
Practical Screener Setups for Swing Traders
To eliminate the noise of 15,000 publicly traded equities and identify high-probability technical setups, swing traders utilize automated stock screeners. Accessible, industry-standard platforms like Yahoo Finance or Finviz provide powerful tools to filter the market down to a highly manageable daily watchlist 94041.
Rather than chasing social media trends or financial news headlines - which often highlight catalysts too late for a swing trader to capitalize on - traders must employ disciplined, objective screening criteria 42.
A Baseline Yahoo Finance & Finviz Screener Setup
Whether utilizing the robust visual interface of Finviz or the comprehensive data filters of Yahoo Finance's 'Equity Screener', the methodology remains consistent 94041. A professional swing trading screen is constructed in three distinct layers.
Step 1: Descriptive Filters (Ensuring Safety and Liquidity)
* Region: United States (or the specific local market the trader is operating within) 9.
* Market Capitalization: > $1 Billion (Mid-Cap, Large-Cap, and Mega-Cap). This critical filter ensures the company is an established corporate entity heavily scrutinized by institutional investors and analysts, insulating it from OTC pump-and-dump schemes 79.
* Price: > $5 or > $10. This eliminates penny stocks and high-risk micro-caps, ensuring the trader is dealing with standardized equity spreads and mature corporate governance 31.
* Average Volume (ADV): > 500,000 or > 1,000,000 shares. As discussed, this guarantees a liquid market, minimizing slippage, ensuring tight bid-ask spreads, and guaranteeing execution of stop-loss orders 7911.
Step 2: Technical Filters (Isolating Volatility and Trend)
* Beta: > 1.0 and < 2.0. Beta measures a stock's historical volatility relative to the broader market index (usually the S&P 500). A Beta of 1.0 means it moves in lockstep with the market. A Beta of 1.5 means it is historically 50% more volatile. Selecting a Beta above 1.0 ensures the stock has the inherent kinetic energy to generate swing profits, while strictly capping it at 2.0 filters out chaotic, unmanageable outliers 3.
* Average Directional Index (ADX): > 25 (if available on the chosen screener platform). The ADX is a non-directional indicator that measures the absolute strength of a trend. An ADX reading above 25 confirms that the stock is currently exhibiting a firm, powerful directional trend (either up or down), rather than chopping aimlessly sideways in a stagnant range 7.
Step 3: Fundamental Filters (Optional Institutional Confirmation)
While swing trading is primarily a technical discipline driven by price action, incorporating light fundamental screens ensures the trader is riding alongside the massive currents of institutional capital 10.
* Unlevered Free Cash Flow: > 0. This simple but highly effective metric ensures the underlying company is not actively burning cash. Cash-burning companies are highly likely to announce sudden secondary stock offerings to raise capital, an event that instantly dilutes shareholders and crashes the share price overnight 40.
* Institutional Ownership: > 30%. Stocks backed heavily by mutual funds, pension funds, and hedge funds tend to respect technical support and resistance levels far more reliably than volatile, retail-dominated stocks 4.
Comparing Trading Styles: A Structural View
To fully contextualize swing trading, it is necessary to contrast it directly with adjacent investment philosophies. The following table highlights how different market participants approach the critical variables of volume, volatility, and float to achieve their specific operational goals.
Comparing Market Approaches: Day Trading vs. Swing Trading vs. Long-Term Investing
| Metric | Day Trading | Swing Trading | Long-Term Investing |
|---|---|---|---|
| Time Horizon | Minutes to Hours. Actively avoids overnight exposure risk 1. | Days to Weeks. Accepts overnight risk to capture multi-day trends 12. | Years to Decades. Ignores short-term fluctuations entirely 1. |
| Volume Requirements | Extreme. Requires millions of shares per minute to scalp tiny intraday spreads 3. | High. Requires >500k ADV to ensure easy entry/exit over several days 57. | Low to Moderate. Rapid execution speed is largely irrelevant for a 10-year holding period. |
| Volatility Preference | Extremely High. Feeds exclusively on massive intraday swings and breaking news catalysts. | Moderate & Predictable. Seeks measurable ATR within established technical trends 39. | Low. Prefers steady, slow compounding capital growth and reliable dividend yields. |
| Float Preference | Frequently targets Low-Float stocks for explosive, multi-bagger intraday momentum 10. | High-Float / Mid-to-Large Cap. Requires structural stability to avoid overnight gap risks 7. | Very High-Float. Mega-cap blue-chip equities that dominate global indices. |
| Analytical Focus | Order flow dynamics, Level 2 data, and 1-to-5-minute technical charts 43. | Daily and Weekly technical charts, moving averages, relative strength, and ATR 5. | Deep fundamental analysis, P/E ratios, macroeconomic cycles, and balance sheets 44. |
Bottom Line
Swing trading offers a highly pragmatic, deeply analytical middle ground for individuals who desire to actively generate returns from market momentum without subjecting themselves to the all-consuming, minute-by-minute stress of day trading. However, success in this arena relies heavily on rigorous risk management and disciplined, emotionless asset selection. By utilizing robust screeners to filter for high liquidity (ensuring minimal slippage), avoiding the mathematically punishing bid-ask spreads of low-float penny stocks, and demanding healthy, measurable volatility through metrics like the Average True Range, a trader establishes a permanent structural edge. Trading is ultimately about managing probabilities, and respecting the hard constraints of liquidity, volatility, and float is the surest way to keep those probabilities consistently aligned in your favor.