How to Build a Balanced College List
A balanced college list strategically distributes a student's applications across a carefully selected mix of highly likely, moderately competitive, and aspirational institutions. By anchoring expectations in hard data - specifically the middle 50% of admitted academic profiles and recent acceptance rates - applicants can navigate unprecedented application inflation and secure admission to institutions that fit their academic, social, and financial needs. In today's volatile admissions climate, correctly categorizing these choices prevents the devastating scenario of arriving at the end of the admissions cycle with zero affordable acceptances.
The New Reality of College Admissions
Building a college list is no longer a simple exercise in matching a high school Grade Point Average (GPA) to a university's historical reputation. The higher education landscape has undergone tectonic shifts over the past few years. Driven by digital application platforms, changes to standardized testing requirements, and historic legal rulings, the fundamental predictability of college admissions has vanished. Schools that were once considered comfortable target institutions for high-achieving students are now operating as highly selective reach schools 1.
According to recent data from the Common Application, the number of applications submitted to the most selective schools - defined as those with acceptance rates below 25% - rose by nearly 131% over a five-year period 1. In the 2025 - 2026 admissions cycle alone, 1.43 million students applied to these highly selective institutions 1. This phenomenon, widely known as application inflation, means more individual students are applying to a greater number of colleges, which artificially depresses acceptance rates across the entire higher education sector. Villanova University illustrates this broader trend perfectly: its acceptance rate dropped from a relatively accessible 48% for the Class of 2019 to a highly competitive 27.53% for the Class of 2029 1. A serious, well-researched tier of likely and target schools is no longer an optional buffer; it is the most critical component of a modern college strategy 23.
The Post-SFFA Landscape and the "Cascade Effect"
In June 2023, the U.S. Supreme Court delivered a landmark ruling in Students for Fair Admissions, Inc. v. President and Fellows of Harvard College (SFFA), effectively banning the explicit use of race as a categorical factor in college admissions 245. The transition to race-neutral admissions processes has made outcomes at the most selective private universities exceedingly difficult to predict, fundamentally altering how students must build their college lists 2.
Data from the high school classes of 2024 and 2025 reveal significant demographic shifts at highly selective institutions that historically relied on race-conscious holistic review. At Johns Hopkins University, for instance, Asian American enrollment in the Class of 2029 jumped from roughly 25.6% to 45.1%, while Black/African American enrollment fell from 9.8% to about 4%, and Hispanic enrollment dropped from 20.8% to 10.1% 2. Harvard University experienced similar shifts, with its Class of 2029 reporting an Asian American demographic of 41% (up from 29% pre-SFFA) and a Black/African American demographic of 11.5% (down from 14%) 5. Drops in Black enrollment were also precipitous at Princeton University (9% down to 5%) and Amherst College (11% down to 6%) 5.
Because highly selective universities can no longer engineer their incoming classes using the exact holistic frameworks of the past, rejected applicants from top-tier schools are experiencing what researchers term the "cascade effect" 5. These highly qualified students, turned away from Ivy League and elite private institutions, cascade down to the next level of selectivity. This influx heavily impacts state flagship universities and "public Ivies" such as the University of North Carolina at Chapel Hill, turning them into highly competitive arenas 5. Consequently, predicting admission at a target school requires a much more conservative and data-driven approach today than it did a decade ago. The story of the SFFA ruling is largely a story about the top of the admissions market, but its ripple effects are reshaping the entire college list-building process 25.
The Standardized Testing Pendulum
The COVID-19 pandemic triggered a massive wave of test-optional policies, initially implemented out of necessity when testing centers closed. In 2019, 76% of applicants submitted test scores via the Common App, but by 2023, that number had plummeted to just 45% 7. For a brief period, the absence of standardized testing seemed to herald a new era of equity-focused admissions. However, the pendulum is currently swinging back with considerable force.
In the 2025 - 2026 admissions cycle, 52% of applicants reported test scores, marking the first time since the pandemic that the percentage of students submitting scores was higher than those opting out 1. This shift is a direct result of many selective institutions returning to required testing policies. Research studies, including those cited by institutions like Dartmouth College, have demonstrated that standardized test scores remain incredibly strong predictors of early college performance 67. In fact, research indicates that non-score inputs, such as guidance counselor letters of recommendation, do not predict college performance as reliably and often advantage more affluent applicants at elite institutions 67.
Standardized tests have been found to be particularly valuable in identifying academically prepared students from socioeconomically disadvantaged backgrounds whose readiness might otherwise go undetected because their high schools lack advanced coursework or grade inflation 8. Even at institutions that remain test-optional, submitting a strong standardized test score typically provides a distinct advantage in the applicant pool. For instance, while only about half of the applicants to Tufts University's Class of 2030 submitted test scores, a staggering 75% of the students who were ultimately admitted had submitted them 1. Navigating a balanced list today requires an honest assessment of whether a student's test scores enhance their profile or whether a strategic, targeted test-optional approach is truly warranted.
Redefining Reach, Target, and Safety Schools
To navigate this highly volatile environment, applicants must strictly categorize their prospective colleges based on hard institutional data rather than historical reputation, anecdotal evidence, or emotional attachment. The primary metrics used to categorize a school are the institution's overall acceptance rate and where the student's academic profile - specifically GPA, course rigor, and standardized test scores - falls relative to the "middle 50%" of the previously admitted freshman class 91011.
This critical data is published annually by universities in a standardized document known as the Common Data Set (CDS). Families and counselors rely heavily on Section C (First-Time, First-Year Admission) of the CDS to determine the true statistical profile of admitted students, which strips away marketing rhetoric and reveals the academic reality of the institution 1213.
Safety Schools (Likely)
A safety school - increasingly referred to by modern admissions professionals as a "likely" school to reduce the stigma associated with the term "safety" - is an institution where a student has a near-certain probability of admission, typically quantified as a greater than 70% or 75% chance 91417.
For a school to truly function as a safety on a balanced list, the institution's overall acceptance rate should be comfortably above 50% to 70%, and the student's academic profile must place them well above the average admitted student 1015. Specifically, the student's unweighted GPA and standardized test scores should fall at or above the 75th percentile of the most recently admitted class 1011.
A critical error many families make is assuming a school is a safety simply because the student "should" get in based on decent grades 14. A true safety must be a mathematical near-certainty 14. Furthermore, safety schools must pass a rigorous "fit" test. They should offer the student's desired academic programs, possess a campus culture the student would genuinely enjoy, and, most importantly, be financially viable 1016. A perfect safety school is not a last resort; it is an institution the student would be genuinely excited to attend if all other competitive options fall through.
Target Schools (Match)
A target school, sometimes referred to as a "match" school, is an institution where a student's academic statistics align closely with the vast majority of admitted students. In data terms, the student's profile sits squarely within the 25th and 75th percentiles - the middle 50% - of the accepted cohort 101116.
At a target school, the student's admission is a highly realistic possibility, but by no means is it guaranteed 1416. The institutional acceptance rate for a target school generally falls between 15% and 70% 10. Some advanced list-building frameworks further bifurcate this category into "hard targets" (schools with a 15% to 45% chance of admission) and "regular targets" (schools with a 45% to 70% chance) 9.
Because colleges utilize holistic review to balance institutional priorities - such as geographic diversity, gender ratios, intended major distribution, or specific extracurricular needs like athletics or the arts - an applicant can perfectly match a target school's academic profile and still face rejection 220. Therefore, populating a list with multiple target schools is essential to account for the unpredictable variables of institutional enrollment management.
Reach Schools
A reach school presents a significant, mathematical challenge for acceptance. This category applies if a student's GPA and standardized test scores fall below the 25th percentile of admitted students, meaning their academics trail the median of the incoming class 1116.
Crucially, any school with an overall acceptance rate below 15% operates as a reach for everyone, regardless of how flawless a student's GPA, test scores, or extracurricular achievements might be 39. These "extreme reaches" - which encompass the Ivy League, Stanford, MIT, and highly selective liberal arts colleges - routinely turn away tens of thousands of applicants who boast impeccable academic profiles simply because there are not enough physical seats on campus 17. Applying to reach schools is entirely encouraged if the student is deeply passionate about the institution and can articulate a compelling personal narrative, but the foundation of a balanced college list cannot be anchored by them 217.
Summary of Categorization Thresholds
| School Category | Institutional Acceptance Rate | Student's Academic Profile (vs. Admitted Class) | Estimated Admission Probability |
|---|---|---|---|
| Safety (Likely) | > 50% - 70% | At or above the 75th percentile | > 70% (Near certain) |
| Target (Match) | 15% - 70% | Within the middle 50% (25th - 75th percentile) | 15% - 70% (Realistic, not guaranteed) |
| Reach / Extreme Reach | < 15% (for everyone) | Below the 25th percentile (or school is hyper-selective) | < 15% (Unlikely but possible) |
Data compiled from contemporary college counseling frameworks and Common Data Set guidelines 3910111716.
What Colleges Actually Care About
To accurately place schools into Reach, Target, and Safety buckets, students must understand what admissions officers are actually weighing behind closed doors, rather than relying on high school mythology. The National Association for College Admission Counseling (NACAC) conducts an annual "State of College Admission" report, surveying hundreds of four-year institutions to determine exactly which factors influence their admissions decisions 1819.
The Unshakable Priority: The Academic Record
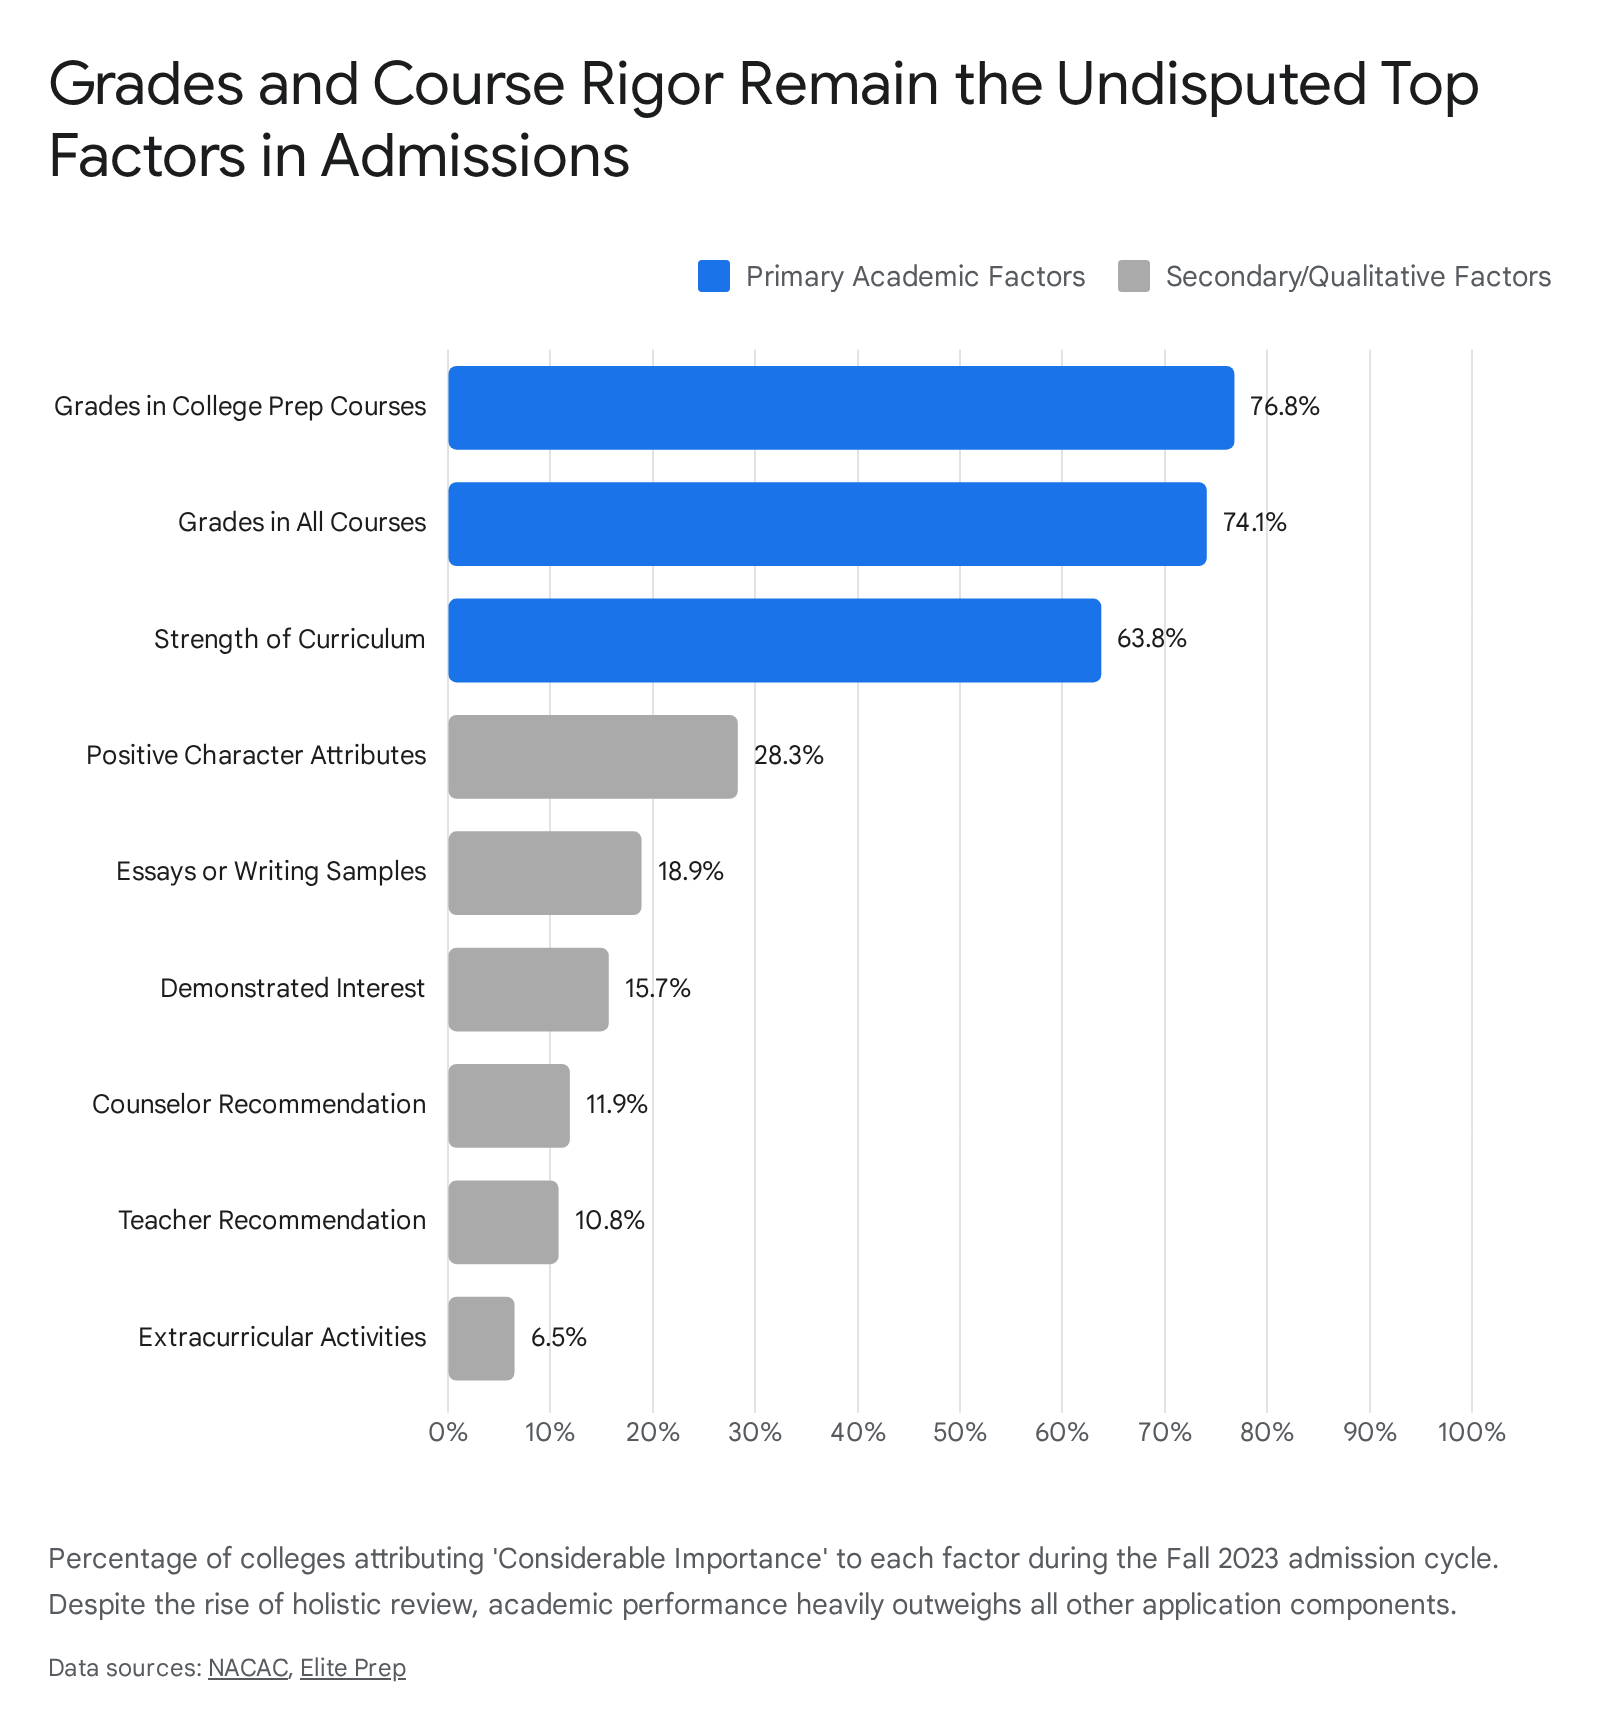
According to the Fall 2023 NACAC admission cycle data, the most critically evaluated elements of a student's application are entirely academic in nature. Specifically, the percentage of colleges attributing "Considerable Importance" to academic factors are 76.8% for high school grades in college prep courses, 74.1% for total high school grades across all courses, and 63.8% for the overall strength of the high school curriculum 1920.
Colleges place immense value on a student's willingness to challenge themselves with the most rigorous courses available at their high school, such as Advanced Placement (AP), International Baccalaureate (IB), or dual-enrollment college courses, provided the student can maintain high grades in those rigorous settings 20. Admissions officers assess the rigor of a student's curriculum to gauge academic ambition and readiness for college-level work. If a student's unweighted GPA is severely depressed, an abundance of extracurricular activities or glowing letters of recommendation will rarely compensate for it at selective institutions. The transcript tells the story of four years of sustained effort, which colleges trust far more than a well-crafted essay.
Character, Culture, and Holistic Review
Once a student passes the rigorous academic threshold, qualitative factors come into play to differentiate the thousands of highly qualified applicants. Positive character attributes - such as resilience, empathy, integrity, and leadership - were cited as considerably important by 28.3% of colleges 20. Essays or writing samples followed, deemed considerably important by 18.9% of institutions 20.
In the wake of the SFFA Supreme Court decision, the personal essay and supplemental writing prompts have gained even more tactical importance. While race cannot be used as a categorical plus-factor, Chief Justice John Roberts explicitly noted in the majority opinion that colleges may consider how race or background has affected an applicant's life - whether through discrimination, inspiration, or personal growth - provided that consideration is tied to their individual character and unique experiences 521.
Consequently, essays are now doing a massive amount of "heavy lifting" in the admissions process 12. In the last three admissions cycles, schools have aggressively added supplemental essay prompts that give students the opportunity to share their backgrounds and diverse life experiences, essentially serving as a mechanism to gather contextual diversity data without violating the SFFA mandate 1. However, this practice is under intense scrutiny; in July 2025, the Department of Justice suggested that essay prompts specifically fishing for lived experiences related to race could violate federal civil rights laws, signaling further potential volatility in how essays are evaluated moving forward 1.
Beyond essays, researchers have noted that the way students describe their extracurricular activities can signal "cultural capital," which subtly influences admissions counselor responses. Studies have shown that counselors at selective institutions occasionally expend greater effort responding to prospective students who signal "highbrow" cultural capital - such as playing the trombone in a symphonic band or sailing - compared to those with popular cultural capital, revealing hidden biases that still permeate holistic review 22.
Strategic List-Building Frameworks
Most admissions experts and school counselors recommend that students apply to a total of 8 to 12 well-researched colleges 3101627. Applying to fewer than six can severely limit options, especially when unexpected rejections occur or financial aid packages fall short of family needs. Conversely, applying to more than 15 schools yields diminishing returns; applicant fatigue sets in, the quality of supplemental essays inevitably drops, and students struggle to authentically communicate their fit for each unique institution 323. To distribute risk effectively within that 8 to 12 school target, counselors rely on structured mathematical frameworks.
The Traditional 3-3-3 Method
The "3-3-3" college list method is a traditional, balanced framework that divides a student's applications evenly across the three major tiers of selectivity. It dictates that a student apply to three reach schools (aspirational choices where the student is reaching for the stars), three target schools (realistic options where the student perfectly matches the profile), and three safety schools (institutions where the student exceeds requirements and is nearly guaranteed admission) 2729.
This model works exceptionally well for students with specialized academic interests, or those applying in geographic regions with highly stable, predictable public university systems. The 3-3-3 framework ensures that the student dedicates equal time, emotional energy, and application effort to each tier of selectivity, preventing them from becoming overly fixated on hyper-selective institutions while neglecting their foundational safety net 27.
The Modern 2-4-2 Method
In response to surging application volumes, plummeting acceptance rates, and unpredictable admissions yields following the SFFA ruling, many elite counselors and law school admissions advisors have adapted their strategies to the "2-4-2" framework 1524.
The 2-4-2 method recalibrates the center of gravity on the college list. It calls for only two reach schools, thereby minimizing the emotional and temporal drain of writing highly demanding, emotionally exhausting supplemental essays for institutions with sub-10% admit rates where rejection is the most statistically likely outcome 1524. The core of the strategy is the expansion to four target schools. Because target schools have become significantly harder to predict post-SFFA and post-COVID, padding the target category increases the mathematical probability of securing multiple competitive acceptances 1224. Finally, the framework retains two absolute safety schools, ensuring the student has guaranteed options, including at least one that is a verified financial safety 1524.
If a highly motivated student has the capacity to apply to more than eight schools, the 2-4-2 ratio can be scaled up proportionately (for example, evolving into a 3-6-3 model for a 12-school list) to maintain a heavy, protective emphasis on the target tier 1524.
| List Framework | Reach Allocation | Target Allocation | Safety Allocation | Strategic Benefit |
|---|---|---|---|---|
| The 3-3-3 Method | 33% | 33% | 33% | Provides even distribution of effort; excellent for predictable state university systems. |
| The 2-4-2 Method | 25% | 50% | 25% | Hedges against post-SFFA volatility by heavily padding the middle target tier. |
| The Scaled 3-6-3 | 25% | 50% | 25% | Accommodates 12 applications while preserving the protective 2-4-2 mathematical ratio. |
The Crucial Concept of the "Financial Safety"
A perfectly balanced academic list is functionally useless if the student cannot afford to attend any of the colleges that ultimately offer admission. A "financial safety" is a college that meets two strict criteria simultaneously: the student is nearly guaranteed to be admitted academically, and the family can comfortably afford to pay the resulting tuition bill even if the student receives absolutely zero need-based financial aid 112031.
For middle- and high-income families who will not qualify for federal Pell Grants or robust institutional need-based aid, securing a financial safety often means looking toward in-state public universities, local community colleges, or mid-sized private colleges that offer guaranteed, transparent merit scholarships 1131. Applying to a financial safety is a vital risk-management strategy, ensuring that families are not forced to take on crippling, high-interest private debt to fund an undergraduate education 3125.
Navigating Net Price Calculators and the SAI
Before finalizing a college list, families must determine the true, individualized cost of attendance for each institution. The "sticker price" published on a university's marketing materials is rarely the amount the average student actually pays 2634. By federal law, every college that participates in Title IV federal aid programs - meaning any college where a student could take out a federal direct student loan - is required to host a Net Price Calculator (NPC) prominently on its website 2634.
The NPC is a powerful tool that requires families to input their recent tax returns, income, assets, household size, and occasionally the student's academic profile, such as GPA and standardized test scores 263527. Once the data is entered, the calculator generates an estimate of the "net price" - defined as the total cost of attendance minus expected grant and scholarship aid that does not need to be repaid 34.
These calculators utilize federal and institutional formulas heavily tied to the Student Aid Index (SAI), which recently replaced the Expected Family Contribution (EFC) nomenclature 3527. Families frequently make the critical error of believing the SAI is the exact dollar amount they will be billed by the university. In reality, it is simply an index number used by financial aid offices to determine eligibility for federal, state, and institutional need-based aid 2635. Furthermore, colleges are under no legal or moral obligation to meet 100% of a family's demonstrated financial need. This results in "gapping," a common scenario where a financial aid package falls thousands of dollars short of what a family actually requires to enroll, making the identification of a true financial safety imperative 34.
Advisors often rely on broad heuristics, such as the 15/35/45 rule for college costs, to help families ballpark tuition and fees before diving into the granular data of the NPC, ensuring that financial expectations are managed early in the process 35.
The Role of Automatic Merit Scholarships
To guarantee affordability and bypass the uncertainty of need-based aid, many students strategically target universities that offer "automatic" or "assured" merit scholarships 373839. Unlike highly competitive, subjective scholarships that require separate applications, extensive essays, interviews, and nominations, automatic merit scholarships are awarded strictly via a transparent, formulaic grid based exclusively on a student's GPA and standardized test scores 3839.
Institutions generally group these automated awards into defined tiers, which can dramatically alter a family's financial planning: * Tier 1 (Full or Near-Full Tuition): These are highly generous automatic packages. For example, the University of Alabama is renowned for offering massive automatic scholarships for out-of-state students with high GPAs and test scores, effectively bringing the out-of-state cost down to or below in-state levels 373840. * Tier 2 ($10,000 - $25,000 per year): These awards offer substantial reductions in tuition. They are often offered by mid-tier out-of-state public universities or mid-sized private institutions, like the University of Alabama at Birmingham (UAB), looking to aggressively recruit and boost the academic profile of their incoming class 38. * Tiers 3 & 4 (Under $10,000 per year): These are smaller, baseline grants used to incentivize enrollment and lower the psychological barrier of the sticker price. Institutions such as the University of Missouri or Michigan Technological University offer these automated awards for specific, lower GPA and ACT bands 3738.
Because many automatic merit programs strictly rely on SAT or ACT score thresholds, maintaining a rigid "test-optional" strategy can inadvertently cost a student tens of thousands of dollars in guaranteed, four-year aid 3741. Many universities that are test-optional for admissions purposes still require standardized test scores to unlock their automatic merit aid grids, making test preparation a highly valuable financial investment 41.
| Scholarship Tier | Estimated Value | Typical Requirements | Institutional Strategy |
|---|---|---|---|
| Tier 1 | Near Full / Full Tuition | 3.5+ GPA, 32+ ACT or 1420+ SAT | Aggressively poach top-tier out-of-state talent (e.g., Univ. of Alabama). |
| Tier 2 | $10,000 - $25,000 / year | 3.0+ GPA, 25+ ACT or 1200+ SAT | Discount out-of-state tuition to make it competitive with the student's in-state options. |
| Tiers 3 & 4 | $1,000 - $10,000 / year | Varies; often GPA only | Provide baseline psychological discounts to yield admitted students. |
Note: Merit grids change annually. Families must verify current requirements on institutional financial aid websites 38.
Common Pitfalls in College List Building
Even when equipped with the right frameworks and financial tools, families frequently succumb to cognitive biases and strategic errors when building and finalizing their college lists. Understanding these pitfalls is essential for maintaining a balanced portfolio of applications.
Relying on Outdated Acceptance Rates
Families frequently underestimate how selective certain schools have become, often relying on historical anecdotes rather than current data. Institutions that parents remember as "easy" target schools from their own youth have seen massive surges in selectivity due to application inflation. For example, schools like New York University (NYU) now boast admit rates (around 12.8%) that mirror the Ivy League of twenty years ago 42. Students must use the most recent Common Data Set or institutional press releases to gauge their chances, recognizing that admissions data from even five years ago is essentially obsolete 342.
The "Safety School" Illusion and Yield Protection
A prominent pitfall for highly accomplished, straight-A students is assuming that having statistics far above a school's 75th percentile automatically guarantees admission 42. Some universities actively practice enrollment management tactics known as "yield protection" (historically nicknamed "Tufts Syndrome").
If an admissions office reviews a candidate with a flawless academic profile but zero demonstrated interest in the school - meaning the student has not visited campus, attended virtual webinars, or opened marketing emails - they may reject or waitlist the applicant 201942. The university assumes the overqualified student is using the college solely as a backup and will ultimately enroll elsewhere, which would hurt the university's yield rate 42. Therefore, demonstrating genuine interest remains a critical factor; in fact, 15.7% of colleges rate demonstrated interest as "considerably important" in their admission decisions 1920. Students must treat their safety schools with the same level of respect and engagement as their reach schools.
Misusing Early Decision (ED)
Early Decision is a binding agreement where a student commits to attending a college if accepted, and must withdraw all other applications. Because ED acceptance rates are statistically higher than Regular Decision (RD) rates, students frequently make the strategic mistake of using their single ED card on an "extreme reach" school where they are not academically competitive 42.
While ED provides a slight statistical boost because it guarantees yield for the university, it cannot magically overcome a fundamentally uncompetitive academic transcript 42. A more effective, risk-averse strategy is to use ED at a high-end "target" school where the student is highly competitive but faces a crowded field. This tactic locks in a top-tier choice and avoids the uncertainty and lower acceptance rates of the regular admissions round 42. It is also important to note that Early Action (EA), which is non-binding, does not offer the same statistical advantage as ED and should not be treated as a silver bullet for reach schools 42.
Failing to Verify Program-Specific Selectivity
An institution's overall, top-line acceptance rate can be highly misleading if a student is applying to a heavily impacted or highly specialized major 43. Programs such as Computer Science, Nursing, direct-entry Engineering, and undergraduate Business are significantly more competitive than the university's general arts and humanities programs 101743. A university that serves as an overall "safety" or "target" for a history major might operate as an extreme "reach" for its Computer Science department 17. Students must evaluate their academic statistics against the specific college or department they intend to enter, often requiring them to dig deeper into departmental data or consult with admissions counselors directly 1017.
Alternative Pathways and Risk Mitigation
For students who face intense financial constraints or those whose academic profiles developed late in high school, traditional four-year admissions directly out of high school is not the only viable pathway. Implementing alternative routes into a college list can serve as the ultimate safety net.
Many higher education frameworks heavily support transfer pathways, such as the 2>4 model (completing two years at a community college before transferring to a four-year university) 3128. Community colleges in states like California offer low-cost education with formalized articulation agreements, allowing students to complete general education requirements before transferring as juniors into the highly competitive UC or CSU systems 31. These pathways serve as exceptional financial safeties for middle-income families, providing a rigorous academic environment while significantly deferring the high costs of a four-year residential university 31.
Before committing to any institution, whether as a first-time freshman or a prospective transfer, students must use FAFSA estimators to gauge real costs, thoroughly research transfer scholarships, and carefully compare prerequisite overlaps to avoid financial strain and lost academic credits down the line 4143.
Bottom line
Building a balanced college list in the modern era requires divorcing emotion, brand obsession, and historical prestige from cold, hard data. By utilizing structured frameworks like the 2-4-2 method and heavily scrutinizing the Common Data Set, students can effectively hedge against the unprecedented volatility of the post-SFFA, application-inflated admissions landscape. A strategically sound list anchors itself with true academic and financial safeties, heavily pads the middle with thoroughly researched target schools, and selectively includes a few aspirational reaches. Ultimately, the subjective, human element of holistic review at hyper-selective institutions remains inherently unpredictable, making robust preparation and enthusiasm at the safety and target levels the true hallmark of a successful college admissions strategy.