First-Year Performance of Mega-Cap IPOs and SpaceX Projections
Structural Evolution of Equity Offerings
The initial public offering of a mega-capitalization technology firm constitutes a rare structural phenomenon within global equity markets. Unlike standard public listings, which primarily function as capital-raising mechanisms for mid-stage enterprises, mega-cap equity offerings introduce immediate, massive distortions into market capitalization weightings, passive index tracking mechanics, and broad sectoral valuation paradigms. Evaluating the historical first-year performance of these entities - specifically Alphabet, Meta Platforms, and Alibaba Group - provides critical empirical precedents for forecasting the market absorption of the SpaceX initial public offering scheduled for June 12, 2026.
With a targeted public market valuation of $1.75 trillion to $1.8 trillion and an anticipated capital raise of $75 billion at $135 per share, the SpaceX listing is projected to be the largest in capital markets history 1234. This dwarfs the previous record set by Saudi Aramco in 2019, which raised $25.6 billion 4. The sheer scale of the SpaceX offering tests the mechanical limits of modern capital markets, particularly regarding index inclusion eligibility, float scarcity, and the pricing of capital-intensive aerospace and artificial intelligence infrastructure. This analysis evaluates the first-year performance trajectories of historical mega-cap technological listings, contextualizes them within prevailing macroeconomic and regulatory environments, and applies these theoretical frameworks to the unique structural dynamics governing the SpaceX offering.
Theoretical Frameworks of Initial Public Offering Pricing
Understanding the immediate market reaction to a mega-cap listing requires examining the academic theories underpinning equity pricing mechanisms, underpricing trends, and secondary market liquidity. The transition from private valuation to public market clearing price is historically characterized by significant friction and price discovery inefficiencies.
Underpricing and State-Contingent Compensation
The persistent phenomenon of initial public offering underpricing has been thoroughly documented in financial literature dating back to a foundational 1963 study by the United States Securities and Exchange Commission 5. Academic research indicates that average first-day returns, or underpricing, hovered around 7% during the 1980s, doubled to 15% during the 1990-1998 period, spiked to 65% during the internet bubble of 1999-2000, and subsequently normalized to approximately 12% in the 2001-2003 era 618.
This systematic underpricing is often theorized as a necessary market equilibrium condition to induce uninformed investors to participate in primary offerings, mitigating the "winner's curse" associated with asymmetric information 561. Furthermore, the "changing risk composition hypothesis" suggests that riskier unseasoned equities require deeper underpricing discounts to clear the market 61. More recent analyses attribute high levels of underpricing to the "changing issuer objective function" and the "analyst lust hypothesis," where issuing firms intentionally leave money on the table to secure favorable post-listing research coverage and allocate underpriced shares to executive brokerage accounts - a practice known as spinning 618. From the issuer's perspective, this dynamic acts as state-contingent compensation; founders and executives accept dilution on the newly issued shares because the resulting first-day price jump massively inflates the value of their retained equity holdings 61.
Secondary Market Spanning and Liquidity Premiums
The pricing of mega-cap offerings in the modern era is heavily influenced by the maturation of private secondary markets. In previous decades, the public offering was the primary mechanism for price discovery. By the mid-2020s, private market secondaries expanded exponentially, achieving a record $226 billion in global transaction volume in 2025, representing a 41% year-over-year increase from 2024 2.
However, transactions in private secondary markets are highly complex and fundamentally lack transparency, as key financial statements are generally not publicly disclosed 2. Deals are routinely priced based on historical data that lags real-time market conditions, making intrinsic valuations challenging 2. The transition to the public market resolves this incomplete spanning. Theoretical models demonstrate that public equity offerings provide issuers with access to centrally accessed secondary market liquidity, decreasing the price impact of investment exits for founders 31112. This "liquidity value" is bargained over between underwriters and investors during the pricing meetings, resulting in a discounted offer price that typically resolves into a higher secondary market bid price upon the commencement of public trading 31112.
Historical Precedents of Mega-Cap Equity Performance
The public market debuts of Alphabet (formerly Google), Meta Platforms (formerly Facebook), and Alibaba Group serve as the primary foundational case studies for modeling how massive equity injections stabilize during their first year of trading. Each instance highlights specific vulnerabilities, ranging from execution risk to profound regulatory overhangs.
Alphabet and the Dutch Auction Clearing Mechanism
The Google initial public offering in August 2004 utilized a highly unconventional structure intended to bypass traditional investment banking allocation control. Rather than relying on standard book-building, the company employed a Dutch auction to democratize share allocation and minimize underpricing friction. The offering cleared at $85 per share, raising $1.67 billion 1314.
While the absolute capital raised was modest compared to contemporary mega-caps, Google's post-listing performance established the baseline for long-term technological utility pricing. An investor allocating $1,000 at the IPO would see a roughly 144-fold increase over the subsequent two decades, reflecting a 25.37% compound annual growth rate by mid-2026 14. The first year of trading demonstrated steady, compounding appreciation, as the company had already achieved operating maturity and definitive market dominance in search advertising at the time of listing. The company's subsequent restructuring into the Alphabet conglomerate allowed it to separate its highly profitable core search operations from capital-intensive, speculative technological ventures.
Meta Platforms and Mobile Transition Friction
The May 2012 initial public offering of Facebook (Meta Platforms) stands as a primary historical example of acute first-year market friction. Priced at $38 per share, the offering raised approximately $16 billion but was immediately marred by technical execution failures on the Nasdaq exchange and severe skepticism regarding the company's fundamental business model 151617.
Specifically, institutional investors expressed intense concern regarding the company's ability to transition its advertising monetization engine from desktop environments to mobile platforms. Consequently, the equity spent the majority of its first 12 months trading significantly below its offering price, highlighting the vulnerability of highly anticipated technological listings to sudden shifts in forward-looking sentiment. The equity did not achieve sustained recovery until the company definitively proved its mobile monetization capabilities in subsequent earnings reports. By the end of 2013, the stock closed at $54.22, representing a 99.2% return for the year 15.
Furthermore, the structural mechanics of Meta's listing provide crucial context for passive capital absorption. The company was not added to the S&P 500 index until December 2013 - a full 18 months after its public debut - when it replaced Teradyne Incorporated 16. This extended timeline illustrates the standard seasoning requirements historically enforced by major index providers, which intentionally delay the rush of passive index capital until a newly public entity demonstrates sustained financial viability and price stability.
Alibaba Group and Cross-Jurisdictional Structural Friction
The September 2014 initial public offering of Alibaba Group is the most accurate historical analog to the impending SpaceX listing in terms of absolute capital scale, cross-border complexity, and complex governance risks. Priced at $68 per share, the offering raised $25 billion, taking the title of the largest public offering in history from the Agricultural Bank of China 4192021. Supported by massive secondary market demand, the stock experienced a 38% first-day appreciation, closing at $93.89 and achieving a market capitalization of approximately $250 billion 222324.
Despite the initial euphoria, Alibaba's first-year equity performance provides a stark empirical warning regarding post-listing structural and regulatory vulnerabilities. After peaking at $119.15 in November 2014, the stock entered a protracted decline, ultimately tumbling to $53.79 - a negative return from its offering price - before recovering slightly to close 2015 down 22% for the year at $78.89 2526528. Three specific catalysts drove this sustained depreciation.
First, Alibaba utilized a complex Variable Interest Entity (VIE) structure to bypass strict Chinese government regulations restricting foreign ownership in domestic internet and telecommunications sectors 29678. Through this mechanism, foreign investors did not purchase direct equity in Alibaba's operating assets; rather, they purchased shares in an offshore shell company (typically domiciled in the Cayman Islands) that held contractual rights to the revenue streams of the Chinese operating entities 2168. This structure introduced profound geopolitical risk, as the contracts were vulnerable to being declared unenforceable by Chinese authorities 21296. Financial analysts and U.S. regulators repeatedly warned that the VIE structure lacked standard shareholder protections, creating a persistent risk premium that weighed on institutional demand as the initial listing hype subsided 2968.
Second, the company faced acute regulatory enforcement friction. In January 2015, China's State Administration for Industry and Commerce (SAIC) published a highly critical white paper accusing Alibaba's Taobao marketplace of facilitating the sale of counterfeit goods, permitting illegal advertising, and suffering from widespread internal bribery 423910. The SAIC admitted it had intentionally withheld the report since July 2014 to avoid disrupting the September public offering 239. The revelation erased billions in market capitalization, sending the stock down 4.36% in a single trading session, and triggered multiple securities fraud class-action lawsuits in United States federal courts alleging the withholding of material risk factors 491011.
Third, the expiration of insider lock-up agreements induced severe downward price pressure. IPO lock-up agreements typically restrict insiders from selling shares for 90 to 180 days to stabilize the post-listing price 12. In March 2015, Alibaba's initial 180-day lock-up expired, theoretically releasing 437 million shares onto the public market 205. This was followed by a massive secondary expiration in September 2015, releasing approximately 1.6 billion shares held by major stakeholders including Yahoo, Softbank, and founder Jack Ma 2051213. As 63% of the company's total equity exited lock-up restrictions simultaneously, the stock tumbled 3.38% to $63.53 in midday trading amid fears of institutional liquidation 28. The Alibaba precedent demonstrates that while lock-up provisions successfully stabilize early trading, they frequently defer inevitable sell-off activity to the expiration date, overwhelming natural market demand 12.
Performance Comparison of Historical Mega-Cap Listings
| Entity | Listing Year | Capital Raised | Offer Price | Peak First-Year Price | Month 12 Price Status | Primary First-Year Friction Vectors |
|---|---|---|---|---|---|---|
| Alphabet | 2004 | $1.67 Billion | $85.00 | Consistent Growth | Significantly above offer | Transition from private to public reporting requirements |
| Meta | 2012 | $16.00 Billion | $38.00 | $45.00 (Day 1) | Recovering, near offer | Exchange execution failures, mobile monetization transition |
| Alibaba | 2014 | $25.00 Billion | $68.00 | $119.15 | Below offer price | VIE structure risks, SAIC regulatory probe, massive lock-up expirations |
Valuation Paradigms in the Artificial Intelligence Infrastructure Era
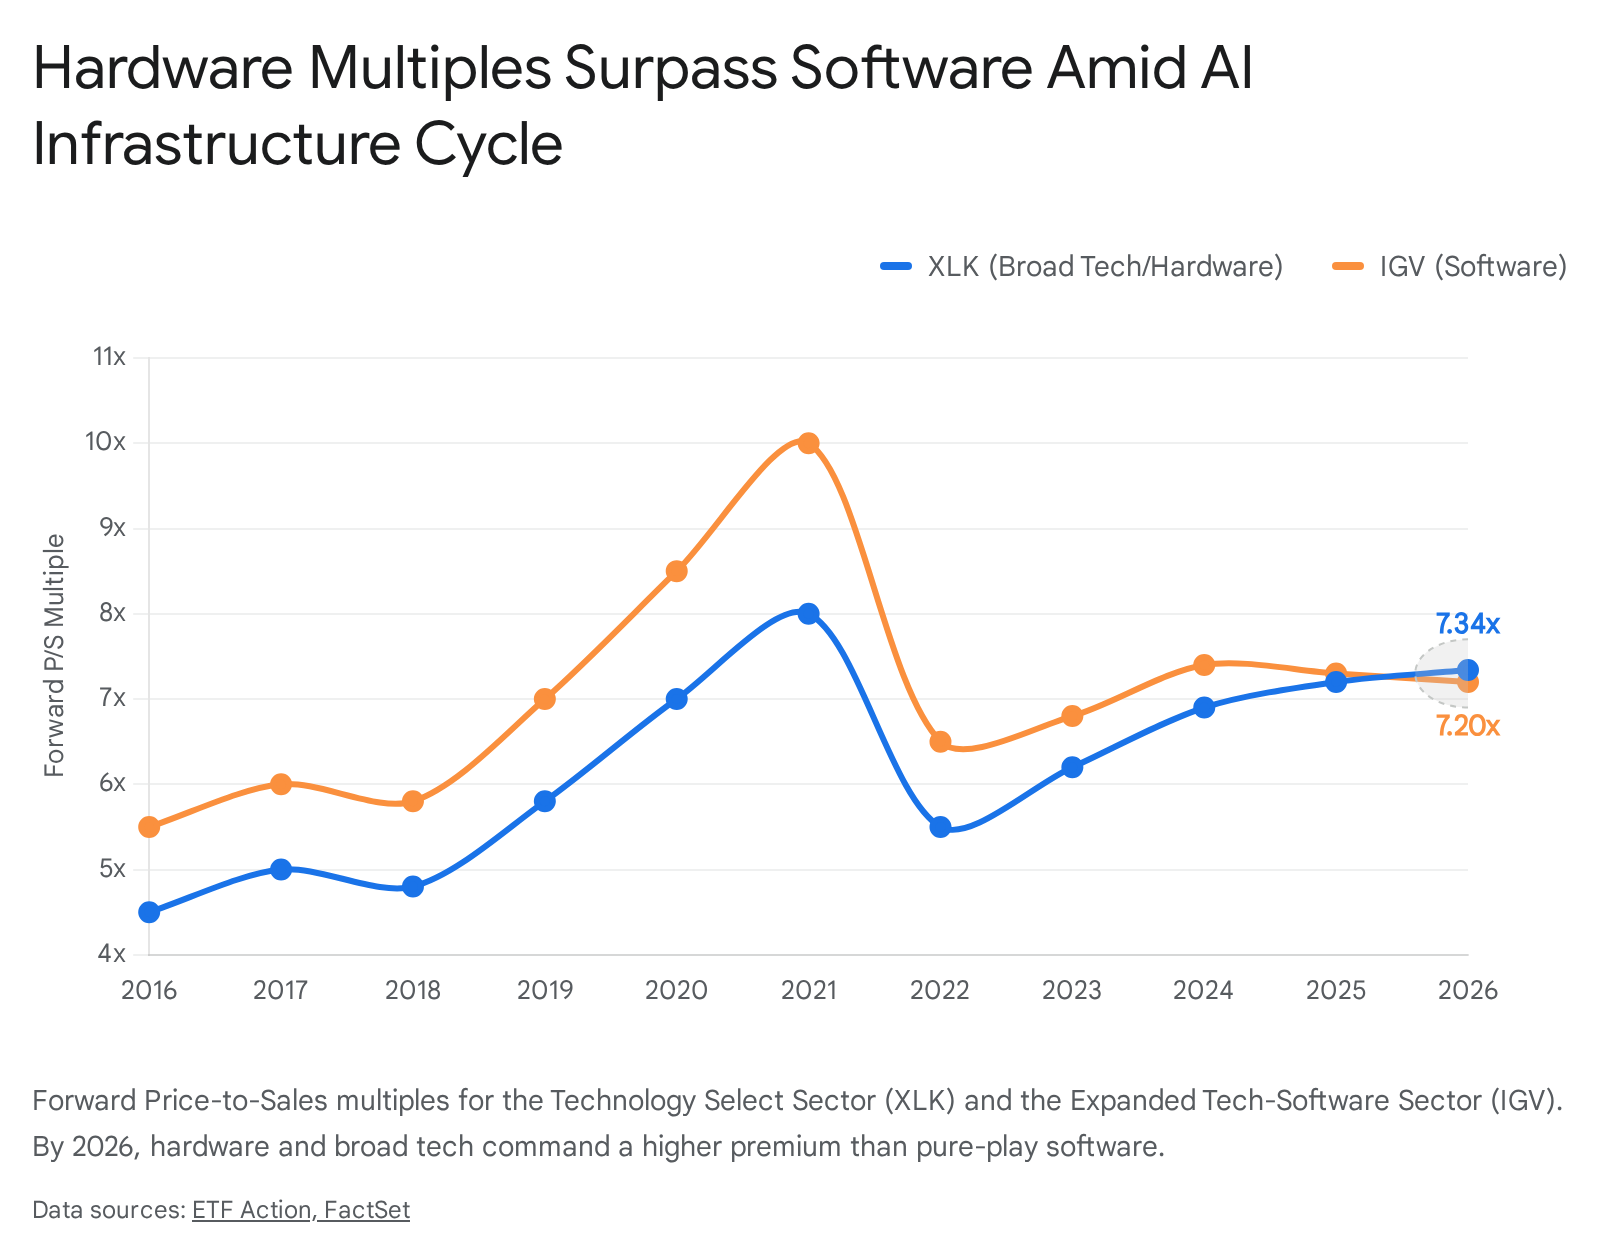
To accurately forecast SpaceX's valuation stability during its first year of trading, the analysis must evaluate the prevailing sectoral risk premiums of 2026. For the decade following the Meta and Alibaba listings, public equity markets assigned a severe premium to pure-play software enterprises. Characterized by gross margins exceeding 80%, sticky recurring subscription revenue, and minimal physical capital expenditure requirements, software entities frequently commanded Price-to-Sales (P/S) multiples ranging from 10x to 12x 3839. Conversely, traditional hardware manufacturers were priced essentially as physical commodities, trading steadily near 2x sales due to thin margins, intense supply chain friction, and massive capital intensity 3940.
Hardware Premiums and Software Multiple Compression
By the beginning of 2026, this valuation dynamic completely inverted. Driven by the massive capital requirements of the artificial intelligence infrastructure buildout, market leadership shifted decisively from application software to physical hardware and telecommunications equipment 3841. Hardware manufacturers benefit from tangible commercial demand, secured sovereign orders, and near-term cash flows tied to physical data centers and advanced semiconductor fabrication 3941. Meanwhile, application software companies face intense multiple compression due to uncertainties surrounding the monetization of generative AI models and pressure on seat-based pricing from corporate efficiency mandates 3841.
Market data confirms this divergence. From 2016 through early 2026, the Technology Select Sector SPDR Fund (XLK) - which is heavily weighted toward semiconductors and broad hardware - achieved a 623% total return. In contrast, the iShares Expanded Tech-Software Sector ETF (IGV) lagged substantially, achieving a 294% return 38. More critically, the underlying valuation multiples officially crossed over: broad technology and hardware command a higher Next-Twelve-Months Price-to-Sales multiple (7.34x) than the pure-play software sector (7.20x) 38. The market has decisively stripped software of its historic premium, rewarding capital-intensive defensibility 3839.
Conglomerate Structures and Market Discounts
SpaceX presents a highly complex valuation profile that straddles the boundary between industrial hardware and high-margin software. The corporate structure is fundamentally a hybrid. The launch vehicle division (Falcon 9, Starship) requires immense capital expenditures typical of aerospace manufacturing. Conversely, the Starlink satellite broadband division operates on a software-driven recurring subscription model 4243. By early 2026, Starlink had deployed over 9,600 low earth orbit satellites and surpassed 10 million active subscribers 44. This segment dominates the corporate revenue mix, contributing approximately $11.4 billion - or 61% - to the $18.67 billion total revenue generated in the 2025 fiscal year, and stands as the company's only currently profitable division 12.
Simultaneously, SpaceX has aggressively integrated artificial intelligence infrastructure into its balance sheet. Following the acquisition and merger of xAI in February 2026, the company rapidly expanded into AI compute operations, consuming $6.4 billion in capital expenditures to construct the Colossus data center 145. The ultimate strategic objective involves launching up to 100 gigawatts of AI compute assets into orbit to bypass terrestrial energy constraints 12.
This sprawling structural footprint theoretically exposes SpaceX to the "conglomerate discount." Financial literature defines this phenomenon as the tendency of public markets to value a diversified corporate entity holding dissimilar businesses at 5% to 15% less than the sum of its individual parts 464748. This discount arises from resource allocation inefficiencies, lack of pure-play alignment for institutional portfolios, and the opacity of internal capital markets 464748. However, modern technological holding companies have successfully inverted this paradigm. Entities that exhibit monopolistic platform dominance, cross-selling leverage, and deep technological integration frequently trade at a "conglomerate premium" 464750. SpaceX's extreme vertical integration - manufacturing engines, avionics, software, user terminals, and orbital data centers entirely in-house - provides a mechanism to potentially bypass the discount, provided the corporate center executes flawlessly across the disparate divisions 250.
The Macroeconomic Landscape of 2026
Comparisons between SpaceX and historical mega-cap listings must be rigorously adjusted for the prevailing macroeconomic environment. The public debuts of Meta and Alibaba occurred during sustained periods of zero-interest-rate policy (ZIRP) and aggressive quantitative easing managed by global central banks 22. This monetary environment generated abundant, low-cost liquidity, incentivizing institutional investors to heavily discount near-term cash flow metrics in favor of long-term revenue growth and market share acquisition 22.
By June 2026, the macroeconomic landscape represents a fundamentally restrictive paradigm. Following persistent inflation driven by geopolitical supply shocks and fiscal expansion, the Federal Reserve maintains an effective federal funds rate of 3.62%, with target ranges holding between 3.50% and 3.75% 5152. Treasury markets reflect this restrictive stance, with the 10-year Treasury yield oscillating near 4.46% and the 2-year yield - which closely tracks near-term monetary policy expectations - jumping to 4.16% following robust labor market data 5154. Furthermore, inflation has remained stubbornly above the 2% target mandate, with recent Consumer Price Index reports showing headline inflation accelerating past 3.8% and topping 4% on an annual basis 55.
Under the leadership of newly appointed Federal Reserve Chair Kevin Warsh, futures markets have entirely abandoned expectations for monetary easing in 2026, instead pricing a gradual rise in the policy path toward 3.8% by late 2026 5155. This high cost of capital exerts immense pressure on cash-consumptive technological enterprises. SpaceX currently operates with a massive capital deficit; while operating cash flows reached $6.79 billion in 2025, cash utilized in investing activities exploded to $19.58 billion to fund the concurrent development of the Starship architecture and xAI infrastructure, resulting in an operating loss of $2.59 billion 12. While the $75 billion capital raise provides a substantial runway, the broader equity market's tolerance for multi-billion-dollar GAAP losses is severely constrained 152. If rising discount rates continue to compress technological valuations - evidenced by a 4.2% slump in the Nasdaq composite in early June 2026 - the SpaceX premium will face severe stress-testing during its first year of public trading 54.
Index Inclusion Mechanics and Passive Capital Allocation
The most decisive factor determining SpaceX's first-year equity performance is not the fundamental valuation of its underlying aerospace assets, but rather the structural mechanics of passive index inclusion. Mega-cap initial public offerings instantly strain the rulebooks of major index providers, generating vast mechanical capital flows that heavily distort natural price discovery.
Fast-Track Inclusion Protocols for the Nasdaq and Russell Indexes
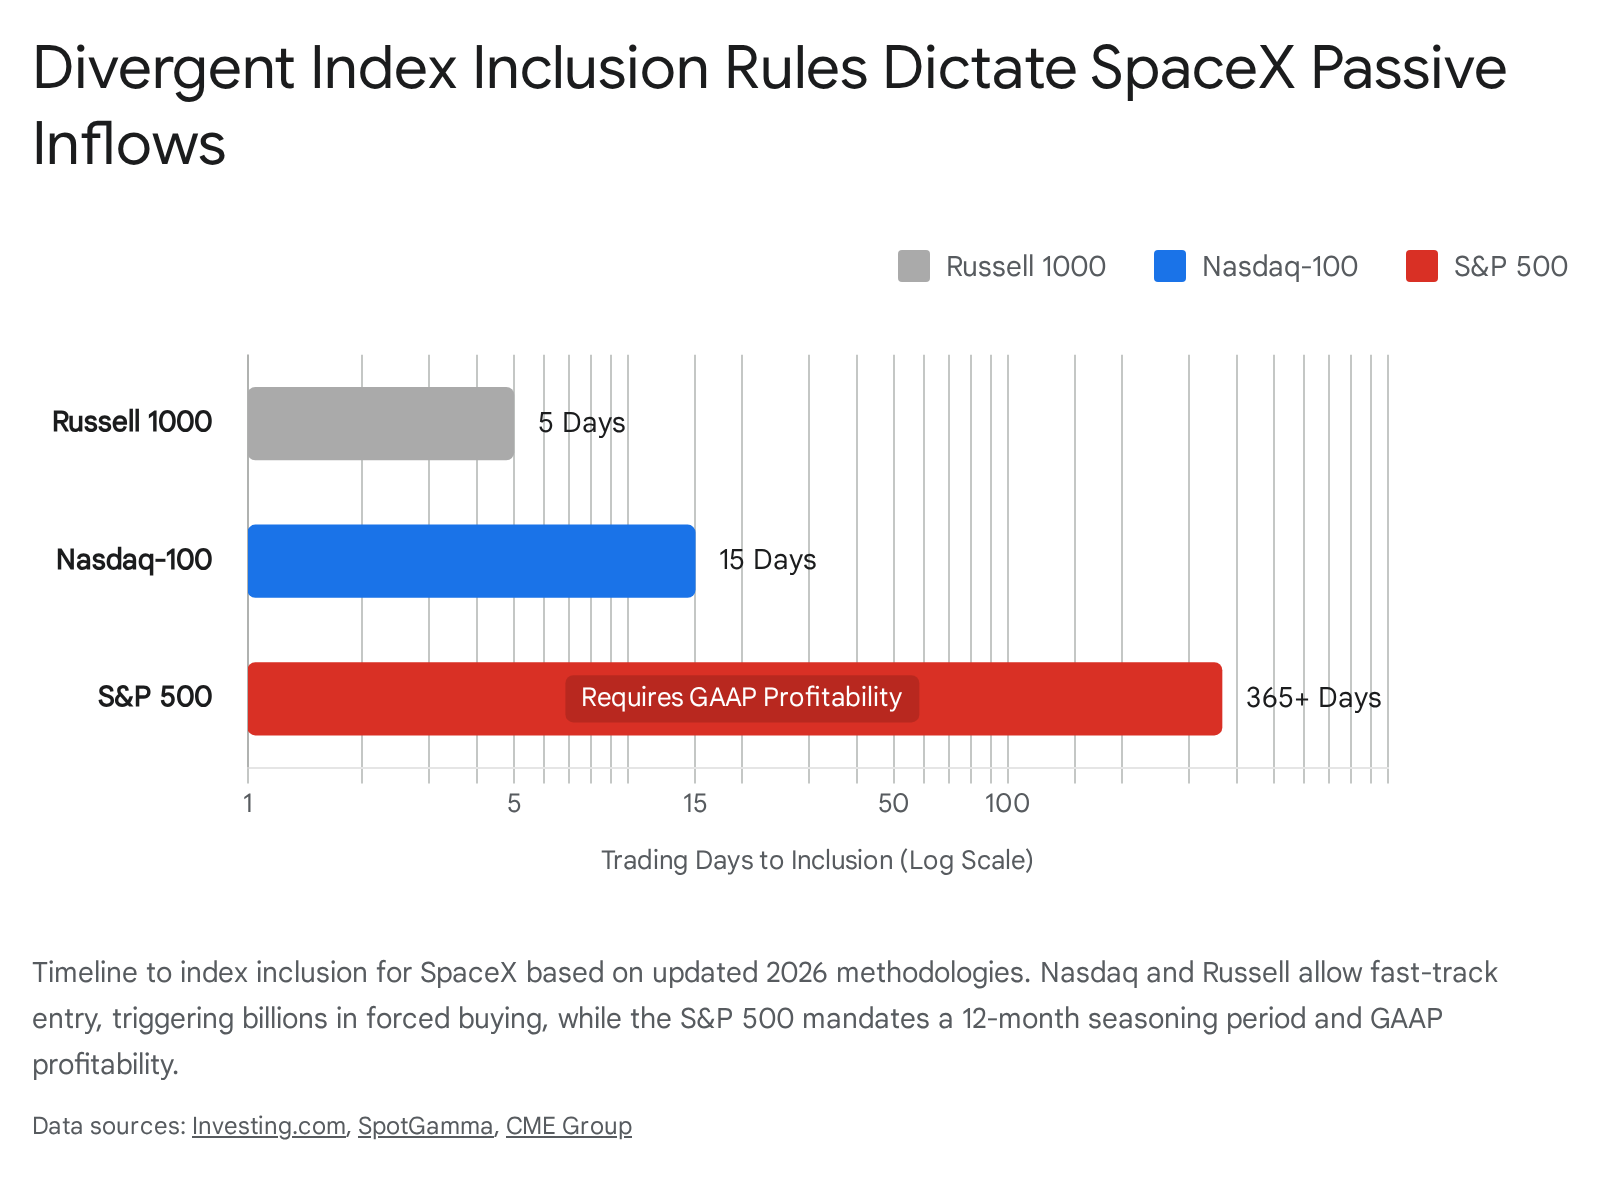
Faced with a $1.75 trillion entity entering the public markets, major index providers have diverged sharply in their methodologies. The Nasdaq index enacted sweeping rule modifications, effective May 1, 2026, to accommodate massive initial offerings. The revised methodology eliminated the standard three-month seasoning period, allowing "fast entry" for newly listed companies ranked in the top 40 by market capitalization after just 15 trading days 34455758.
Crucially, Nasdaq eliminated its minimum 10% public float requirement, replacing it with a low-float cap that allows shares to receive an adjusted weighting multiplier up to three times their actual float value 3459. Similarly, the FTSE Russell indices adjusted their methodologies, effective May 2026, allowing mega-cap IPOs to qualify for the Russell 1000 index five trading days post-listing, waiving the standard 5% minimum float rule provided insider lock-up agreements are scheduled to cure the float shortfall within 12 months 34. The CRSP indexes, which underlie major Vanguard total market funds, also feature fast-track rules allowing inclusion within five days 358.
This regulatory accommodation creates an immediate, massive liquidity distortion. SpaceX is executing the listing with extreme "float scarcity," floating only 3% to 5% of its total equity to the public - a stark contrast to established index components that typically maintain free floats above 80% 345. The mechanical, price-insensitive buying from passive index funds tracking the Nasdaq 100 (e.g., QQQ) and the Russell 1000 is estimated to generate $8 billion in forced passive purchases within the first month, with total passive accumulation potentially scaling to $30 billion 34560. Because passive funds must acquire the stock regardless of valuation, this mechanical demand colliding with an artificially constrained supply of tradable shares will drive extreme upside volatility 34.
Standard Seasoning Requirements and S&P 500 Exclusion
In stark contrast to the rapid accommodations made by Nasdaq and Russell, S&P Dow Jones Indices formally rejected proposals to fast-track mega-cap equity listings. Following a consultation period ending in late May 2026, the S&P confirmed on June 4 that it would retain its strict historical inclusion criteria for the S&P 500 345960.
The S&P 500 methodology mandates a 12-month public seasoning period, a minimum 10% Investable Weight Factor (public float), and four consecutive quarters of positive GAAP profitability 344559. Because SpaceX recorded a $4.28 billion GAAP loss in the first quarter of 2026 and holds a public float substantially below 10%, the company currently fails multiple eligibility criteria 357. Consequently, the S&P Dow Jones decision ensures that SpaceX cannot enter the S&P 500 until mid-2027 at the absolute earliest, and only if it achieves sustained financial profitability 360.
This creates a profound bifurcation in the passive investment universe. Trillions of dollars housed in S&P 500 tracking instruments (e.g., SPY, VOO, IVV) are forced to remain entirely on the sidelines during SpaceX's first year of trading 358. This regulatory divergence provides active portfolio managers with a definitive alpha generation opportunity. Active funds benchmarked to the S&P 500 can accumulate SpaceX equity throughout late 2026 and early 2027, preemptively front-running the massive mechanical buying wave that will inevitably occur when the company eventually satisfies the GAAP profitability and seasoning requirements 45.
Summary of Index Methodology Specifications
| Benchmark Index | Base Inclusion Timeline | Float Threshold Rule | Financial Viability Screen | Mechanical Inflow Severity |
|---|---|---|---|---|
| Russell 1000 | 5 Trading Days | 5% Waived (if cured internally) | None | High (Immediate execution) |
| Nasdaq 100 | 15 Trading Days | Eliminated (Allows 3x multiplier) | None | Extreme (~$8B+ first month) |
| S&P 500 | >12 Months | Firm 10% Minimum | 4 Quarters GAAP Net Income | Zero (Delayed to mid-2027) |
Projected Structural Constraints on SpaceX Trading Volume
Synthesizing the empirical data from historical precedents, index mechanical modifications, and the restrictive macroeconomic environment facilitates a high-probability projection of the equity constraints SpaceX will encounter during its first 12 months of public trading.
In the immediate short term - spanning the first four to six weeks following the June 12 listing - SpaceX is highly likely to trace a trajectory reminiscent of Alibaba's initial 38% appreciation 2224. This momentum will be engineered by an unprecedented 30% allocation to retail brokerage platforms (e.g., Robinhood, Fidelity), resulting in order books that are reportedly twice oversubscribed at $150 billion in demand 345. However, the fundamental structural driver will be the float squeeze. With index providers like Nasdaq and Russell artificially modifying their rulebooks to permit the inclusion of a 4.3% float stock, price-insensitive algorithms will be forced to aggressively bid up the severely limited supply of tradable shares, inherently divorcing the stock price from its fundamental $1.75 trillion valuation 3445.
The medium-term outlook, encapsulating months six through twelve, presents profound depreciation risks, closely mirroring the post-listing struggles of both Meta and Alibaba. The primary vulnerability is the structural lock-up cliff. Historical analysis proves that insider lock-up restrictions effectively defer, rather than eliminate, capital liquidation 12. When SpaceX insiders, executives, and early-stage venture capital backers - many of whom have held highly illiquid private equity for nearly two decades - are legally permitted to execute sales upon the expiration of 180-day and 365-day lock-up agreements, the sudden injection of supply will counteract the initial index-driven demand 2052812.
Furthermore, the company faces intense execution risk regarding its capital-intensive initiatives. Deploying $6.4 billion into the Colossus artificial intelligence data center requires rapid demonstration of scalable, commercially viable AI models via the xAI merger to justify the conglomerate valuation structure 1247. In an environment where the Federal Reserve maintains restrictive capital costs, the market's tolerance for compounding GAAP losses is severely diminished 515254. Investors should anticipate a deeply bifurcated first year: intense upward momentum generated by structural float scarcity and mechanical index purchasing, followed by sustained downward pressure as lock-up agreements expire, the tradable float normalizes, and public markets rigorously audit the immense capital expenditures required to maintain supremacy in both orbital aerospace and artificial intelligence infrastructure.