Electric and Autonomous Vehicle Impact on Automotive OEM Competition
The global automotive sector is undergoing a profound structural realignment driven by three concurrent technological transitions: the shift from internal combustion engines (ICE) to battery electric vehicles (BEVs), the architectural transition from hardware-defined to software-defined vehicles (SDVs), and the gradual commercialization of autonomous driving (AV) capabilities. This multi-dimensional transformation challenges the century-old dominance of legacy original equipment manufacturers (OEMs). To accurately analyze this paradigm shift, it is necessary to move beyond industry colloquialisms and apply rigorous economic frameworks to determine which innovations represent genuine market disruptions and which function as sustaining mechanisms designed to protect incumbent market share.
Theoretical Framework of Disruptive Innovation
Sustaining Versus Disruptive Innovation Mechanics
The concept of "disruptive innovation," originally formulated by Harvard Business School Professor Clayton M. Christensen, is frequently misapplied in automotive industry discourse to describe any radical technological advancement or high-profile market entrant. In Christensen's rigorous academic framework, a disruptive innovation is not determined by technological sophistication, but rather by its specific market entry trajectory and the competitive response it elicits 123. Christensen's theory divides innovations into two mutually exclusive categories: sustaining innovations and disruptive innovations 456.
Sustaining innovations focus on improving the performance of existing products along dimensions historically valued by mainstream, high-end customers 57. These innovations allow established companies to sell better products for higher profit margins to their most demanding consumers 17. Because incumbent firms possess the resources, customer base, and financial motivation to protect their most profitable segments, they almost inevitably win battles of sustaining innovation 78.
In contrast, true disruptive innovations initially underperform established products according to traditional industry performance metrics 91011. They take root in two specific ways: as low-end disruptions, targeting overserved customers with a cheaper, "good enough" alternative, or as new-market disruptions, targeting non-consumers who previously lacked the financial resources or technical skills to access the market 7101112.
The critical mechanism of disruption is the incumbent's strategic response. Established competitors, motivated by the pursuit of higher profit margins in premium tiers, typically ignore or actively flee from the low-end market segments being attacked by the disruptor 110. As the disruptor steadily improves its product's performance while maintaining its structural cost advantage, it inevitably migrates upmarket, eventually displacing the incumbents who have run out of premium niches in which to hide 45.
| Innovation Characteristic | Sustaining Innovation | Disruptive Innovation |
|---|---|---|
| Initial Target Market | Mainstream and high-end customers | Low-end consumers or non-consumers |
| Initial Performance | Superior to prior generations | Inferior on traditional metrics; "good enough" |
| Competitive Dimension | Performance, luxury, established metrics | Affordability, simplicity, accessibility |
| Incumbent Response | Aggressive defense; capital deployment | Retreat upmarket to protect profit margins |
| Long-Term Trajectory | Incremental margin expansion | Upmarket migration displacing incumbents |
Electric Vehicles and Innovation Categorization
Applying Christensen's framework to the electric vehicle market reveals a distinct dichotomy between the strategic approaches of Western and Chinese EV manufacturers. High-end electric vehicles, such as those initially introduced by Tesla, function largely as sustaining innovations within the broader automotive ecosystem 81013. Tesla entered the market at the premium tier with the Roadster and Model S, competing directly on traditional performance metrics such as acceleration, exterior styling, and luxury, utilizing an alternative battery-electric powertrain 1013. Because Tesla targeted the most demanding and profitable customer segments, incumbent luxury automakers were highly motivated to respond, triggering a massive wave of sustaining capital expenditure across the industry 78.
Conversely, the true disruptive threat to legacy automakers has emerged from the bottom of the market, primarily orchestrated by Chinese manufacturers like BYD. BYD's market entry aligns closely with the classical model of low-end and new-market disruption 10. The company and its domestic peers initially capitalized on the production of low-speed electric vehicles (LSEVs) and economy-class compact cars, targeting Chinese domestic consumers who were priced out of traditional automobile ownership 81314. These early vehicles were objectively inferior to Western ICE vehicles in range, top speed, and luxury finish, but they competed on an entirely new metric of value: extreme affordability and low operational cost 814.
As legacy Western automakers systematically abandoned the low-margin compact car segment to focus on highly profitable internal combustion trucks and premium SUVs, they voluntarily ceded the mass market to BYD and its domestic competitors 10. Operating in this uncontested space, Chinese OEMs utilized the intervening years to rapidly iterate on battery chemistry and manufacturing efficiency 1015. Having captured the low end, these manufacturers are now executing the final phase of Christensen's model: moving aggressively upmarket with vehicles that rival Western OEMs in quality and technological sophistication, but retain a structurally lower cost basis 41015.
Autonomous Driving within the Disruption Framework
A similar theoretical misclassification surrounds the advent of autonomous driving. While Level 4 and Level 5 autonomous vehicles represent a staggering technological achievement, they currently function as sustaining innovations for existing ride-hailing networks 16. Ride-hailing incumbents like Uber and Lyft currently face their highest operational costs and primary liabilities in the form of human drivers 1617. If a technology company develops a fully functional autonomous vehicle, integrating that vehicle into an existing ride-hailing network simply swaps out an expensive resource (the human driver) for a scalable capital asset (the AV software stack) 1216.
Because autonomous driving fundamentally improves the profit margins, safety profiles, and operational efficiency of the existing ride-hailing business model, established network operators are highly motivated to absorb this technology 16. Furthermore, in the near-to-medium term, autonomous vehicles are likely to remain geofenced to specific urban operational design domains 16. During this transitional phase, platforms that offer a hybrid network of human drivers for unmapped or complex routes alongside autonomous vehicles for straightforward urban routes will possess a significant competitive advantage over pure-play AV entrants who can only serve limited geographic zones 16. Consequently, an entrant attempting to use AV technology to disrupt Uber or Lyft faces a highly motivated incumbent equipped with established consumer networks, brand equity, and the financial imperative to fight a sustaining battle 16.
Software-Defined Vehicle Architecture
Evolution from Distributed to Centralized Compute
The transition to vehicle electrification is inherently linked to a more profound transformation in automotive engineering: the shift to the Software-Defined Vehicle (SDV). An SDV is fundamentally re-architected to separate software logic from physical hardware, allowing a vehicle's functions - ranging from infotainment to powertrain management, chassis dynamics, and active safety features - to be updated, continuously improved, and monetized via over-the-air (OTA) updates throughout the vehicle's entire operational lifecycle 181920.
Historically, the automotive industry relied on highly fragmented electrical/electronic (E/E) architectures. A modern legacy ICE vehicle might contain upwards of 150 disparate electronic control units (ECUs), each supplied by a different Tier 1 supplier and operating on localized networks like CAN or LIN buses with minimal bandwidth limits of roughly 1 Mbps 1920. Because proprietary software was hardcoded into these individual, isolated ECUs, integrating new features or deploying comprehensive updates required physical dealer visits and complex, multi-supplier hardware synchronization 202122.
The SDV paradigm, pioneered largely by Tesla and subsequently adopted by tech-native manufacturers like NIO, Rivian, and BYD, replaces these localized ECUs with a centralized or zonal compute architecture 2023. In this model, 3 to 5 high-performance physical computers manage the entire vehicle over a high-speed automotive Ethernet backbone capable of exceeding 10 Gbps 20.
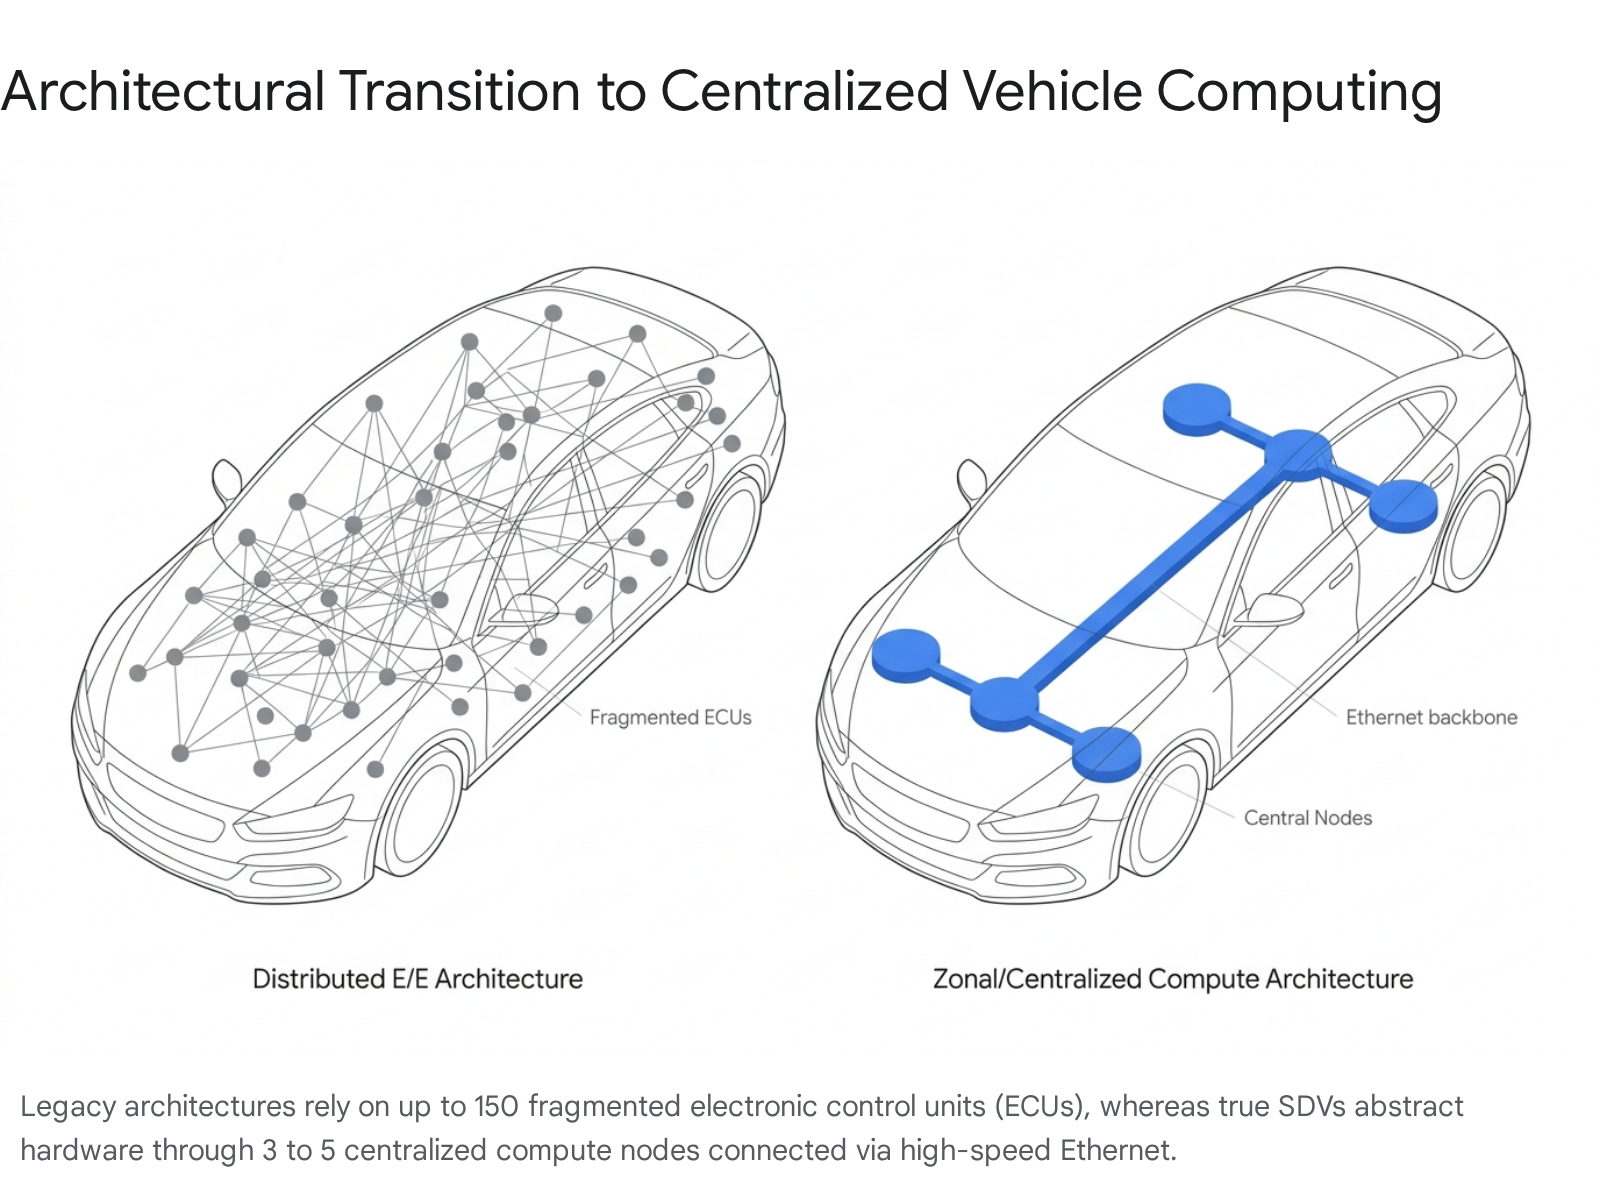
Hardware abstraction layers ensure that software applications are decoupled from underlying component hardware, effectively treating the vehicle functionally similar to a smartphone or a rolling server 19.
Over-The-Air Updates and Hardware Abstraction
The primary operational advantage of the SDV architecture is the capability for safety-critical OTA updates at production scale. While legacy OEMs frequently market OTA capabilities, these are often restricted to superficial infotainment or navigation map updates 20. True SDV architectures allow engineers to wirelessly update brake-by-wire parameters, steering logic, battery thermal management, and powertrain efficiency without any dealer involvement 20.
Tesla remains the industry benchmark in this specific domain, possessing the capability to deploy fleet-wide, safety-critical firmware updates to millions of vehicles in under 72 hours 2022. According to automotive engineering analyses, most legacy OEMs are years away from achieving this level of comprehensive hardware abstraction, with advanced Japanese and German programs not projected to hit parity in safety-critical OTA deployment until the 2027 - 2029 timeframe 20.
| Architectural Feature | Legacy E/E Architecture | Software-Defined Vehicle (SDV) |
|---|---|---|
| Compute Nodes | 100 to 150+ distributed ECUs | 3 to 5 centralized compute domains |
| Network Backbone | CAN / LIN buses (~1 Mbps) | Automotive Ethernet (10 Gbps+) |
| Update Capability | Dealer-only or basic infotainment OTA | Comprehensive, safety-critical OTA |
| Hardware Abstraction | Tight coupling; hardware defines features | Full abstraction; software dictates features |
| Development Cycle | Hardware-linked waterfall cycles (3 - 5 years) | Agile, continuous deployment practices |
Organizational Constraints and Legacy Inertia
The transition to centralized compute is not merely a hardware procurement challenge; it represents a fundamental organizational bottleneck for legacy automakers. In automotive engineering, Conway's Law - which posits that organizations design systems that mirror their own communication structures - is highly visible 21. Legacy automakers are organized into rigid, siloed departments (e.g., powertrain, chassis, interior), resulting in isolated software codebases encapsulated within specific hardware modules 1921.
Transitioning to an SDV requires shifting from mechanical, hardware-first waterfall development to agile, continuous software integration and DevOps methodologies 2223. This necessitates OEMs to bring significant software engineering talent in-house, coordinate massive codebases, and manage complex systems integration that was historically outsourced to Tier 1 suppliers 182224.
Industry surveys highlight the severity of this transition. Wards Intelligence data from 2023 and 2024 delineates that legacy systems, inflexible organizational mindsets, and a critical scarcity of software expertise are the primary hurdles to SDV deployment for traditional automakers 2425. By contrast, tech-native companies operating without the inertia of legacy ICE architectures, such as Rivian, NIO, and BYD, are able to develop new vehicle models up to a full year faster than traditional incumbents 23. Furthermore, the deployment of Chinese SDV platforms has resulted in development efficiency improving by 30%, with costs for key models dropping by up to 50% compared to traditional methodologies 26.
Operating System Development and Tech-Native Competition
The performance gap in software monetization and SDV readiness between tech-native firms and traditional automakers is widening. Tech-native companies evaluate vehicle architecture through a "software-first" lens, ensuring that software capabilities drive the product roadmap rather than hardware limitations 20. In the 2025 Gartner Digital Automotive Index, which evaluates automakers on their potential to monetize software, new entrants heavily outperformed traditional automakers. Tesla, NIO, and Xiaomi occupied the top three positions, with their combined overall score increasing to 61.6%, while the score for legacy automakers slipped to 33.8% 28.
This software superiority is evident in practical deployment. NIO's Banyan 3.3.0 operating system, deployed to over 460,000 vehicles in China in early 2026, utilizes a closed-loop reinforcement learning model connecting perception, planning, and control to vastly improve autonomous junction handling and traffic-flow avoidance 26. Xiaomi leverages its HyperOS ecosystem to integrate the vehicle directly into a broader network of smart consumer devices, accelerating its entry into the market and securing massive delivery volumes for its SU7 sedan 2728.
In stark contrast, traditional automotive efforts, such as Volkswagen's CARIAD software unit or Mercedes-Benz's MB.OS, have faced immense difficulties integrating millions of lines of code into cohesive operating systems while simultaneously attempting to sustain profitability in their legacy ICE portfolios 212226. Volkswagen's struggles have forced it to rely increasingly on localized Chinese architectures, exemplified by its platform partnership with XPENG to utilize the China Electrical Architecture (CEA) for future models 26.
Electric Vehicle Market Penetration and Regional Divergence
Chinese Market Dominance and Emerging Market Expansion
As the automotive industry progresses through the mid-2020s, early optimistic forecasts regarding universal, linear BEV adoption have been forcefully corrected by market realities 2930. While global electric vehicle sales reached an estimated 22 million units in 2025 (representing a 25% year-over-year increase), the geographical distribution of this growth is starkly uneven 3132.
China has decisively separated itself from Western markets, with New Energy Vehicles (NEVs, encompassing both BEVs and plug-in hybrids) capturing more than 50% of the domestic passenger car market in 2025 3334. China is uniquely positioned as the only global market where electric vehicles are systematically cheaper to purchase than comparable ICE vehicles, driven by massive economies of scale, consumer subsidies, and aggressive vertical integration 313235. Demonstrating this dominance, 69% of all EVs sold globally in 2024 were manufactured in China 31.
Concurrently, Chinese automakers are driving hyper-growth in emerging markets to offset intense domestic price wars. Countries within the ASEAN bloc are experiencing exponential EV adoption, effectively leapfrogging legacy automotive markets largely through the influx of affordable Chinese exports 3134. In 2025, Vietnam doubled its EV sales share to nearly 40%, overtaking the European Union average, while Thailand exceeded a 20% EV sales share 34. Markets in Latin America and the Middle East are similarly serving as vital expansion zones for Chinese brands seeking overseas profitability 3136.
Western Market Deceleration and Policy Shifts
Conversely, in the United States and Europe, the adoption curve for pure electric vehicles has softened considerably. BloombergNEF notably downgraded its short- and long-term US passenger EV adoption forecasts in 2025, projecting a reduction of 14 million cumulative EV sales by 2030 compared to prior optimistic estimates 3132.
This marked deceleration in the US is attributed to shifting regulatory environments, the phase-out or restriction of federal EV tax credits, rising electricity costs, persistent gaps in public charging infrastructure, and a fundamental lack of affordable entry-level BEV models capable of delivering the 300-mile range benchmark demanded by Western consumers 303132. European adoption has similarly slowed, constrained by the withdrawal of government subsidies in major markets like Germany and the delayed rollout of next-generation scalable platforms from domestic legacy automakers 3336.
The Hybrid Vehicle Resurgence
In response to the softening consumer appetite for pure battery electric vehicles in the West, legacy automakers have executed a strategic recalibration, pivoting capital back toward Hybrid Electric Vehicles (HEVs) 3740. By the second quarter of 2025, hybrid sales in the US surged by 36% year-over-year, accounting for 22% of all new light-duty vehicle sales, while pure BEV market share remained relatively flat or declined in specific sub-segments 4138. Brand loyalty for hybrids also reached historic highs, climbing above 46% as consumers sought to bridge the gap between internal combustion and full electrification without enduring range anxiety 38.
This hybrid resurgence has thoroughly vindicated the highly scrutinized multi-powertrain strategy of Toyota 3740. While competitors like General Motors and Ford initially committed to aggressive "all-in" EV transitions - only to face billions in divisional losses and ballooning BEV dealer inventory - Toyota maintained heavy investment in HEV technology, viewing it as a pragmatic, profitable bridge 3740.
In 2025, nearly half of all new hybrid registrations in the US were Toyota models, giving the automaker a commanding lead and a highly profitable defensive moat against pure-play BEV market volatility 38. Recognizing this market reality, competitors have been forced into strategic retreats. Ford has delayed pure BEV truck programs and scrapped its all-electric F-150 project to prioritize hybrid portfolio expansion, acknowledging the necessity of hybrids to maintain cash flow and comply with evolving emissions standards without absorbing the catastrophic margin compression associated with high-cost BEV production 37.
Global Automaker Market Capitalization Dynamics
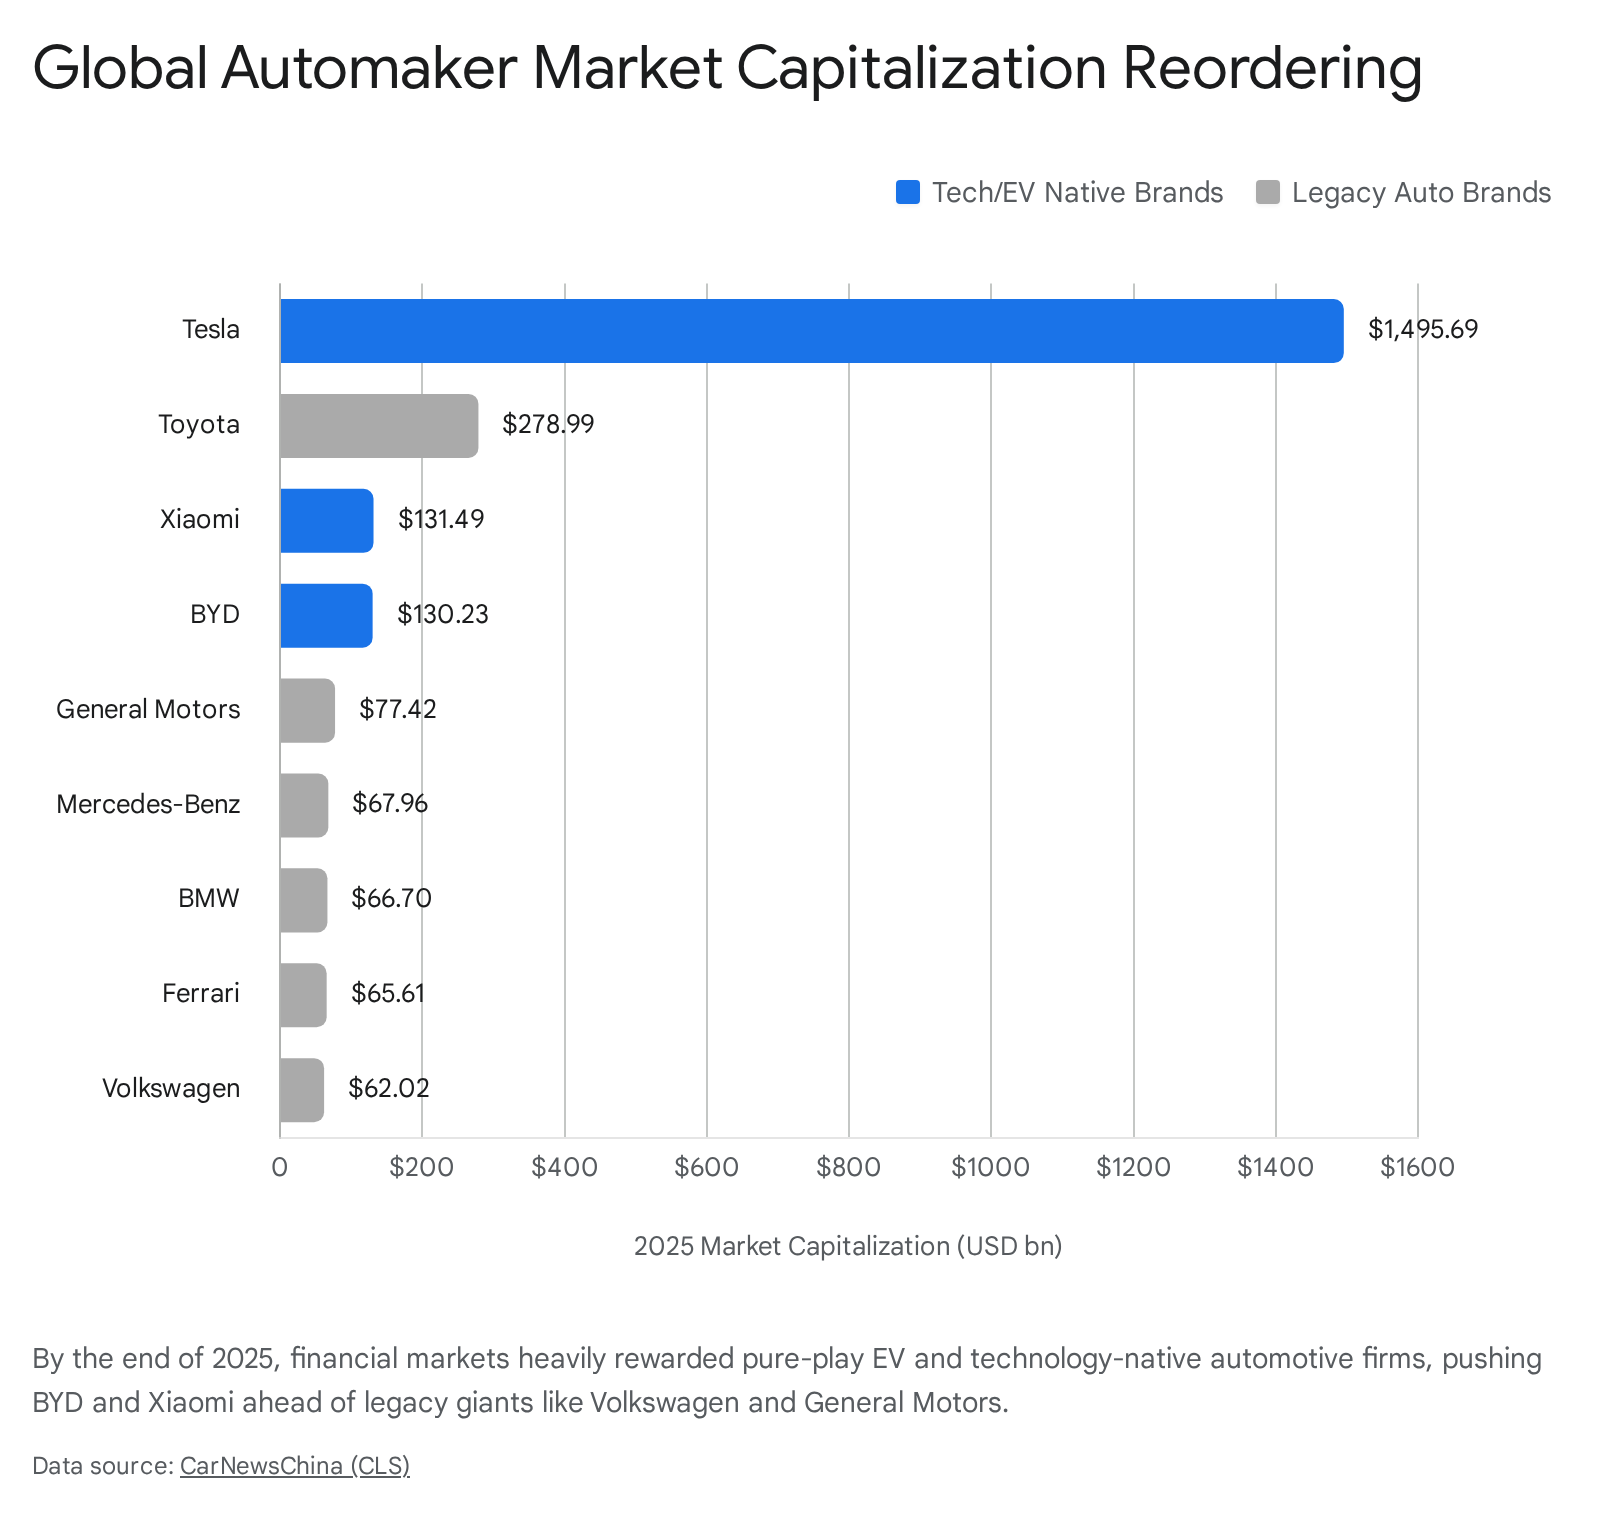
The bifurcation of regional EV adoption has dramatically reshuffled the global market capitalization and sales hierarchies of automakers. By the end of 2025, BYD maintained its position as the undisputed global leader in electrified vehicle volume, heavily leveraging its dual-threat portfolio of affordable BEVs and plug-in hybrids 3940. In late 2025, BYD celebrated the production of its 15 millionth electrified vehicle - a cumulative total exceeding the combined electrified output of Tesla and Volkswagen 41.
Tesla retains its position as the preeminent pure BEV manufacturer by volume and holds the highest market capitalization globally by a wide margin, valued at roughly $1.49 trillion at the end of 2025 4243. However, the company faces mounting pressures from an aging product lineup, the expiration of US federal tax incentives, and aggressive pricing competition from domestic Chinese brands 39. Consequently, Tesla's global market share in BEVs slipped downward in 2025, although it remains heavily protected by its sophisticated software ecosystem, brand loyalty, and proprietary charging network 3944. The market capitalization rankings at the end of 2025 underscore this industry transition: Tesla, Toyota, Xiaomi, and BYD occupied the top four global positions, leaving legacy giants like General Motors and Volkswagen further down the list and pushing Porsche out of the top ten entirely 43.
Vertical Integration and Supply Chain Disparities
Midstream Processing Dominance
The competitive advantage in the modern automotive era is increasingly defined not solely by mechanical engineering prowess or brand heritage, but by control over critical mineral supply chains and battery processing capabilities 45. In this domain, Western legacy automakers are structurally disadvantaged. The "Stages-of-Control Framework" dictates that while raw mineral extraction can occur globally in various jurisdictions, the true geopolitical leverage lies in midstream refining and processing - the highly specialized stages where raw minerals are converted into battery-grade inputs 4546.
China currently dominates this midstream processing bottleneck, refining approximately 73% of the world's cobalt, 68% of its nickel, 59% of its lithium, and between 85% and 90% of its rare earth elements, which are vital for permanent magnet electric motors 454647. Furthermore, China controls approximately 95% of battery-grade graphite processing for anodes, establishing a comprehensive monopoly over the fundamental building blocks of electrification 47.
Western automakers attempting to build independent supply chains face immense hurdles. Refining processes require highly complex hydrometallurgical techniques; rare earth processing, for instance, requires mastery of 15 to 25 sequential separation steps 46. Chinese state-owned enterprises operate with highly integrated, vertical supply chains that span from mine to magnet 46. This allows them to absorb financial losses upstream to capture profits in downstream components, creating pricing flexibility and market deterrence that Western, fragmented commercial markets cannot easily replicate 4546. This vulnerability extends even to ostensibly secure localized supply chains; for example, the US lead-acid battery industry remains critically exposed at a single chokepoint due to China's dominance in antimony refining 45.
Battery Chemistry Centralization
The supply chain disparity is most pronounced in the fastest-growing and most crucial battery chemistry for mass-market affordability: Lithium Iron Phosphate (LFP) 4849. LFP batteries do not require expensive nickel or cobalt, making them substantially cheaper and generally less prone to thermal runaway than Nickel Manganese Cobalt (NMC) alternatives 40. In 2023, LFP cells were 32% cheaper than NMC cells, a cost advantage that has driven the affordability of Chinese EVs 40.
However, the LFP supply chain is drastically more concentrated than nickel-based alternatives. In 2025, over 98% of LFP cathode material and battery cells were manufactured in China 48. Furthermore, emerging bottlenecks in the refining of phosphate rock into battery-grade purified phosphoric acid (PPA) and refined manganese sulphate - where China controls 75% and 95% of global supply, respectively - ensure that Chinese dominance will persist even as new battery chemistries like Sodium-ion or Lithium Manganese Iron Phosphate (LMFP) emerge 48.
| Supply Chain Metric | Western/Allied Nations Share | Chinese Share | Strategic Implication |
|---|---|---|---|
| LFP Cathode Material Processing | < 2% | > 98% | Absolute dependency on China for the most cost-effective battery chemistry 48. |
| Lithium Chemical Refining | ~41% | ~59% | Price volatility and exposure to targeted export controls 4547. |
| Graphite Processing (Anodes) | ~5% | ~95% | Total reliance on Chinese synthetic and natural graphite processing 47. |
| Rare Earth Separation Capacity | ~10-15% | ~85-90% | Bottlenecks for permanent magnet electric motors used in drivetrains 4546. |
In-House Manufacturing and Cost Efficiency
This supply chain asymmetry is a primary driver of the structural cost disparity between companies like BYD and legacy Western OEMs. Deep vertical integration is the cornerstone of BYD's strategic moat 405051. While traditional automakers rely on a sprawling, fragmented network of external Tier 1 and Tier 2 suppliers for core components, BYD manufactures approximately 75% of its vehicle components strictly in-house 155051.
BYD designs and fabricates its own semiconductor chips (including critical IGBTs), electric motors, power electronics, and its proprietary LFP "Blade Battery" 505152. By consolidating module assembly and bypassing external supplier markups, BYD achieves a cost structure that allows it to price vehicles significantly lower than the competition. Industry analysis suggests a BYD vehicle costs up to 15% less to produce than an equivalent Tesla model manufactured in Tesla's highly efficient Shanghai Gigafactory, and 20% to 30% below comparable Western EVs 1052. Tesla, while pioneering software vertical integration, still relies heavily on external suppliers like Panasonic, LG, and CATL for battery cell production, though it is attempting to integrate further upstream with its 4680 cell development 155152.
Capital Allocation and Research Investment Strategies
Divergent Research and Development Expenditure
The divergent strategic trajectories of automotive leaders are starkly reflected in their capital allocation and Research and Development (R&D) investments. According to the 2025 EU Industrial R&D Investment Scoreboard, R&D outlays remain highly concentrated among global leaders, with the automotive sector commanding a massive share of global innovation spending .
However, the nature and momentum of this spending vary widely. BYD has maintained an aggressive, long-term capital strategy designed to cement technological independence and scale. Between 2011 and 2024, BYD's R&D expenditure consistently exceeded its net profit, an unprecedented commitment that has accumulated over RMB 220 billion in R&D investments 5354. In the first three quarters of 2025 alone, BYD invested RMB 43.75 billion in R&D, heavily targeted at battery chemistry, integrated vehicle architectures, and energy storage systems 54. This continuous reinvestment has yielded a sprawling multi-brand strategy (including premium brands like Yangwang and Fangchengbao) and sector-leading customer repurchase rates exceeding 30% 54.
Tesla operates with notable financial discipline, focusing heavily on software engineering, artificial intelligence, and manufacturing efficiency (such as gigacasting) 1553. Tesla leverages its premium brand positioning and sophisticated digital ecosystem to maintain significantly higher per-vehicle profits than BYD, historically earning between $10,000 and $15,000 per unit compared to BYD's approximate $6,000 55. Tesla's capital allocation heavily prioritizes the advancement of its autonomous driving infrastructure and AI compute clusters over rapid vehicle model iteration 15.
Conversely, traditional OEMs are exhibiting signs of severe financial strain under the dual burden of maintaining legacy ICE portfolios while attempting to fund the multi-billion-dollar EV transition. In 2024, legacy players such as Volkswagen, General Motors, and Stellantis were among the companies showing absolute declines in R&D outlays, with Volkswagen cutting €781 million, GM dropping 7%, and Stellantis dropping 8% . This deceleration in R&D spending among incumbents, contrasting with the sustained investments by Chinese tech-native firms, underscores the difficulty legacy automakers face in reallocating capital away from historically profitable product lines.
Financial Performance and Profitability Margins
In terms of raw financial performance in the EV sector, the industry operates essentially as a duopoly of profitability. BYD and Tesla are among the few automakers consistently selling pure electric vehicles at a net profit, largely due to their disparate but effective approaches to scale, software monetization, and cost control 40. Over a trailing twelve-month period leading into late 2024, BYD generated substantial top-line revenue ($464.99 billion TTM) driven by massive global volume, while Tesla maintained higher relative margins on a smaller revenue base ($95.32 billion TTM) 56.
However, intense price competition, initiated largely by Tesla's margin-sacrificing price cuts to stimulate demand and BYD's relentless introduction of low-cost models (such as the Seagull), has severely compressed industry margins 3957. For smaller pure-play EV startups (e.g., Rivian, Lucid) and legacy OEMs attempting to scale BEV production, this price war has resulted in billions of dollars in sunk costs and negative margins per vehicle 5557. Consequently, the financial survival strategy for legacy OEMs into the late 2020s relies heavily on utilizing highly profitable internal combustion and hybrid truck and SUV sales to subsidize the protracted losses of their EV divisions until next-generation, cost-efficient scalable platforms can be deployed 3757.
Autonomous Driving Commercialization Milestones
Regulatory Setbacks and Testing Milestones
While fully autonomous Level 4 and Level 5 systems act as sustaining innovations for ride-hailing networks, their deployment remains constrained by immense technical and regulatory hurdles. The commercialization race is primarily led by specialized autonomous entities such as Alphabet's Waymo, GM-backed Cruise, and Tesla's vision-based architecture 58.
The path to commercialization has been non-linear. Waymo has demonstrated robust operational readiness, securing permits for commercial driverless rides across California, Arizona, and Texas, and servicing over 450,000 rides per week by December 2025 5859. Cruise achieved significant scale by surpassing 10 million driverless miles across multiple urban environments 58. However, Cruise also exemplifies the extreme regulatory risk inherent in AV deployment; the company faced a severe setback when its driverless permit was suspended in California in late 2023 following safety incidents 58. These setbacks underscore that scaling Level 4 autonomy requires not just technological progression, but proactive safety management, transparent regulatory compliance, and incident response frameworks 58.
Infrastructure and Network Integration
Global legislative frameworks are slowly adapting to accommodate testing and eventual deployment. In Europe, Germany permitted highly automated driving (SAE Level 3) at speeds up to 130 km/h on highways in early 2024, while countries like Austria have actively advanced autonomous shuttle trials and updated regulations to expand use cases 60. The integration of 5G infrastructure is viewed as a critical enabler for features like real-time vehicle-to-infrastructure (V2I) communication, necessary for scaling AV networks 60.
Despite technological advancements, industry forecasts project that large-scale integration of full autonomy will take longer than initially anticipated. Between 2025 and 2035, Level 2 and Level 2+ advanced driver-assistance systems will dominate the personal vehicle market due to their cost-effectiveness and regulatory readiness 29. Level 4 deployment in personal cars is expected to remain a niche offering, projected to account for only around 4% of new personal cars sold by 2035 29. The most immediate economic promise for full automation lies in specialized commercial use cases, specifically hub-to-hub autonomous trucking, which is projected to account for up to 30% of new truck sales in the US by 2035 due to the clear economic rationale of eliminating driver costs on structured highway routes 29.
Strategic Imperatives for Original Equipment Manufacturers
The theory of disruptive innovation dictates that incumbents rarely survive a true low-end disruption by fighting the disruptor head-on without fundamentally altering their business models. The global automotive landscape entering 2026 validates this framework. Legacy Western automakers are strategically retreating upmarket or leaning heavily into hybrid powertrain configurations as a defensive financial moat, voluntarily ceding the low-margin, high-volume pure EV segments to vertically integrated Chinese manufacturers like BYD and Geely 103740.
Simultaneously, the transition to the Software-Defined Vehicle marks the definitive end of mechanical hardware as the primary vehicle differentiator. Tech-native companies that organize their engineering cycles around centralized computing and software agility possess a structural advantage over legacy OEMs hampered by fragmented E/E architectures and historical reliance on outsourced Tier 1 suppliers 2224. As the technological battleground shifts from proving theoretical concepts to executing mass production and cost-saving refinement, survival will demand unprecedented organizational transformation from traditional automakers .
The integration of autonomous driving capabilities will act as a force multiplier for those platforms possessing the most robust software architectures, though it remains a sustaining innovation likely to benefit existing ride-hailing incumbents rather than upend them 16. Ultimately, the global automotive sector is fracturing into distinct regional and technological spheres of influence. Western OEMs must rely on protectionist industrial policies and the profitability of hybrid vehicles to buy time, while Chinese tech-native manufacturers leverage absolute midstream supply chain dominance and rapid software iteration to fundamentally reshape the global mass market.