Impact of trading costs, slippage, and taxes on swing trading returns
Introduction
Retail participation in financial markets has expanded significantly over the past decade, driven by technological democratization, the advent of zero-commission brokerage models, and shifting demographic behaviors. By 2025, individual investors accounted for roughly 20% to 25% of total United States equity trading volume, with retail inflows reaching a record $308 billion 1. Lower-income individuals have increased their investing activity fivefold over the last decade, and market participation among younger demographics has surged, with 37% of 25-year-olds holding investment accounts in 2025 1. However, despite this massive influx of capital and increased market access, the success rate for active retail traders remains exceedingly low. Empirical data indicates that only about 10% of retail swing traders generate consistent profits over a multi-year horizon, while the vast majority ultimately fail to achieve profitability 23. High attrition rates are a systemic feature of active trading; approximately 40% of short-term traders exit the market within a month, and only 13% remain after three years 4.
The disparity between theoretical trading strategies and realized portfolio returns is heavily influenced by structural market frictions. While gross returns may appear attractive in historical backtests or theoretical models, net returns are systematically degraded by a combination of implicit execution costs, financing rates, short-selling borrow fees, and state taxation. Swing trading, which typically involves holding leveraged positions overnight for periods ranging from several days to several weeks 56, exposes market participants to a unique confluence of these costs. Unlike long-term passive investing, which minimizes transaction frequency, the average active retail investor turns over approximately 8.8% of their portfolio monthly 5. This elevated turnover permanently amplifies the drag of transaction costs and slippage.
Furthermore, retail investor beliefs and behaviors often run counter to institutional fundamentals. Research utilizing data from 1950 to the present indicates that shifts in market valuation ratios are heavily driven by expected changes in investor sentiment rather than changing expectations of dividend or earnings growth 8. While sophisticated investors tend to operate countercyclically, retail traders frequently exhibit extrapolative behaviors, buying after prolonged rallies and reacting emotionally to volatility 86. When behavioral friction is combined with structural market costs, the retail trader faces a formidable barrier to achieving sustained alpha. This report examines the quantitative impact of trading costs, slippage, overnight gap risk, and tax classifications on swing-trading returns, analyzing execution quality metrics, regulatory shifts, margin financing rates, and tax authority frameworks to quantify the erosion of retail capital.
Implicit Execution Costs and Order Routing Frictions
The widespread elimination of explicit retail trading commissions in 2019 represented a fundamental shift in brokerage revenue models 78. Brokers transitioned from charging direct per-trade fees to generating revenue through alternative, often opaque streams, most notably Payment for Order Flow (PFOF). While retail investors generally perceive trades as frictionless and "free," the actual cost of execution is embedded in the bid-ask spread and the proprietary routing logic of the brokerage.
Payment for Order Flow Mechanics
Payment for Order Flow involves wholesale market makers compensating retail brokers for the exclusive right to execute their clients' orders. This mechanism allows market makers to trade profitably against retail flow, which is generally considered less informed and less toxic than institutional order flow 913. However, PFOF introduces an inherent structural conflict of interest: brokers are financially incentivized to route customer orders to the wholesaler offering the highest rebate rather than the market maker or public venue providing the best execution price or the narrowest spread for the client 914.
The quantitative impact of PFOF on execution quality is substantial. A comprehensive assessment by the Dutch Authority for the Financial Markets (AFM) evaluated retail execution quality across PFOF venues, non-PFOF venues, and liquid reference markets such as Euronext Amsterdam 10. The analysis utilized a comparative pricing model based on post-trade data to determine price deterioration. The findings demonstrated that PFOF venues structurally provided inferior execution prices for retail investors compared to transactions occurring on other trading venues simultaneously.
For one PFOF trading venue examined by the AFM, 72.0% of executions were worse than those on the reference market, resulting in retail clients paying an average of 4.8 basis points (bps) extra per transaction 10. A second PFOF venue performed even poorer, executing 83.3% of trades at a worse price, costing clients an average of 11.5 bps extra per transaction 10. Conversely, a non-PFOF venue that allowed multiple market makers to compete for order flow aligned with reference markets in over 74% of cases, with an average price deterioration of only 0.8 bps 10.
Similar studies conducted by the Spanish regulatory authority (CNMV) corroborated these findings, indicating that 86.4% of trades routed to Single Market Maker (SMM) venues underperformed, resulting in a 14 to 16 bps price deterioration 11. When applied to a standard €3,000 retail transaction, a deterioration of 11.5 bps translates to an immediate, hidden cost of €3.46 per trade 1011. For an active swing trader executing hundreds of transactions annually, this implicit spread cost rapidly accumulates, creating a continuous drag that severely erodes the underlying strategy's statistical edge.
Cross-Asset Frictions in Options Trading
While regulatory scrutiny is frequently directed toward equity market structure, the majority of PFOF revenue is generated in the options market. Approximately two-thirds of all PFOF originates from options trading, where PFOF rates paid to brokers are substantially higher than those paid for equities 12. This disparity creates a system where broker revenue increases dramatically when retail clients trade options rather than underlying shares, leading to a potential incentive misalignment where brokers may subtly encourage higher-risk, higher-turnover derivative trading 12.
Options trading inherently carries wider bid-ask spreads and lower liquidity relative to large-cap equities, exacerbating the cost of execution. Because retail swing traders frequently utilize options to achieve leverage or hedge positions without relying on margin financing, the inflated PFOF rebates in the options market directly translate into wider effective spreads for the retail participant. The spread acts as the market maker's compensation for providing liquidity and assuming risk, and it is paid on every round-trip transaction 13. The wider the spread and the more frequently the trader rotates their portfolio, the faster the trader's capital is consumed by the market maker's capture rate 13.
Regulatory Divergence in Market Structure
In response to the documented conflicts of interest inherent in PFOF and Single Market Maker venues, global regulatory bodies have adopted highly divergent approaches, ranging from total prohibitions to enhanced disclosure frameworks. These regulatory environments dictate the execution quality a swing trader can expect based on their geographical jurisdiction.
European Prohibitions and the MTF Workaround
The United Kingdom's Financial Services Authority (FSA) established an early precedent by effectively banning PFOF in 2012, arguing that the practice was incompatible with a broker's duty of best execution 919. Following the implementation of the ban, the proportion of retail-sized trades executing at the best quoted prices on the London Stock Exchange increased dramatically from 65% in 2010 to over 90% by 2014 914. Furthermore, quoted spreads for large-cap stocks narrowed significantly, dropping from 6.8 bps to 4.6 bps, while spreads on trades executed at the midpoint fell by more than 40% 9. The removal of PFOF forced liquidity providers to compete openly on displayed price rather than hidden rebates, transitioning the UK retail equity market into a highly efficient, utility-like service where the displayed touch price is typically the realized execution price 9.
Following the empirical success of the UK prohibition, the European Union revised its MiFID/MiFIR framework to implement a bloc-wide ban on PFOF, scheduled to take full effect on June 30, 2026 1421. A temporary exemption was granted strictly to Germany, allowing domestic brokers to continue receiving PFOF for trades executed by German residents until the 2026 deadline 1421. This exemption provided Europe's largest neobrokers, such as Trade Republic and Scalable Capital, a transitional period to restructure their revenue models 14.
However, the regulatory ban has catalyzed the development of alternative market structures that may inadvertently concentrate order flow further. To circumvent the impending loss of external PFOF revenue, major European neobrokers have acquired licenses to operate their own proprietary trading venues. In 2026, Trade Republic secured a license from Germany's BaFin to operate a Multilateral Trading Facility (MTF), allowing the broker to match orders internally and potentially act as a market maker for its own clients 1421. Similarly, Scalable Capital established the European Investor Exchange (EIX), a closed-loop system where the broker operates the venue and assigns a specific market maker per instrument 1115.
Market analysts and independent studies warn that this pivot to internal "de facto SMM" models may exacerbate the original conflict of interest. Because the broker now fully captures the trading economics within its proprietary venue, the financial incentive to route trades internally is vastly stronger than the previous incentive to route to an external PFOF provider 1121. Consequently, retail swing traders operating within the European framework may face persistent execution friction as competition for their order flow is siloed within individual brokerage ecosystems rather than broadcast to lit public exchanges.
United States Regulatory Withdrawals and Rule 605
The regulatory trajectory in the United States has sharply diverged from the European model. In December 2022, the Securities and Exchange Commission (SEC) proposed a sweeping suite of market structure reforms designed to overhaul retail execution. This included the Order Competition Rule (Rule 615), which aimed to mandate that "segmented" retail orders be exposed to competitive, open auctions before they could be internalized by restricted wholesale market makers 162417. Simultaneously, the SEC proposed Regulation Best Execution (Rules 1100, 1101, and 1102), which sought to codify a stringent federal standard requiring broker-dealers to achieve the most favorable price under prevailing conditions, heavily scrutinizing conflicted transactions like PFOF and affiliate routing 181920.
However, these structural overhauls faced intense industry opposition. In June 2025, the SEC formally withdrew both the Order Competition Rule and Regulation Best Execution, electing not to proceed with the final rules 212223. Consequently, the U.S. market structure will continue to permit widespread PFOF and the dark internalization of retail flow without mandatory competitive auctions 2122.
Instead of prohibiting PFOF, the SEC advanced an agenda of enhanced transparency by adopting comprehensive amendments to Rule 605 of Regulation NMS 242526. With a compliance date set for December 2025, the modernized Rule 605 significantly expands the scope of entities required to publish execution quality metrics, bringing larger broker-dealers (those carrying 100,000 or more customer accounts) into the reporting framework 26. The new rule requires more granular, time-based reporting of effective spreads, size improvement, and relative fill rates for various order types, including non-marketable limit orders 2426.
The underlying thesis of the Rule 605 amendments is that sunlight acts as a regulatory mechanism; by providing investors and registered investment advisors (RIAs) with sharper tools to evaluate execution quality, competition among brokers will naturally compress effective spreads 25. Independent analysis utilizing the Herfindahl-Hirschman index (HHI) for dealer concentration supports this theory, demonstrating a strong positive correlation between dealer competition and tighter quoted and effective spreads for retail flow 25. Nonetheless, until the new reporting regimes catalyze a shift in routing behaviors, U.S. swing traders remain subject to the execution frictions inherent in wholesale internalization.
Execution Slippage Dynamics
Beyond the baseline structural spread costs dictated by brokerage routing, active swing traders face immediate execution risks associated with changing market volatility and liquidity dynamics. These risks are broadly categorized into intraday slippage and liquidity traps.
The Mechanics and Measurement of Slippage
Slippage is strictly defined as the quantitative difference between the expected price of an asset at the time an order is initiated and the actual price at which the trade executes 2736. While it is a natural component of all financial markets, slippage functions as a silent, compounding friction that steadily erodes the profitability of high-turnover trading strategies.
Slippage scales non-linearly with both trade size and market volatility 3637. Institutional execution models demonstrate that the friction of market impact follows a square-root law: doubling the size of a trade does not merely double the total slippage cost, but rather increases the slippage magnitude by approximately 1.41 times 37. For retail traders, even though absolute order sizes are smaller, slippage becomes particularly acute in low-liquidity environments or in secondary and tertiary market caps where the order book lacks depth 3728. If a swing trader utilizes a market order to enter a position in a thinly traded stock, the order must sweep through multiple price levels to find sufficient counterparty volume, filling at progressively worse prices 2839.
Volatility Regimes and Order Types
The severity of slippage is highly dependent on the prevailing volatility regime. During periods of high volatility triggered by macroeconomic data releases, central bank announcements, or corporate earnings, market makers systematically widen their spreads and withdraw resting quotes to protect their inventory from adverse selection 3739. In the seconds following major releases, such as the Non-Farm Payroll report, the bid-ask spread on highly liquid instruments can widen by a factor of ten to twenty, guaranteeing severe slippage for any market orders executed in the immediate aftermath 39.
Swing traders attempt to mitigate this friction by utilizing limit orders, which allow the trader to explicitly define the maximum acceptable purchase price or minimum acceptable sale price 3639. While limit orders protect against price deterioration, they introduce a secondary friction: execution risk. In fast-moving, directional markets, a limit order may simply remain unfilled as the price moves aggressively away from the specified level. If a trader utilizes a stop-limit order for downside protection, a rapid market dislocation may gap past the limit price, leaving the trader fully exposed to an unmitigated loss 3639. Consequently, swing traders are forced to constantly calibrate the trade-off between guaranteed execution at inferior prices and absolute price control with the risk of non-execution.
| Volatility/Liquidity Regime | Prevailing Market Condition | Optimal Order Execution Strategy | Primary Swing Trading Risk |
|---|---|---|---|
| Normal Volatility / High Liquidity | Standard mid-day trading hours in primary market caps. | Limit orders at technical levels; market orders acceptable for immediate entry. | Minimal; baseline spread costs apply. |
| Low Volatility / Low Liquidity | Holiday periods, after-hours trading, overnight sessions. | Strictly limit orders; wider stop-losses to avoid premature triggering. | Elevated overnight gap risk; thin order books. |
| High Volatility / Low Liquidity | Macroeconomic news releases, flash crashes, earnings shocks. | Avoid trading during immediate catalyst window; utilize guaranteed stop-losses if available. | Severe slippage; stop-loss orders failing to execute near target prices. |
| Table 1: Optimal execution strategies and associated frictions across varying market volatility and liquidity regimes 3739. |
Overnight Gap Risk and Portfolio Exposure
While day traders mandate the closing of all positions prior to the market's daily cessation to completely eliminate overnight exposure, the fundamental premise of swing trading necessitates holding assets across multiple trading sessions 6. This temporal requirement exposes the swing trader to overnight gap risk, which acts as a structural, often unmanageable friction.
The Phenomenon of Price Gaps
An overnight gap occurs when a financial instrument opens at a significantly different price than its previous closing level 2728. Because market-moving information - such as corporate earnings reports, merger and acquisition announcements, or geopolitical developments - frequently emerges outside of standard trading hours, the market attempts to instantaneously price in the new fundamentals at the subsequent open 28. This results in a physical space on a price chart where no trading occurred, representing a sudden, violent shift in supply and demand sentiment 2930.
For swing traders, overnight gaps represent severe, instantaneous slippage events. The primary danger of gap risk is its ability to entirely bypass standard risk management protocols. If a swing trader purchases an equity at $50 and strictly defines their maximum risk by placing a stop-loss order at $48, they assume a controlled loss profile. However, if the company releases a catastrophic earnings report after hours, the stock may gap down and open for trading the following morning at $40 31. The stop-loss is triggered at the open, filling the market order at $40, resulting in a capital loss that vastly exceeds the trader's predefined, mathematically calculated risk parameters 2831.
Volatility Correlation and Gap Strategy Efficacy
Academic research indicates that overnight price gaps are not merely random market noise but rather significant structural events that dictate near-term volatility. A comprehensive 2025 study analyzing high-frequency, five-minute data across the Dow Jones Industrial Average (DJIA), NASDAQ, and Germany's DAX investigated the mechanics of weekend price gaps spanning a ten-year period 32. The researchers sought to determine whether prices naturally reverted to fill the gap or if the gap indicated a sustained volatility shift.
The study's findings challenged the common retail trading heuristic that "gaps always fill" in the immediate term. While short-distance gaps showed varied behaviors, medium-to-large distance gaps demonstrated significant directional patterns that did not favor immediate mean reversion 32. More critically, the research established a strong correlation between the magnitude of the gap and subsequent elevated volatility 32. In both the DJIA and the NASDAQ, larger gap sizes acted as leading indicators of severe near-term price fluctuations, increasing the probability that post-gap price action would violently trigger both stop-loss and take-profit levels 32.
To mitigate the uncontrolled friction of gap risk, swing traders are forced to adapt their fundamental strategies. Professional risk mitigation requires drastically reducing position sizing to ensure that a severe gap does not irreparably damage the portfolio's equity curve 2931. Furthermore, traders often flatten positions prior to known binary events, such as earnings announcements, sacrificing potential directional profit to avoid the unquantifiable risk of an adverse overnight dislocation 2931.
The Cost of Capital: Margin Financing and Leverage
Swing traders routinely utilize leverage to amplify absolute returns on short-term price movements, recognizing that an unleveraged 3% swing in an underlying equity provides minimal capital growth. However, the cost of acquiring this capital - expressed through margin interest rates - acts as a persistent, compounding drag on net performance.
Retail Margin Interest Rate Disparities
When investors trade on margin, they borrow capital from their brokerage firm, using their existing portfolio equity as collateral. The interest charged on these overnight margin debit balances accrues daily and is posted monthly, acting as a constant liability regardless of the underlying asset's price performance 3334. Following global central bank tightening cycles, baseline borrowing costs have structurally risen, but retail brokerages apply wildly disparate markups to their client base, transforming margin financing from a standard utility into a major differentiating friction.
A comprehensive review of margin rates across major retail brokerages in 2025 demonstrates a severe lack of industry uniformity. Rates are heavily dependent on the broker's specific business model - differentiating between low-cost volume aggregators and traditional asset-gathering institutions - as well as the size of the individual client's debit balance 3435.
| Brokerage Platform | Base Margin Rate (2025) | Best Available Tier Rate | Primary Business Model Focus |
|---|---|---|---|
| Public.com | 4.90% | 3.95% (>$50M balances) | Low-cost volume focus; lowest industry base rate 3435. |
| Robinhood | 5.75% | 5.25% (>$100K balances) | Subscription-based (requires paid 'Gold' tier for best rates) 3536. |
| Interactive Brokers (Pro) | 5.83% | ~4.14% (>$1M balances) | Tiered pricing targeting active, professional traders 3536. |
| Charles Schwab | 10.00% | 7.50% (>$1M balances) | Traditional asset-gathering model 3335. |
| Fidelity | 10.575% | 7.50% (>$1M balances) | Tiered model requiring heavy asset consolidation 3536. |
| Firstrade / Vanguard | ~12.00% | 10.00% (High Tier) | Highest base rates among major retail platforms 343537. |
| Table 2: Comparison of retail margin financing rates across major brokerages in 2025, demonstrating the extreme variance in capital costs 3334353637. |
The mathematical impact of these financing rate disparities on a swing trader's bottom line is substantial. Consider a retail trader carrying a modest $50,000 margin debit balance throughout the year. An investor utilizing a low-cost broker charging a 4.9% rate will incur approximately $2,450 in annual interest expenses 3435. Conversely, an investor carrying the exact same balance at a traditional broker charging a 12% base rate will incur $6,000 in annual interest 35.
This $3,550 discrepancy represents real capital destruction. To simply break even against the financing costs of the traditional broker, the trader's leveraged positions must generate a gross alpha exceeding 12% annually. If the trader is utilizing leverage to capture small, frequent swing trades, the daily accrual of these interest rates severely raises the required win rate and profit-factor necessary for the strategy to remain viable.
The Spread Betting Alternative in the United Kingdom
In jurisdictions like the United Kingdom, retail traders frequently utilize financial spread betting as an alternative to traditional margin financing and physical share dealing. Spread betting is a leveraged derivative product where the trader speculates on a pound-per-point movement in an asset's price rather than purchasing the underlying physical security 3839.
Because the trader never takes ownership of the asset, spread betting bypasses traditional equity financing mechanics. The primary allure of this structure is its highly favorable tax treatment; spread betting incurs zero UK stamp duty (which typically levies a 0.5% fee on physical share purchases) and is entirely exempt from Capital Gains Tax (CGT) 383951.
However, the structural frictions are merely transferred rather than eliminated. Spread betting providers act as direct market makers, embedding their execution costs and profit margins directly into a widened bid-ask spread 3952. Consequently, the execution slippage on a spread bet is structurally higher than trading the underlying equity on a lit exchange 52. Furthermore, positions held overnight incur proprietary financing charges determined by the provider 3851. For a swing trader holding a position for weeks or months, the daily accumulation of these overnight funding charges can rapidly outweigh the initial savings gained from avoiding stamp duty and capital gains tax, rendering the strategy less efficient for intermediate-term durations 51.
The Alpha Erosion of Short-Selling Borrow Fees
A core component of many advanced swing trading strategies involves attempting to capitalize on mean reversion or structural overvaluation by short selling equities. Academic asset pricing models frequently identify historical anomalies where specific cohorts of stocks drastically underperform. However, short selling introduces a unique, often prohibitive friction: the stock borrow fee.
The Mechanics of the Stock Borrow Fee
To execute a short sale, a trader must borrow the underlying shares from a third party - typically another investor or an institutional lending pool - via their broker. The lender must be compensated for the risk and the temporary loss of control over the asset, resulting in a stock borrow fee that is expressed as an annualized percentage and calculated daily against the position's value 4041.
For highly liquid, large-cap equities, the borrow fee is often negligible, historically hovering around 30 to 40 basis points per year 41. However, heavily shorted, overvalued stocks - the exact equities that swing traders wish to target - become "hard-to-borrow." When the demand to short an asset outpaces the available supply of lendable shares, the borrow fee spikes exponentially.
Empirical Destruction of Anomaly Profits
Academic research identifies the stock borrow fee as the "hidden friction" that almost entirely explains why theoretical market anomalies fail to generate net profits in real-world retail trading environments 4041. While sophisticated investors can identify overpriced stocks using options data or fundamental divergence, executing the trade routinely incurs borrow fees that neutralize the alpha 40.
A comprehensive 2025 study analyzing the U.S. securities lending market documented a dramatic explosion in these borrow costs over the past two decades. In 2001, fewer than 1% of stocks carried extreme borrow fees; by 2025, over 100 stocks per day exhibited fees exceeding 100% annually 55. The researchers constructed theoretical portfolios based on borrowing costs and discovered that high-borrow-cost portfolios generated an annualized CAPM alpha of -81.4% 55. This indicates that investors holding these hard-to-borrow securities lost approximately 81% of their value annually on a risk-adjusted basis, an erosion that almost perfectly matched the cost of the borrowing friction itself 55.
Similarly, an exhaustive meta-analysis of 162 asset pricing anomalies found that while long-short anomaly portfolios generated an attractive average gross return of 0.14% per month, adjusting for stock borrow fees reduced the net return to an insignificant -0.01% per month 42. For the retail swing trader, the implication is absolute: while heavily shorted, fundamentally overvalued stocks are easily identifiable, the duration required for the market price to correct is often outpaced by the daily accrual of exorbitant borrow fees, effectively acting as a massive negative dividend that consumes the trade's profit margin 4041.
Taxation Frameworks and Return Drag
Assuming a swing trader successfully navigates implicit execution spreads, intraday slippage, gap risks, margin interest, and borrow fees to generate a gross profit, the final and most substantial determinant of net return is taxation. The classification of trading income by tax authorities severely alters the post-tax mathematical expectancy of a trading strategy.
Capital Gains versus Business Income
In many global jurisdictions, tax authorities rigidly differentiate between passive investment capital gains and active business trading income. In Canada, the Canada Revenue Agency (CRA) provides a rigorous framework governing this distinction, which serves as a prime example of global tax friction. Profits derived from long-term, passive investing are treated as capital gains, which benefit from a highly favorable 50% inclusion rate - meaning only half of the realized profit is added to the investor's taxable income and subjected to their marginal tax rate 55758.
Conversely, day trading is universally classified by the CRA as an active business endeavor. Therefore, 100% of the profits generated from day trading are taxed as business income, entirely eliminating the favorable capital gains inclusion rate 557. Swing trading, however, occupies a perilous regulatory gray area. The CRA evaluates the taxpayer's aggregate behavior based on multifactor criteria established in Bulletin IT-479R 59.
If a taxpayer's swing trading becomes frequent in volume, relies heavily on leveraged strategies (such as margin accounts), features short holding periods, utilizes sophisticated trading software, or constitutes a primary source of the individual's income, the CRA is highly likely to reclassify the activity as an organized business operation rather than passive investing 557. When trading profits are reclassified as business income, the retail trader's effective tax burden essentially doubles. While business classification does allow the trader to deduct reasonable operational expenses - such as trading platform fees, real-time data subscriptions, and margin interest - the complete loss of the 50% capital gains inclusion rate represents a massive, unrecoverable reduction in compounding capital 5758.
Risks within Tax-Advantaged Accounts
To shield returns from this severe taxation drag, retail investors frequently attempt to utilize tax-advantaged vehicles. In Canada, the Tax-Free Savings Account (TFSA) allows for entirely tax-free investment growth and withdrawals, making it an incredibly potent tool for compounding wealth 43.
However, regulatory authorities strictly monitor these sheltered accounts for activities resembling a professional trading business. If a taxpayer conducts high-frequency, leveraged swing trading within a TFSA, the CRA possesses the authority to audit the account and classify the accumulated profits as taxable business income 5943. The consequences of such an audit are catastrophic for long-term wealth generation: not only are the historical profits taxed fully as business income - with potential interest and financial penalties applied retroactively - but the taxpayer permanently loses the contribution room associated with the taxed withdrawals, destroying the account's future sheltering utility 43. Therefore, retail traders attempting to maximize post-tax returns by trading aggressively in sheltered accounts face severe existential tax risks if their volume or methodology exceeds loosely defined regulatory thresholds.
Cumulative Impact on Portfolio Returns
When evaluated in isolation, a 5-basis-point execution slippage cost, an 8% margin financing rate, or a marginal shift in tax inclusion rates may appear manageable to an active trader. However, the true danger of swing trading frictions lies in their continuous, cumulative, and compounding effect over time.
Behavioral economists have long noted that average retail investors already significantly underperform broad market benchmarks due to emotional timing and lack of discipline. DALBAR's Quantitative Analysis of Investor Behavior (QAIB) report estimates that over the past decade, the average equity fund investor earned roughly 9.8% annually, compared to an annualized return of approximately 13% for the S&P 500 benchmark 6. This baseline underperformance is driven almost entirely by behavioral friction - buying after rallies and capitulating during volatility 6. When structural, mathematical trading costs are layered on top of this behavioral baseline, the statistical likelihood of long-term retail outperformance effectively collapses.
Simulation of Compounding Friction
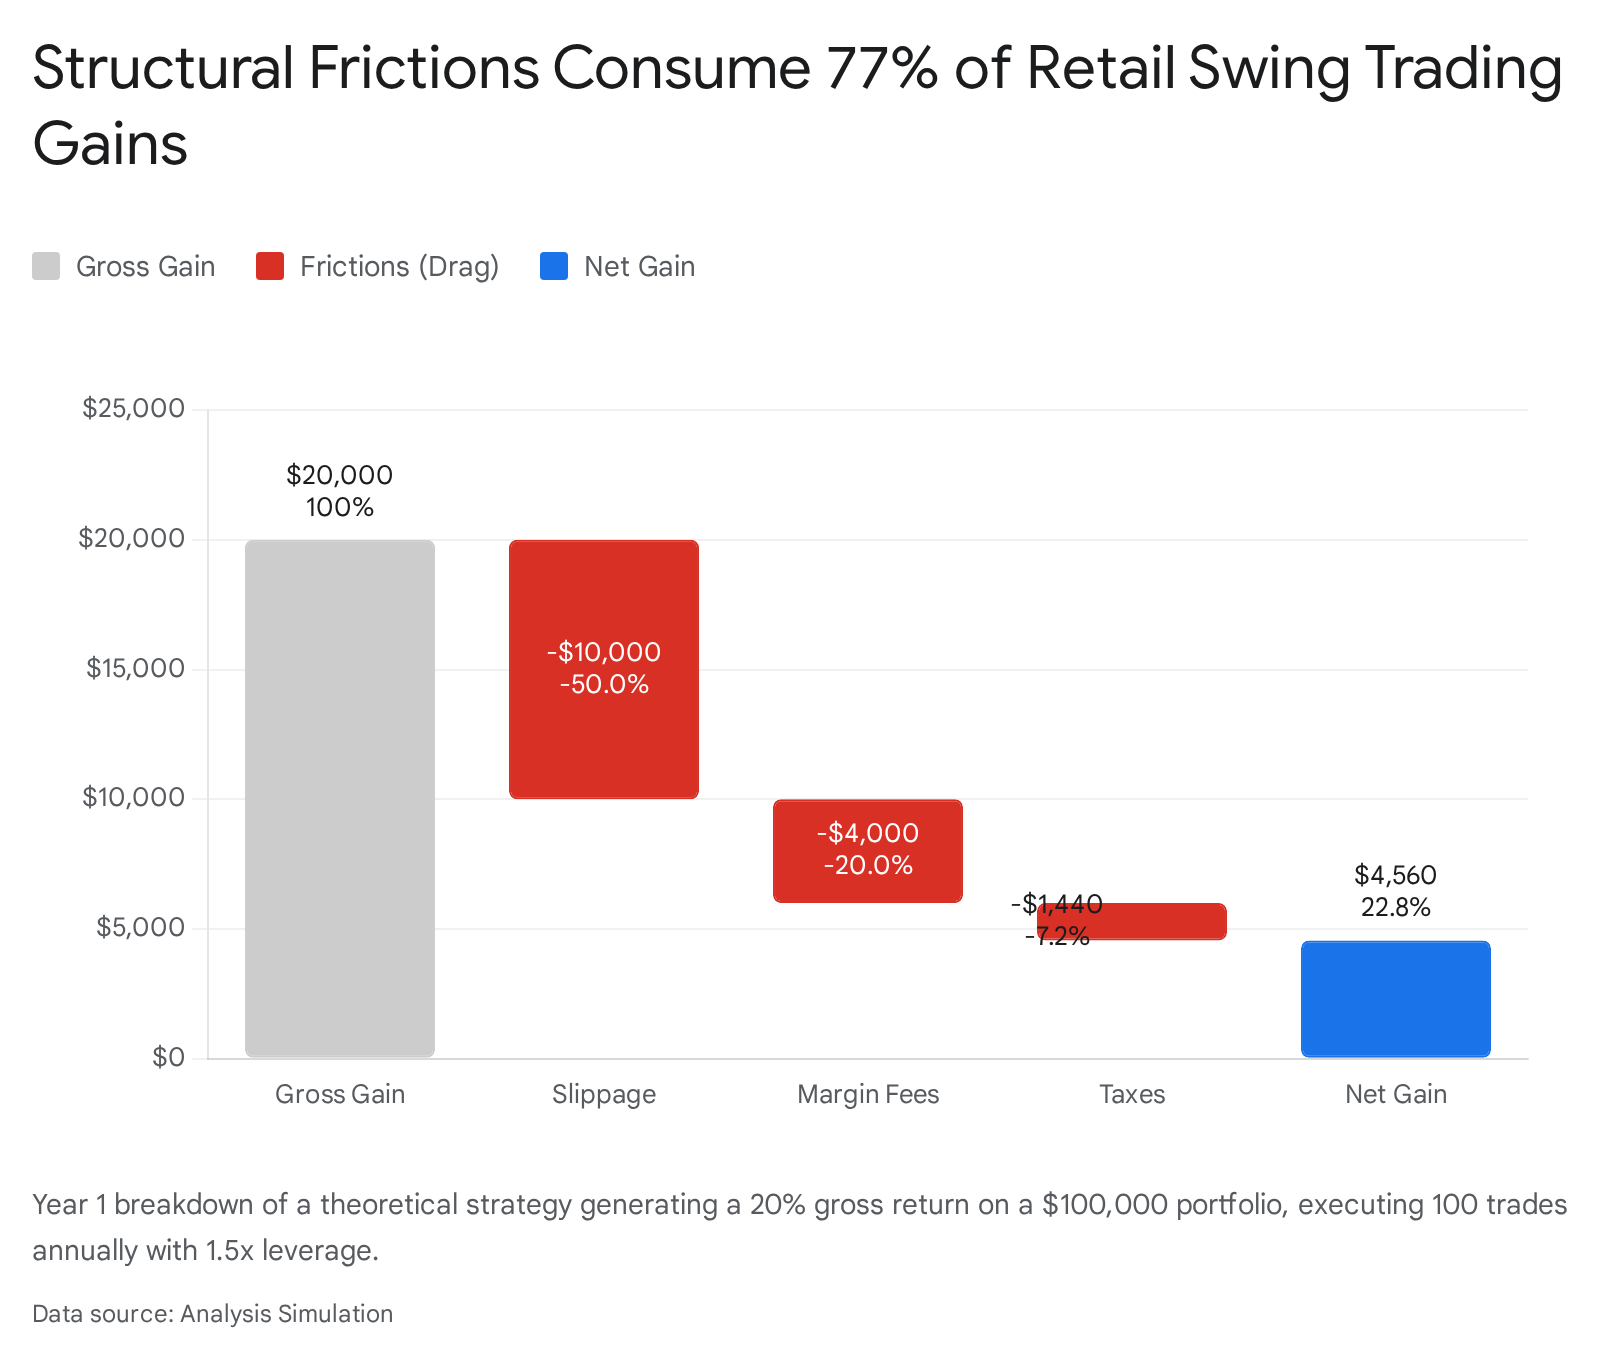
To accurately quantify the aggregate erosion caused by these structural costs, consider a theoretical swing trading strategy operating on a baseline $100,000 initial capital portfolio. The underlying strategy is highly successful, generating a 20% gross theoretical return annually. To achieve this, the trader executes 100 round-trip trades per year, utilizes a moderate 1.5x margin leverage to amplify returns, pays an 8% annualized margin interest rate, experiences a conservative 10 bps of slippage and spread cost per trade, and is ultimately subject to a 24% short-term capital gains tax on net profits .
In the first year of operation, the strategy successfully yields a gross gain of $20,000. However, the frictional components systematically dismantle this return : 1. Slippage and Spread: Executing 100 leveraged trades subject to 10 bps of slippage costs the portfolio $10,000, instantly consuming 50.0% of the total gross gain. 2. Overnight Margin Fees: Maintaining the 1.5x leverage ratio ($50,000 borrowed capital) at an 8% APR costs $4,000, consuming an additional 20.0% of the gross gain. 3. Taxation: The remaining pre-tax net gain of $6,000 is subjected to the 24% tax rate, removing a further $1,440.
The final, realized net gain for the year is merely $4,560. A staggering 77.2% of the total trading alpha is lost to the structural mechanics of market execution, financing, and state taxation .
When this dynamic is extended over a multi-year compounding horizon, the terminal wealth disparity becomes exponential, illustrating why so few retail traders achieve long-term wealth through active trading.
| Compounding Horizon | Gross Theoretical Portfolio Value | Net Portfolio Value (After Slippage, Margin Fees, Tax) | Net Portfolio Value (Tax-Exempt Spread Betting Equivalent) |
|---|---|---|---|
| Year 1 | $120,000 | $104,560 | $101,000 |
| Year 5 | $248,832 | $124,976 | $105,101 |
| Year 10 | $619,174 | $156,191 | $110,462 |
| Table 3: Simulated compounding outcomes of an initial $100,000 portfolio generating a 20% annual gross alpha, mapped against standard margin accounts and tax-free spread betting alternative accounts over a decade . Note: The spread betting simulation assumes zero taxation but applies 1.5x higher execution slippage to account for embedded provider spreads. |
The data indicates that over a ten-year timeframe, a trader capable of generating a remarkably consistent 20% gross annual return would theoretically compound their initial capital to $619,174. In reality, once subjected to standard retail frictions and taxes, the portfolio only reaches $156,191 . Even utilizing a tax-exempt derivative structure like UK spread betting fails to salvage the returns, as the widened bid-ask spreads embedded by the provider act as an even more aggressive daily drag on the portfolio, resulting in a 10-year terminal value of just $110,462 .
Conclusion
Retail swing trading exists within a complex market structure fundamentally designed to extract basis points through varied, often opaque mechanisms. While zero-commission brokerage models and mobile platforms democratized market access and spurred record retail volume, they simultaneously obscured the true costs of execution by routing retail flow to wholesale internalizers and Single Market Maker venues. This infrastructure frequently results in structurally inferior pricing compared to lit, competitive exchanges.
Furthermore, intraday slippage and overnight gap risks severely degrade entry and exit optimization, invalidating risk management heuristics and forcing traders to assume unquantifiable tail risks. The cost of capital serves as another massive hurdle; exorbitant and disparate margin interest rates, coupled with astronomical short-selling borrow fees, actively penalize the utilization of leverage and short-selling strategies, effectively neutralizing academic market anomalies in practice.
Finally, when capital gains are inevitably subjected to state taxation - or worse, audited and reclassified as fully taxable business income with the loss of inclusion rate benefits - the retail trader's net mathematical edge is severely diminished. Ultimately, the data demonstrates that for a retail swing trader to achieve meaningful, compounding wealth, their trading system cannot merely possess a slight statistical edge over the broader market. It must generate a gross alpha large enough to overcome an infrastructural and regulatory drag that routinely consumes over 75% of initial trading profits.