What Is MACD and What Does It Actually Measure
The Moving Average Convergence Divergence (MACD) is a trend-following momentum oscillator that measures the velocity and acceleration of a financial asset's price movement. By tracking the expanding and contracting distance between two moving averages, it helps investors visualize whether market momentum is strengthening or weakening. Rather than predicting absolute future prices, MACD reveals the underlying energy and structural health of an active market trend.
Origins and Fundamental Purpose
To understand MACD, it is helpful to look past the intersecting lines on a trading screen and examine the mathematical reality of what the tool actually measures. Developed by Gerald Appel in 1977, the MACD indicator was originally designed to evaluate the strength, direction, momentum, and duration of a prevailing trend in the stock market 12. In the decades since its inception, it has become a foundational metric within technical analysis, utilized across equities, commodities, forex, and cryptocurrency markets 34.
The MACD does not measure absolute price. Instead, it measures the rate of change in price. If one imagines a stock's price history as a moving vehicle, the basic price chart simply plots the vehicle's location on a map over time. The MACD, conversely, acts as the vehicle's internal speedometer and accelerometer 5. It indicates how fast the vehicle is traveling and whether the driver is currently pressing the accelerator pedal or easing off the gas. An asset might still be climbing in price, but if the MACD indicator begins to fall, it reveals a hidden deceleration - the upward momentum is fading long before the price chart reflects a downward turn 56.
The Mathematical Mechanics of Momentum
The standard MACD indicator is built upon a foundation of exponential moving averages (EMAs). Unlike a simple moving average, which assigns equal weight to every data point in a given time series, an exponential moving average assigns progressively greater mathematical weight to the most recent price data 789. This exponential weighting makes the EMA significantly more responsive to sudden shifts in market sentiment, reducing the inherent lag that plagues simple averages 1.
A traditional MACD configuration relies on three specific time parameters, universally set at 12, 26, and 9 147. These specific figures are not arbitrary; they originated in an era when global stock markets operated on a six-day trading week. In that historical context, 12 days represented exactly two weeks of trading, 26 days represented one full month of trading, and 9 days represented a week and a half 1. Despite the transition to a five-day trading week, these legacy parameters remain the industry standard across modern charting software, though they can be optimized for specific markets or timeframes 12.
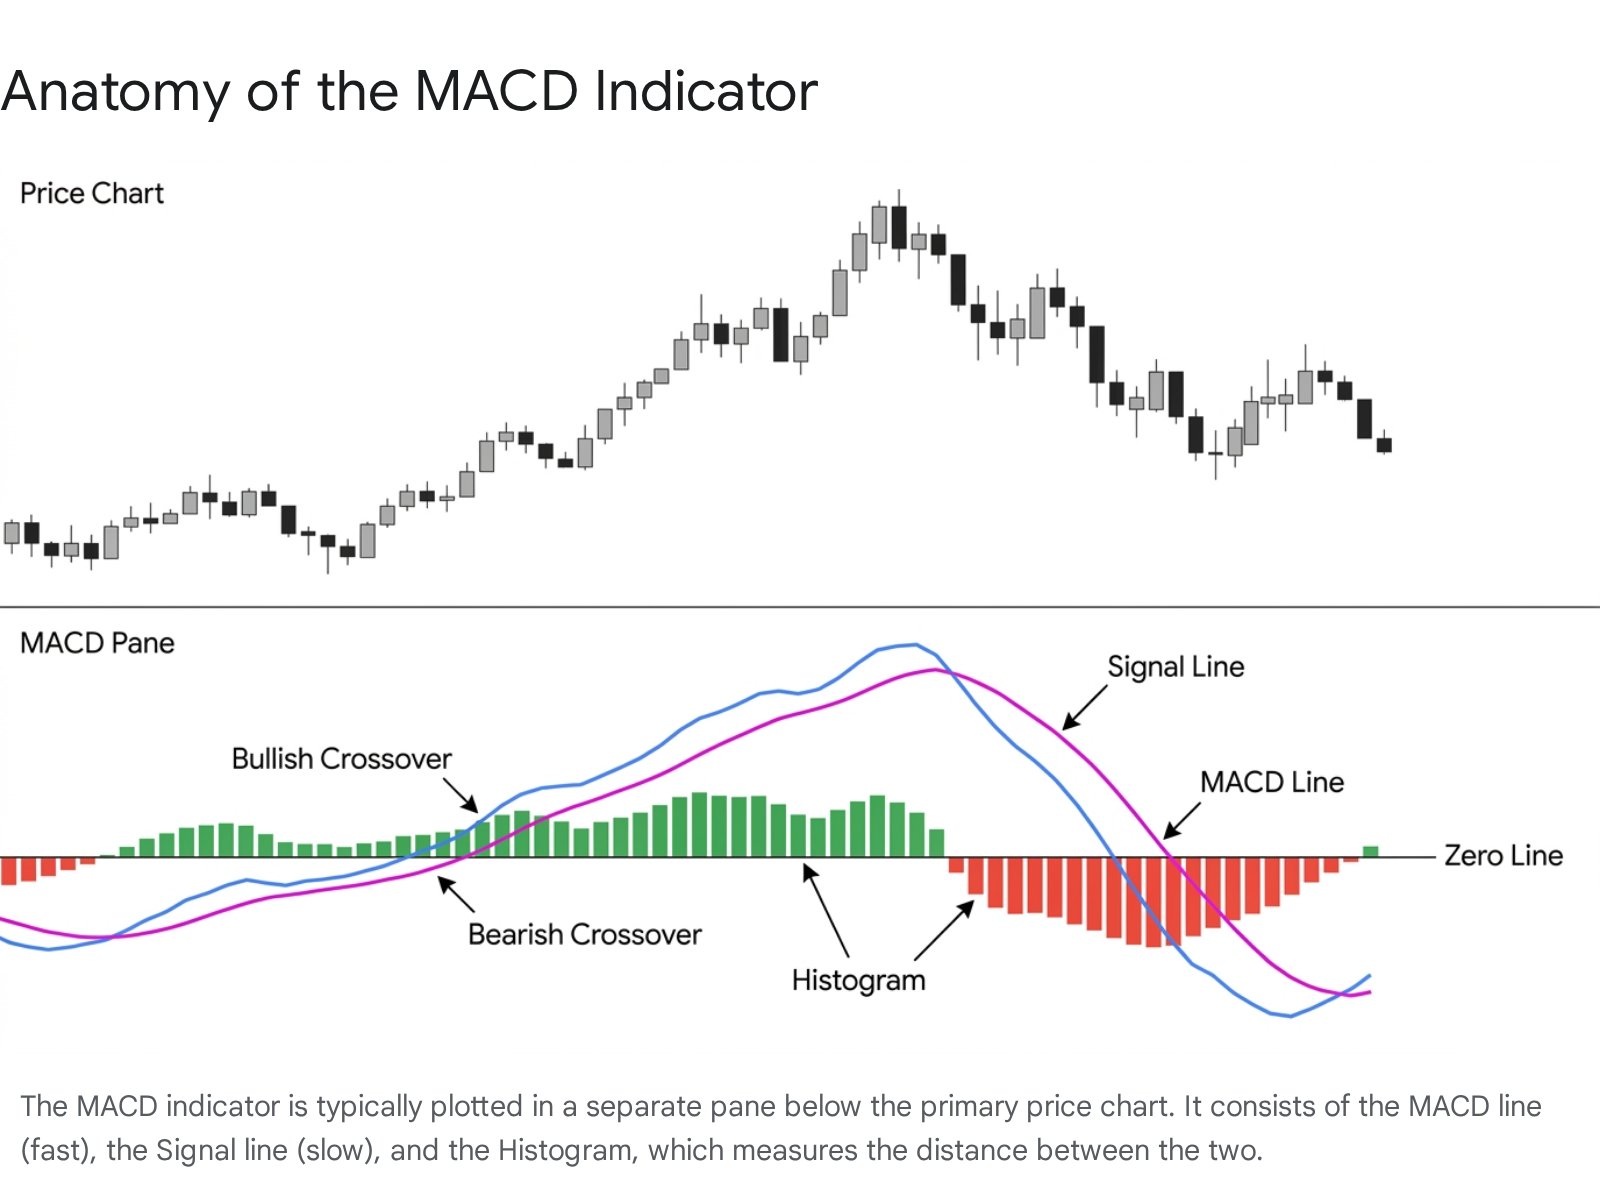
The MACD indicator consists of three distinct mathematical components, which are typically plotted together in a dedicated visual pane directly below the primary price chart.
The MACD Line (Velocity)
The MACD line is the foundational backbone of the indicator. It is calculated by taking the 12-period EMA of an asset's closing price and subtracting the slower 26-period EMA 7911. In the context of physics and technical analysis, the MACD line represents the first derivative of the asset's price action, which equates to velocity 1213.
When the 12-period EMA is higher than the 26-period EMA, the MACD line plots as a positive value above a central equilibrium point known as the zero line, indicating that short-term momentum is bullish 9. Conversely, when the 12-period EMA drops below the 26-period EMA, the MACD line falls into negative territory below the zero line, signaling that the asset's velocity has shifted to a bearish trajectory 914. The steeper the slope of the MACD line, the faster the asset is accelerating in that direction 5.
The Signal Line (Reaction)
The signal line acts as a smoothed trigger mechanism for the indicator. It is calculated by taking a 9-period EMA of the MACD line itself 7911. Because the signal line is effectively an average of an average, it is inherently slower and smoother than the primary MACD line 29. The primary purpose of the signal line is to highlight shifts in the MACD line's trajectory. It does not lead the market; it strictly reacts to changes in velocity, creating visual intersections that traders use to identify potential entry and exit points 5.
The Histogram (Acceleration)
Added to the indicator suite by Thomas Aspray in 1986, the MACD Histogram measures the physical distance between the MACD line and the signal line 133. When the MACD line is situated above the signal line, the histogram plots positive vertical bars above the zero line. When the MACD line drops below the signal line, the histogram flips to plot negative bars 3.
The histogram is considered by many technical analysts to be the most valuable predictive component of the MACD suite because it represents the second derivative of the asset's price, which translates to acceleration 1213. As the distance between the fast MACD line and the slow signal line expands, the histogram bars grow taller, signaling that momentum is actively accelerating. When the bars reach a peak and begin to shrink back toward the zero line, it is a leading warning that momentum is fading. This often alerts analysts to trend exhaustion well before the actual moving averages intersect 64.
Remarkably, the histogram is mathematically four steps removed from the actual price of the security. The first derivative is the creation of the 12-day and 26-day EMAs. The second derivative is the subtraction of those EMAs to create the MACD line. The third derivative is the 9-day EMA of the MACD line to create the signal. The fourth derivative is the subtraction of the signal line from the MACD line to generate the histogram 3. This heavy massaging of the raw data successfully filters out erratic price noise but also inherently builds latency into the indicator.
Interpreting Market Signals
While the mathematics of MACD are absolute, interpreting its outputs requires an understanding of broader market context. A frequent trap for retail traders is utilizing MACD purely mechanically - blindly executing trades every time the indicator lines cross 517. In professional practice, MACD offers a nuanced vocabulary for reading market behavior through three primary signaling mechanisms.
Crossovers and Momentum Shifts
The most widely recognized MACD strategy revolves around the interaction between the primary MACD line and its smoothed signal line. A bullish crossover occurs when the MACD line crosses upward through the signal line 745. This intersection suggests that short-term upward momentum is accelerating faster than the medium-term average, which is commonly interpreted as a potential buy signal 719. Conversely, a bearish crossover occurs when the MACD line crosses downward through the signal line, indicating that short-term momentum is deteriorating and generating a potential sell or short-selling signal 7419.
A secondary crossover strategy involves observing the MACD line's relationship with the central zero line 27. When the MACD line rises above zero, it provides structural confirmation that the underlying 12-period EMA has officially overtaken the 26-period EMA, signaling a systemic shift into a bullish market regime 219. When it falls below zero, it confirms a dominant bearish bias 2. Zero-line crossovers occur far less frequently than signal-line crossovers. As a result, they generate fewer false alarms but also trigger much later in a trend's lifecycle, often causing traders to miss the initial phase of a price movement 19.
Spotting Structural Divergences
Divergence occurs when the trajectory of the asset's actual price fundamentally disagrees with the trajectory of the MACD indicator. This phenomenon is widely considered one of the most powerful and reliable predictive signals in technical analysis, as it highlights a critical disconnect between surface price action and underlying momentum 2720.
Bullish divergence manifests when an asset's price falls to a new, lower low, but the MACD indicator simultaneously forms a higher low 71920. This discrepancy reveals that although the price is still dropping, the intense selling pressure driving the decline is quietly evaporating beneath the surface. It often foreshadows a rapid upward reversal, signaling that bears have exhausted their capital 1920.
Bearish divergence occurs when an asset's price climbs to a new, higher high, but the MACD forms a lower high 71920. This pattern acts as an early warning system, indicating that the upward trend is running out of structural energy. Even if the price continues to climb momentarily, the lack of supporting momentum suggests that a downward correction or trend reversal is highly probable 19.
Analysts identify two primary types of divergence within the histogram: peak-trough divergence and slant divergence 3. A peak-trough divergence is considered the most robust, forming when the histogram establishes two distinct, measurable peaks or troughs that explicitly contradict the price chart 3.
The Achilles Heel: Whipsaws and Lag
Despite its utility, MACD possesses significant structural vulnerabilities. The most prominent weakness is its status as a lagging indicator 1317. Because every component of the MACD is derived from historical moving averages, the indicator does not predict future price movements; it strictly reacts to data that has already been recorded. By the time a clean signal-line crossover prints on a daily chart, a substantial portion of the asset's price movement has often already occurred 17.
This lag becomes particularly destructive in sideways, range-bound markets. Because MACD was explicitly engineered as a trend-following tool, it mathematically assumes the market is moving in a distinct direction. When a market enters a period of low-volatility consolidation - trading sideways in a tight, choppy range - the fast and slow moving averages tightly converge 196. During these consolidation phases, the MACD line and the signal line will intersect back and forth repeatedly, generating a rapid succession of conflicting buy and sell signals 1719.
Traders refer to these false signals as "whipsaws." A trader strictly following MACD crossovers during a choppy market will consistently buy at the top of the minor range and sell at the bottom, systematically eroding their capital through a series of small, rapid losses 1722. A whipsaw is often triggered by sudden, brief market noise or news events that temporarily skew the exponential averages before the price reverts to its mean 22. To survive whipsaws, seasoned practitioners never use MACD in isolation. They deploy it strictly as a momentum gauge, combining it with volume analysis, support and resistance mapping, or broader market trend identification tools to ensure they are only acting on MACD signals when a genuine macroeconomic trend is underway 1419.
Empirical Accuracy: Does MACD Actually Work?
While MACD remains a ubiquitous tool on Wall Street trading desks and retail brokerage platforms, rigorous empirical studies analyzing its standalone predictive accuracy present a highly sobering reality. Academic evaluations of technical analysis frequently test whether popular indicators can generate excess returns compared to a passive "buy-and-hold" strategy. When executed mechanically without human discretion or contextual filters, standard MACD strategies generally fail to beat the broader market.
Historical Win Rates and Market Efficiency
A wealth of peer-reviewed financial literature has backtested the traditional MACD (12, 26, 9) model across various global indices and time horizons. The findings consistently highlight the dangers of relying on default parameters without contextual market analysis.
A prominent study by Meissner et al. (2001) examined the traditional MACD model across the Dow Jones Industrial Average and the NASDAQ-100 over a ten-year period from 1989 to 1999. The researchers found that blindly following MACD crossovers resulted in a disastrous success rate of 32.14% for DOW stocks and 32.73% for NASDAQ stocks 78. The results were so severely skewed toward failure that the authors concluded the traditional MACD could almost be utilized effectively as a "contra-indicator" - meaning traders might find more success doing the exact opposite of what the signal recommended 7.
Subsequent research has validated these findings in modern contexts. A 2022 backtest covering the US stock market (Dow Jones, Nasdaq, and S&P 500) from January 2015 to August 2021 revealed that a trading strategy utilizing only the MACD indicator achieved a win rate of strictly less than 50% 926. Similarly, tests on the Brazilian BOVESPA index utilizing data from 1996 to 2011 demonstrated that none of the 32 tested MACD combinations managed to outperform a simple buy-and-hold strategy 7.
However, the empirical data is not entirely bleak. Researchers have identified that MACD can generate statistically significant positive returns when its parameters are specifically optimized for certain global markets, or when it is combined with other momentum filters 92710.
| Study & Researchers | Market Examined | Time Period | Key Findings & Win Rate Observations |
|---|---|---|---|
| Meissner et al. (2001) 78 | US Market (DOW 30 & NASDAQ-100) | 1989 - 1999 | Traditional MACD (12, 26, 9) showed a poor success rate of ~32%. Labeled a potential "contra-indicator" if used blindly. |
| Chong and Ng (2008) 71130 | UK (FT30), Italy (Milan Comit), Canada (S&P/TSX) | 1935 - 1994 (UK) & varying | An optimized MACD (12, 26, 0) generated significant abnormal returns in Italy and Canada, outperforming buy-and-hold strategies. |
| Chen and Metghalchi (2012) 7 | Brazil (BOVESPA Index) | 1996 - 2011 | Tested 32 distinct MACD models. None of the parameter combinations managed to beat a passive buy-and-hold strategy. |
| Chio (2022) 926 | US Market (Dow, Nasdaq, S&P 500) | 2015 - 2021 | Standalone MACD win rate was <50%. Win rates improved significantly only when combined with RSI or modified into a volume-adjusted metric (VPVMA). |
| Quantified Strategies (2024) 3 | Various asset classes (Backtest Data) | Modern | Unoptimized strategies yield poor accuracy, but heavily filtered strategies using historical stock indices can reach a ~71.5% win rate. |
The consensus among quantitative analysts is that MACD's standalone win rate is inadequate. Its performance improves dramatically only when researchers alter the mathematical formula to account for daily price volatility and trading volume, or when they pair MACD with secondary momentum oscillators like the Money Flow Index (MFI) and the Relative Strength Index (RSI) 926.
MACD vs. RSI: A Comparative Analysis
Because standalone momentum indicators are prone to false signals, institutional and retail traders frequently pair the MACD with the Relative Strength Index (RSI). While both tools belong to the momentum oscillator family, they process historical price data through entirely different mathematical lenses and thrive in opposing market environments 73132.
The primary structural difference lies in their boundaries. The MACD is an unbounded indicator 42. Depending on the severity of a price collapse or a euphoric rally, the MACD lines can theoretically stretch infinitely far from the zero line. This makes the MACD highly effective at gauging the raw power of a continuous trend, but relatively poor at determining exact mathematical exhaustion points 2.
Conversely, the RSI is a bounded oscillator. It measures the velocity and magnitude of recent price gains against recent price losses, outputting a specific value strictly between 0 and 100 3133. This bounded nature makes RSI highly effective at identifying extreme psychological market conditions - specifically, when an asset is mathematically "overbought" (an RSI reading above 70) or "oversold" (an RSI reading below 30) 3133.
| Feature | MACD (Moving Average Convergence Divergence) | RSI (Relative Strength Index) |
|---|---|---|
| Mathematical Basis | Calculates the absolute difference between a fast and slow Exponential Moving Average 933. | Averages the magnitude of recent upward price closes against recent downward price closes 33. |
| Indicator Boundaries | Unbounded. Oscillates freely above and below a central zero line 434. | Bounded. Strictly oscillates within a fixed scale from 0 to 100 3133. |
| Optimal Market Environment | Trending Markets. Highly effective when prices are consistently moving in a distinct upward or downward trajectory 3233. | Ranging Markets. Highly effective in choppy, sideways markets where prices fluctuate between fixed support and resistance 3233. |
| Primary Trading Utility | Identifying shifts in trend direction, measuring the acceleration of momentum, and spotting macro divergences 3132. | Pinpointing highly specific, short-term reversal zones based on overbought (>70) and oversold (<30) exhaustion 3133. |
Because their strengths perfectly cover each other's blind spots, the two indicators are routinely used in symbiosis. For instance, a trader analyzing a volatile stock might notice the RSI drop to a reading of 25, indicating the asset is severely oversold. However, rather than buying immediately - which is dangerous if the asset is in a freefall - the trader will wait for a bullish MACD crossover to print. The RSI provides the alert that the asset is undervalued, and the MACD provides the confirmation that the downward momentum has actually arrested and an upward trend is beginning 914.
Platform Integrations: Robinhood and Coinbase
The accessibility of complex technical indicators has expanded massively with the advent of retail trading platforms. Historically restricted to Bloomberg terminals and dedicated charting software, tools like MACD are now integrated natively into consumer applications.
On equity-focused platforms like Robinhood, the MACD is available through advanced charting interfaces (such as the Robinhood Legend platform). Users can apply the MACD indicator to overlay beneath standard candlestick charts, manually adjusting the fast, slow, and signal lengths from the default 12, 26, and 9 settings to suit shorter or longer-term trading horizons 363738. Analysts utilizing Robinhood often pair the MACD with a 50-day or 180-day Simple Moving Average (SMA) to ensure they are only taking MACD crossover signals that align with the broader macro direction of the stock 39.
In the cryptocurrency sector, exchanges like Coinbase offer advanced trading interfaces powered by TradingView, granting retail crypto investors access to over 100 technical indicators 1241. Because cryptocurrency markets exhibit hyper-volatility and trade 24/7 without traditional market closes, the MACD is heavily utilized by crypto traders to spot sudden momentum shifts and trend formations 1242. In crypto applications, traders often scrutinize the MACD histogram specifically to catch early expansions in momentum, as digital assets tend to experience violent, rapid price movements where waiting for a traditional signal-line crossover would result in missing the majority of the trade 1442.
Bottom line
The Moving Average Convergence Divergence (MACD) is an elegant mathematical tool that strips away daily price noise to reveal the underlying velocity and acceleration of a market trend. Through its distinct lines and histogram, it provides investors with a visual representation of momentum, excelling at identifying trend exhaustion through structural divergences. However, its empirical effectiveness is highly conditional; it remains a lagging indicator that is mathematically prone to generating destructive false signals in sideways markets. Consequently, MACD operates best not as a standalone automated trading system, but as a powerful confirmation tool when paired with complementary indicators and rigorous market analysis.