Technology S-curve limits and market disruption
Introduction
The dynamics of technological innovation and market leadership rarely follow linear progressions. Throughout industrial history, leading firms possessing vast resources, deep technical expertise, and dominant market shares have routinely lost their positions to upstart entrants deploying initially inferior technologies. The explanation for this phenomenon lies in the predictable trajectories of technological performance and the economic incentives that govern corporate resource allocation.
At the center of this dynamic is the technology S-curve, a mathematical and conceptual model that describes the maturation of a technology from its inception to its physical limitation 12. Developed formally as an analytical tool for corporate strategy by Richard Foster in 1986, the S-curve illustrates why diminishing returns inevitably plague mature technologies 14. A decade later, Clayton Christensen built upon this foundation with the theory of disruptive innovation, explaining how the pursuit of high-margin, sustaining innovations on an existing S-curve creates a strategic blind spot 234. This blind spot provides the precise conditions necessary for disruptive entrants to capture overlooked market segments and eventually upend the industry order 56.
This report examines the mechanics of the technology S-curve, the distinction between sustaining and disruptive innovation, and the specific conditions that invite market disruption. It further analyzes how the digital era and artificial intelligence are compressing traditional S-curves into adoption models characterized by extreme acceleration and rapid decline, fundamentally altering the timeframe incumbents have to respond to technological threats 107.
Foundational Mechanics of the Technology S-Curve
The technology S-curve is a logistical growth model that plots the relationship between the effort or investment put into improving a product or process and the resulting performance gains 14. While frequently charted against time in popular literature, strategic management scholars emphasize that the horizontal axis more accurately represents cumulative engineering effort and research and development (R&D) investment 8. Technologies do not advance merely because time passes; they advance because capital and human ingenuity are systematically applied to them over a sustained period.
The Early Phase of Development
Every technology progresses through three distinct phases, forming the characteristic sigmoidal shape 12. During the initial formation stage, progress is exceedingly slow relative to the massive investment of time and capital required. The fundamental science and basic physical properties of the new technology are not fully understood, leading to significant inefficiencies 12.
R&D efforts frequently result in blind alleys, and the lack of complementary supply chains, manufacturing standards, and early-stage capital severely inhibits performance improvements 12. The technology remains experimental, highly expensive, and generally unsuitable for broad commercial application. During this period, incumbent firms observing the technology often dismiss it, as its performance metrics appear wholly inadequate compared to established market standards.
The Middle Phase of Rapid Growth
Once a dominant architectural design emerges and the underlying knowledge base solidifies, the technology enters a period of compounding advances 12. In this middle phase, relatively small increments of engineering effort yield massive improvements in performance and substantial reductions in manufacturing cost 113.
Economies of scale, learning curves, technological reinforcement, and supply chain maturation generate a steep, almost vertical ascent in capability 9. Early adopters begin to form niche markets, connecting supply and demand, which in turn fuels further R&D investment 9. As the technology crosses the threshold of commercial viability, commercialization accelerates rapidly, and the technology begins to be adapted into the broader marketplace 1.
The Late Phase of Technological Limits
Eventually, every technology approaches its natural, physical, economic, or architectural limits, causing the S-curve to flatten 28. Extracting further performance gains requires exponentially larger investments of effort, time, and capital 28. Improvements become fractional and marginal. At this stage, a technology is highly vulnerable to substitution, as the industry's technological productivity has reached its zenith at the S-curve's point of inflection 8.
The flattening of an S-curve is governed by absolute physical and thermodynamic laws. However, flattening S-curves can also be firm-specific rather than absolute industry phenomena. Empirical research indicates that incumbent firms frequently misdiagnose their own lack of progress as an absolute technological limit, rather than a failure of their specific architectural approach 810. This premature abandonment of an existing curve, or a failure to recognize when a genuine limit is approaching, can inadvertently invite disruption by signaling to competitors that the market is ripe for an alternative approach.
Sustaining Innovation and Incumbent Resource Allocation
To understand why leading firms fail to transition to new S-curves, it is necessary to distinguish between sustaining innovations and disruptive innovations.
Sustaining innovations are improvements made to existing products on the current S-curve. They can be minor incremental refinements or major technological breakthroughs, but their defining characteristic is that they maintain the current trajectory of competition 211. Sustaining innovations target an incumbent's most demanding, high-end customers who are willing to pay a premium for superior product performance 1213.
The Financial Logic of Incumbent Strategies
Incumbent firms almost always win battles of sustaining innovation because their organizational structures, R&D departments, and financial metrics are explicitly optimized to move up the current S-curve 511. The pursuit of sustaining innovation is driven by a rational, profit-maximizing economic logic. By creating better-performing products, a business can command higher prices and pursue ever-higher profit margins 1113.
This dynamic creates what Christensen termed the "Innovator's Dilemma." Good management practice dictates that firms should listen to their best customers and invest resources where profit margins are highest and risk is lowest 419. Executives are evaluated on their ability to grow revenue and improve gross margins, creating powerful institutional incentives to focus exclusively on the upper tiers of the market.
Resource Dependence Theory
This financial logic leads to a phenomenon known as resource dependence. As Christensen notes, while managers believe they control corporate resource allocation, it is ultimately the customers and investors who dictate how capital is deployed 14. An incumbent's mainstream customers will actively lobby against investments in early-stage disruptive technologies because those emerging technologies do not initially meet their high-performance requirements 14.
Consequently, the incumbent becomes structurally blind to emerging S-curves. The organization allocates maximum capital to the mature S-curve, pushing it into the zone of diminishing returns, while underfunding the nascent technology that will eventually supplant it 32115. The very management practices that allowed the incumbent to become successful - listening to customers and pursuing high-return investments - become the exact mechanisms that seed their eventual failure 19.
The Mechanics of Disruptive Innovation
Disruptive innovations, by contrast, create entirely new S-curves. They do not attempt to bring better products to established customers in existing markets. Instead, they introduce simpler, cheaper, and more accessible products that initially underperform established mainstream solutions along traditional performance dimensions 216.
Because these innovations are initially inferior, they do not appeal to the incumbent's primary customer base. This creates a deceptive environment where the incumbent views the emerging technology as a non-threat, or even a toy, rather than a genuine competitive risk 21.
Low-End Market Disruption
Disruptive innovations generally follow two distinct footholds to enter a market. The first is low-end disruption. In this scenario, the disruptor targets the least profitable, most price-sensitive segment of the existing market 2613. Because the incumbent is intensely focused on satisfying its high-margin customers, it willingly cedes this low-end segment rather than fighting a margin-destroying price war 2611. There is simply no profitability incentive for a large corporation to fight for the bottom of the market 2.
New-Market Disruption
The second foothold is new-market disruption. Here, the disruptor targets non-consumers - populations who previously lacked the financial resources, technical skill, or access required to participate in the market 213. By creating an entirely new value network with a low-cost version of a product, the disruptor builds a business in an area where no incumbent competition currently exists 24.
Performance Overshoot and Asymmetric Motivation
The mechanism that allows the disruptor to eventually conquer the mainstream market relies on two interacting factors: performance overshoot and asymmetric motivation 51124.
First, as the incumbent continually applies sustaining innovations to its product, it eventually overshoots the actual performance requirements of the average mainstream customer. The product becomes too complex, too feature-rich, and too expensive for what the broader market actually needs 52417.
Second, the disruptor experiences asymmetric motivation. After securing a foothold in the low-margin tier, the disruptor is motivated to improve its technology - to move up its own steep S-curve - in order to capture higher margins 11. The incumbent, conversely, is motivated to flee further upmarket to avoid competing in the low-margin tiers 11.
As the disruptive technology rapidly improves, it eventually reaches a critical intersection point where its performance is "good enough" for the mainstream market. Because it is cheaper, more accessible, and now meets baseline performance requirements, mainstream customers defect to the disruptor in high volumes, resulting in a sudden and rapid market upheaval 61316. The incumbent firm, having focused purely on sustaining innovations, finds that its mature S-curve has been entirely undermined by the emerging disruptive trajectory.
| Characteristic | Sustaining Innovation | Disruptive Innovation |
|---|---|---|
| Target Customer Segment | The most demanding, high-end customers in existing, established markets 1213. | Overserved low-end customers or entirely new, unserved markets (non-consumers) 213. |
| Initial Performance Profile | Improves performance along dimensions historically valued by mainstream customers 1516. | Initially inferior performance in traditional metrics, but introduces new benefits (cheaper, simpler) 216. |
| Financial Driver | Driven by the pursuit of higher profit margins and premium pricing power 11. | Driven by low-cost, high-volume models; structurally lower profit margins initially 11. |
| Incumbent Strategic Response | Aggressive defense. Incumbents usually win these battles due to superior resources and scale 5. | Flight upmarket. Incumbents willingly cede the low end to focus on higher-margin product tiers 1113. |
| Impact on Technology S-Curve | Pushes the technology further up the existing, mature S-curve toward physical limits 18. | Creates an entirely new, parallel S-curve that eventually intersects and overtakes the old one 118. |
Historical Evidence from the Disk Drive Industry
The foundational empirical evidence for the theory of disruptive innovation stems from the computer hard disk drive industry between the years 1976 and 1989 810. The industry was characterized by rapid technological advancement, intense competition, and severe market disruptions driven primarily by changes in the physical size (form factor) of the drives 19.
Architectural Versus Component Innovation
During the late 1970s, 8-inch disk drives were the established industry standard for the highly profitable minicomputer market. These drives utilized continuous rotation mechanics and heavy alternating current (AC) motors, making them physically large and expensive, but capable of high storage capacities 20.
In 1980, new entrants such as Seagate Technology introduced 5.25-inch drives 19. Initially, these 5.25-inch drives offered significantly lower storage capacity (often just 5 megabytes) and were entirely rejected by mainstream minicomputer manufacturers, who required much higher capacity to satisfy their users 19. However, the 5.25-inch drives represented a disruptive, architectural innovation. They were smaller, required less raw magnetic coating and metal, utilized simpler stepper motors with less range of motion, and relied on direct current (DC) motors that only spun the disk on demand 20. This architectural shift made them significantly cheaper to manufacture and highly suitable for environments where continuous operation was not required.
The Incumbent Blind Spot
Because the incumbent 8-inch drive manufacturers were captive to the high-margin minicomputer market, they largely ignored the 5.25-inch format, viewing it as a low-capacity toy unsuitable for serious computing 21. Instead of fighting the incumbents, entrants like Seagate targeted an entirely new, low-end market: the emerging desktop personal computer (PC) industry 19.
As the PC market exploded following the introduction of the IBM XT and AT, the 5.25-inch drive manufacturers moved rapidly up their own steep S-curve, benefiting from massive economies of scale and rapid R&D iteration 19. By 1986, the capacity of the 5.25-inch drive had advanced enough to meet the baseline needs of the minicomputer market 21. Armed with a massive cost advantage and equivalent performance, the entrants completely disrupted the 8-inch incumbents 21. This cycle repeated itself shortly after, when 3.5-inch drives, initially developed for portable computers by companies like Conner Peripherals, eventually disrupted the 5.25-inch desktop market 19.
Modern Disruption in the Automotive Sector
The principles of S-curve disruption remain highly applicable to contemporary industrial transitions, most notably the shift from Internal Combustion Engine (ICE) vehicles to Electric Vehicles (EVs).
The ICE technology is currently operating at the extreme upper plateau of its S-curve. Achieving regulatory emissions compliance and squeezing marginal fuel efficiency gains requires immense engineering complexity and capital investment for rapidly diminishing returns 2223. Traditional automakers face a classic innovator's dilemma, as their profit pools are heavily concentrated in highly refined, complex ICE trucks and SUVs.
High-End Protection Versus Modular Disruption
Conversely, EV technology is currently in the steep growth phase of a new S-curve. In its earliest iterations, the EV suffered from poor range, high battery costs, and a lack of charging infrastructure - classic hallmarks of an inferior disruptive technology that mainstream consumers initially reject 2433. Legacy automakers, prioritizing the massive profit margins of their established ICE fleet, largely treated EVs as sustaining innovations. They attempted to build high-end, luxury EVs that mirrored ICE performance metrics, or focused heavily on hybrid technologies that sustained their existing ICE powertrain architectures 2325.
However, genuine disruption in the automotive sector is emerging from the low end of the market, particularly in Asia. Chinese original equipment manufacturers (OEMs) such as BYD and Wuling introduced highly modular, cost-reduced EV platforms explicitly tailored for urban use cases and emerging markets, rather than attempting to compete on luxury specifications 24. Vehicles like the Wuling Hongguang Mini EV, priced under $5,000, serve as textbook low-end disruptors 24. By establishing massive manufacturing scale and relentlessly driving battery costs down the learning curve, these aggressive entrants are rapidly moving upmarket 2425. This trajectory poses an existential threat to established global OEMs who remained tethered to the mature ICE S-curve and assumed EV adoption would be restricted to wealthy economies 2324.
Neobanks and Disruption in Retail Banking
The retail banking sector provides another stark illustration of the tension between mature incumbent operating models and emerging disruptive architectures.
Traditional incumbent banks operate on a highly mature S-curve reliant on extensive physical branch networks, legacy mainframe IT systems, and manual processing 2627. This operational model carries incredibly high fixed costs. Administrative and IT expenses for traditional banks sit at approximately 1.3% of total assets, making it economically unviable for them to profitably serve micro-businesses, lower-income demographics, or individuals seeking small-dollar loans 2728.
Structural Cost Advantages and Profitability
Neobanks - digital-only challenger banks such as Revolut, Monzo, and Nubank - entered the market as pure disruptors. By utilizing cloud computing, application programming interfaces (APIs), and mobile-first architectures, they dramatically reduced the cost of customer acquisition and daily servicing. Empirical data indicates that digital bank spin-offs and neobanks operate up to 60% to 70% cheaper than traditional banking models on a daily basis 27.
Initially, neobanks captured low-end, less profitable segments: younger, tech-savvy demographics, the underbanked, and basic checking account users who sought seamless digital experiences without branch access 2939. Incumbents, enjoying record profits from their established bases, largely ignored this attrition, as the lost checking accounts did not represent their primary profit drivers 27.
The Upmarket Migration of Fintech
However, incumbent banks have proven resilient because they control highly profitable, complex financial products - such as mortgages, wealth management, and structured commercial lending - that require massive balance sheets and stringent regulatory compliance 2930. To survive the long term, neobanks are currently executing the classic disruptive move upmarket to achieve profitability 30.
In recent years, neobanks have shifted their focus toward Small and Midsize Business (SMB) banking, offering higher-margin products like working capital, receivables financing, and integrated accounting software 30. This shift is yielding significant financial results. In 2024, global fintech revenues grew by a robust 21%, dramatically outpacing the 6% growth of the broader financial services sector 2931. Furthermore, the average EBITDA margin for public fintechs improved to 16%, and fully 69% of public fintechs achieved profitability, marking a definitive shift from unconstrained user growth to sustainable margin expansion 2931.
| Financial & Operational Metric | Traditional Incumbent Banks | Neobanks / Fintech Disruptors |
|---|---|---|
| Primary Delivery Channel | Physical branch networks & ATMs 39. | Digital-only (Mobile applications & Web interfaces) 3932. |
| Operating Cost Structure | High fixed costs; administrative expenses ~0.5% of assets, IT ~1.3% 27. | Low fixed costs; operating daily costs up to 60% cheaper than incumbents 27. |
| Primary Customer Segment | Broad demographics, high-net-worth individuals, established corporations 2930. | Tech-savvy demographics, younger users, the underbanked, and SMBs 2939. |
| Financial Performance (2024) | High Return on Equity (ROE) (~10-15%) via diverse, deposit-backed lending 2730. | High revenue growth (21%); scaling EBITDA margins (~16%), with leading firms reaching 29% ROE 2939. |
Technological Leapfrogging in Emerging Markets
The strict, sequential progression of S-curves observed in developed nations can be completely bypassed through a phenomenon known as technological leapfrogging. This occurs when emerging economies, unburdened by the sunk costs of legacy infrastructure, skip the mature technology phase entirely and adopt the newest disruptive technology directly 4333. Leapfrogging provides a unique structural advantage, allowing smaller nations to adopt cutting-edge systems rapidly and often at lower overall costs 43.
Mobile Telephony and Digital Finance in Africa
Sub-Saharan Africa provides the clearest empirical evidence of technological leapfrogging. Western nations spent the better part of a century building extensive landline telephone networks and vast networks of physical retail bank branches 45. In the early 2000s, Africa largely lacked both forms of infrastructure 45. Rather than investing billions to progress through the landline and physical banking S-curves, the continent leapfrogged directly to mobile cellular networks and mobile-money fintech 4346.
Kenya's M-Pesa stands as the archetypal case study. Launched as a simple SMS-based system on basic feature phones, it allowed users to send, receive, and store money without a traditional bank account or internet connection 4345. M-Pesa acted as a foundational infrastructure disruption, skyrocketing Kenya's financial inclusion rate from 27% in 2006 to over 75% by 2016 45. Today, the numbers are staggering: more individuals in Sub-Saharan Africa hold mobile money accounts than traditional bank accounts, and the region facilitates over $1.1 trillion in digital transactions annually, integrating millions into the global economy at an unprecedented pace 4534.
Decentralized Energy and Healthcare Leapfrogs
Leapfrogging extends beyond digital finance. In the energy sector, emerging markets without centralized, fossil-fuel-intensive electrical grids are adopting decentralized solar and wind micro-grids 4635. By bypassing the legacy infrastructure of coal and gas power plants, these markets achieve a faster rate of adoption of renewable technologies, avoiding the innovator's dilemma that paralyzes western utility incumbents heavily invested in fossil fuels 3536.
Similarly, in healthcare, regions facing shortages of qualified medical personnel and centralized hospitals are leapfrogging traditional diagnostic models. Platforms leveraging mobile health (mHealth), telemedicine, and AI-powered diagnostic tools are enabling remote populations to access care without requiring the massive capital outlays associated with building traditional healthcare infrastructure 3350.
The Compression of the S-Curve in the Digital Economy
While the traditional S-curve and Christensen's disruptive innovation theory expertly explain physical and hardware-based industry transitions, the rise of software, digital platforms, and artificial intelligence has fundamentally altered the mathematics and speed of technology adoption.
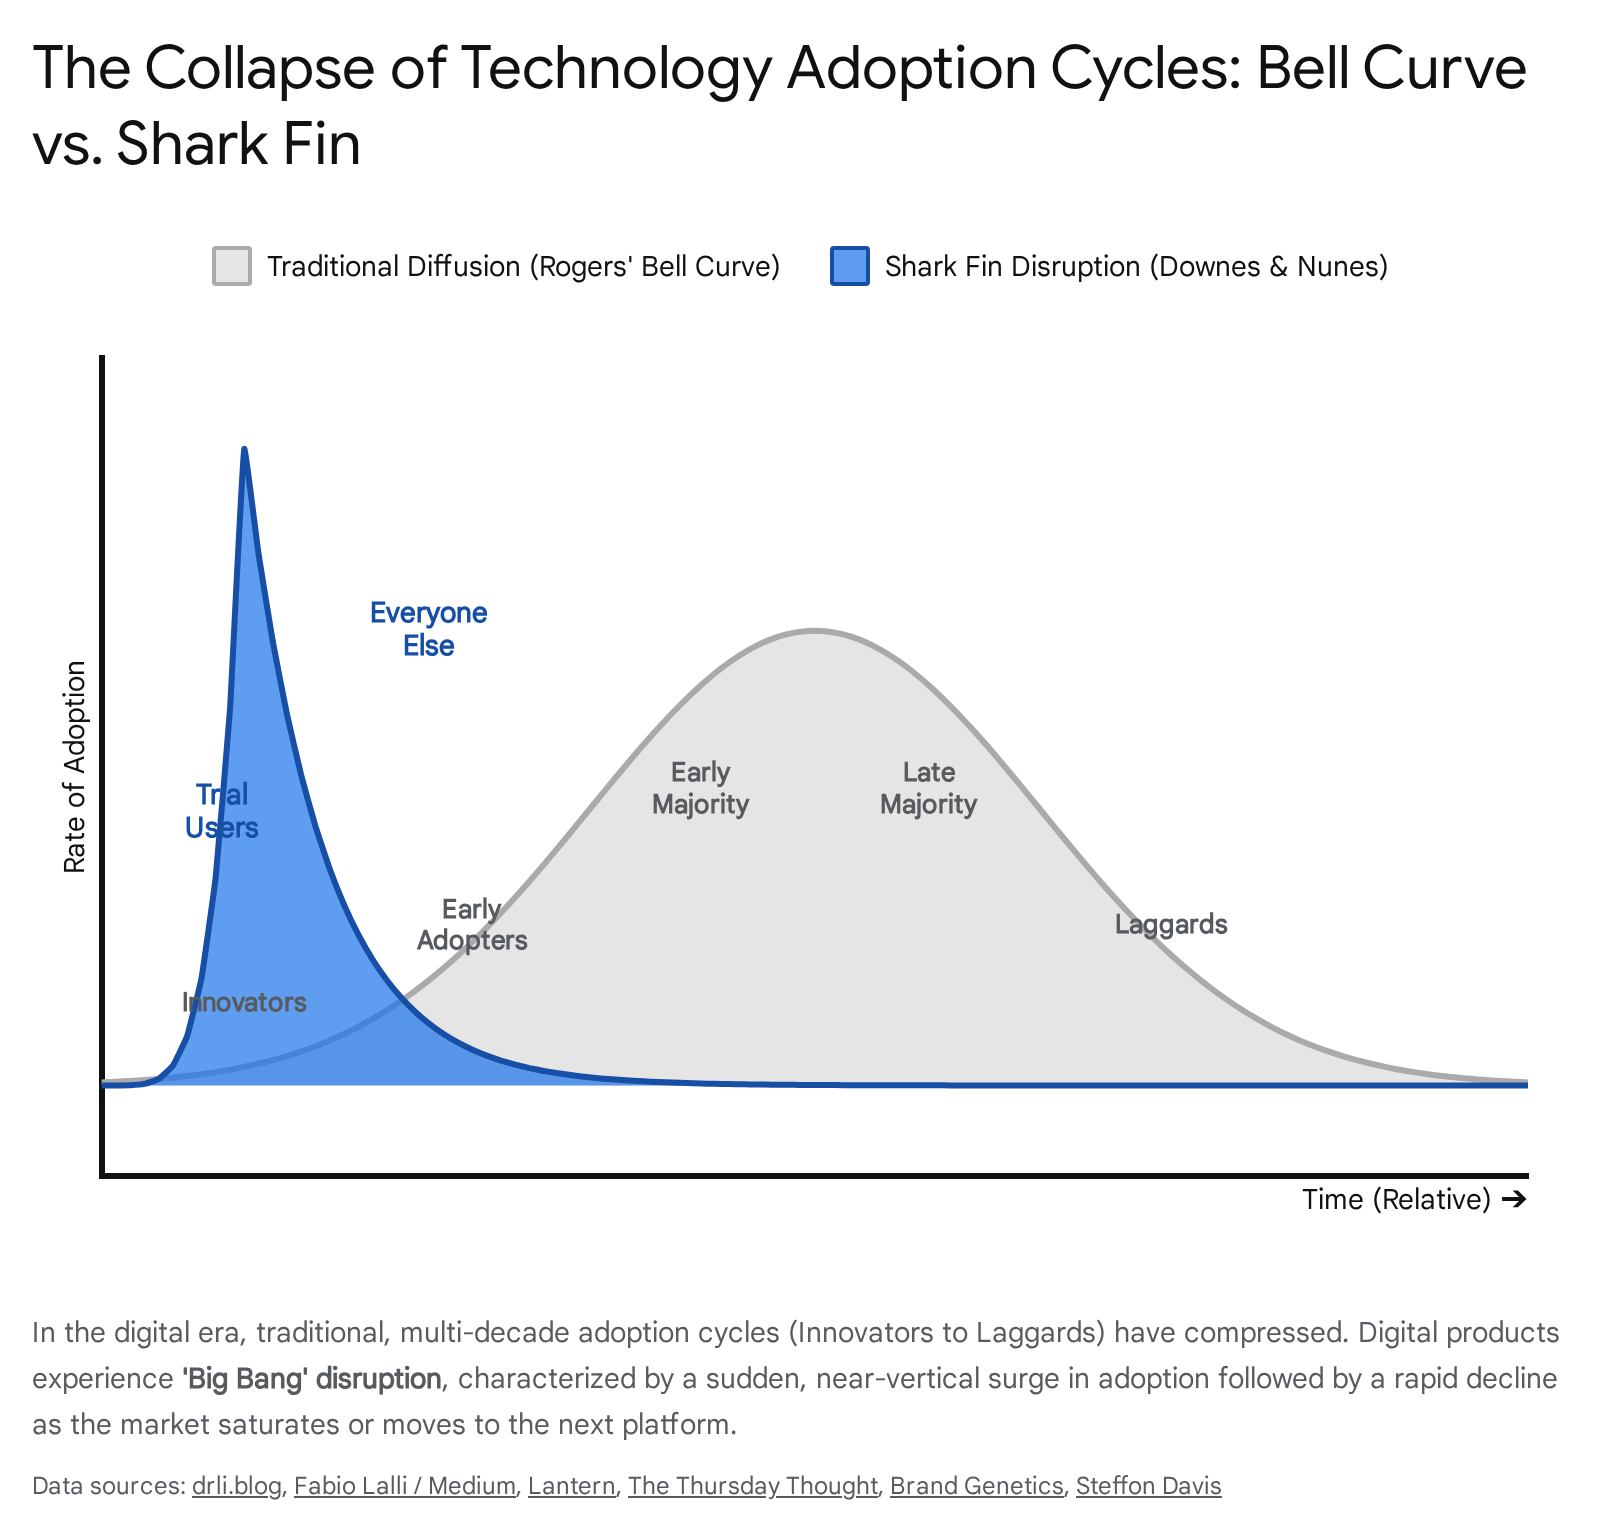
Historically, the diffusion of an innovation followed a normal (Gaussian) distribution, famously categorized by sociologist Everett Rogers in 1962 into five distinct segments: innovators, early adopters, early majority, late majority, and laggards 10515253. This sociological model resulted in a slow, steady, symmetrical S-curve of market penetration that could take decades to unfold. For example, the telegraph required 56 years to reach 50% market penetration 51.
In the digital era, this model has essentially collapsed. In 2014, researchers Larry Downes and Paul Nunes introduced the "Big Bang Disruption" model, observing that digital S-curves no longer resemble a gentle, predictable slope, but rather a sharp "shark fin" 10525437.
Unencumbered Development and Unconstrained Growth
The shark fin model is driven by the near-zero marginal cost of digital replication, hyper-connectivity, and global software supply chains that allow startups to scale instantly without physical constraints 5152.
This leads to unencumbered development. Innovators can test dozens of iterations in the cloud with minimal capital risk, failing fast and cheaply until they achieve product-market fit 10. Once a product resonates, it experiences unconstrained growth. The traditional five stages of user adoption collapse into merely two: trial users and everyone else 5254. When everyone has access to the same information globally and simultaneously, the lag between discovery and mass adoption disappears, creating near-vertical growth 53.
Undisciplined Strategy and Simultaneous Attack
Unlike traditional Christensen-style disruptors that patiently target the low-end of the market with cheaper, inferior products, Big Bang Disruptors employ an "undisciplined strategy" 37. They enter the market offering products that are simultaneously better, cheaper, and highly customized, attacking all customer segments and incumbent value propositions at exactly the same time 24.
The shark fin curve consists of four violent phases 1024: 1. The Singularity: A prolonged period of failed experiments, invisible development, and steady refinement below the market's radar. 2. The Big Bang: Instantaneous, catastrophic success and near-vertical market adoption that leaves incumbents entirely unable to react. 3. The Big Crunch: A rapid saturation of the market followed by a precipitous decline as consumers abruptly abandon the product for the next technological wave. 4. Entropy: The collapse of the old market order and a period of industry chaos before a new equilibrium is found.
Artificial Intelligence and the J-Curve Effect
The emergence of General Purpose Technologies (GPTs) such as Generative Artificial Intelligence represents the most extreme compression of the adoption-investment feedback cycle in human history 5138.
Mathematical modeling using the Bass Diffusion framework demonstrates the unprecedented speed of AI deployment. Traditional internet technologies possessed moderate coefficients of external innovation and internal imitation. AI tools, however, demonstrate an innovation coefficient ($p$) of $0.01$ and an imitation coefficient ($q$) of $0.8$, pointing to a massive reliance on internal network effects and a near-vertical adoption trajectory 51. Where the telegraph required 56 years to reach 50% penetration, consumer AI applications achieved massive global scale in under three years, with models like ChatGPT famously reaching 100 million users in just two months 5158.
The Productivity J-Curve of General Purpose Technologies
Despite rapid adoption, technologies like AI initially present a statistical anomaly known as Solow's Paradox - the phenomenon where massive technological advancements are accompanied by a temporary slowing down of measured economic productivity 38.
This is explained by the Productivity J-Curve. Because general-purpose technologies require immense complementary investments - such as business process redesign, new skill acquisition, and custom software development - productivity is initially underestimated 38. Firms devote massive resources to building unmeasured intangible capital. Only later, once these unmeasured assets generate capital services and the new S-curve matures, does the output drastically increase, resulting in a J-shaped curve of productivity growth over time 38.
Investment Thresholds and Rapid Scaling
Because digital infrastructure enables immediate global distribution without physical manufacturing bottlenecks, the temporal relationship between S-curve adoption and subsequent capital investment operates in a hyper-compressed feedback loop 51. Empirical analysis suggests that technologies typically require investment levels exceeding 1-2% of their total addressable market size to achieve mainstream acceleration 51. In the case of AI, capital deployment has blown past historical precedents, pushing investment into the hundreds of billions of dollars almost instantly, fueling continuous and radical innovation cycles that afford legacy businesses virtually zero time to react 51.
Academic Critiques and Limitations of Disruption Theory
Despite its status as one of the most influential business theories of the late 20th and early 21st centuries, Christensen's framework of disruptive innovation has faced rigorous academic critique, particularly regarding its predictive validity, methodology, and definitional ambiguity 21394041.
Ex-Post Predictability and Hindsight Bias
The most significant controversy surrounds the theory's reliance on retrospective case studies, leading to accusations of outcome bias and hindsight bias 4042. Critics argue that the S-curve and disruptive innovation frameworks are primarily explanatory rather than predictive tools. They successfully explain why a company failed after the fact, but struggle to reliably predict which nascent technologies will successfully disrupt an industry ex-ante 426343. As historian Jill Lepore argued in a highly publicized critique, Christensen's methodology often relied on circular arguments, branding businesses as disrupted merely because they failed, rather than proving the causative mechanism of the theory 43.
This critique is supported by empirical analysis. In a comprehensive review by King and Baatartogtokh (2015), researchers surveyed 79 experts across 77 industries originally cited by Christensen as definitive examples of disruption. The study found that only 9% of the cases strictly matched all four primary tenets of Christensen's theory 2163. Specifically, the researchers found that: * In 78% of the cases, incumbents had not actually overshot customer needs. * In 39% of the cases, incumbents did not possess the capability to respond. * In 38% of the cases, the incumbents were not displaced but successfully defended their market share and recovered 63.
Definitional Dilution and Misapplication
Furthermore, the term "disruption" has suffered from severe semantic dilution over the past two decades. It is routinely misused in popular business literature and journalism to describe any successful startup, any industry shakeup, or any rapid technological advancement, regardless of whether it originates at the low end of the market or operates on a genuinely new S-curve 2644.
Christensen himself cautioned that conflating generic competitive threats with actual disruptive innovation renders the theory useless for strategic planning 64466. If every new competitor is viewed as a "disruptor," executives cannot accurately calibrate their responses, leading to wasted resources chasing sustaining threats while ignoring genuine, low-end disruptive trajectories 66.
Outcome Bias and Pro-Innovation Assumptions
Additionally, the theory exhibits a pro-innovation bias, implicitly assuming that disruption is always a positive economic force and that incumbent failure is an inherent negative. Recent scholarship advocates for a broader, more nuanced view that accounts for the societal negative externalities of disruption 40. The "catastrophic success" of modern digital platforms can devastate local economies, erode labor standards, and destroy existing value networks long before equitable new equilibriums are established 5340. Furthermore, the theory rarely examines the thousands of "failed disruptors" that attempted to jump to a new S-curve but never achieved commercial viability, creating a distinct survivor bias in the literature 41.
Strategic Imperatives for Organizational Competence
For corporate leaders, strategy executives, and policymakers, understanding the mechanics of the S-curve provides a vital structural framework for long-term survival. The primary imperative for any incumbent firm is to proactively identify the "innovation window" - the critical inflection point where the current S-curve begins to plateau, but before revenue declines become terminal and irreversible 4546.
Ambidexterity and Autonomous Business Units
Successfully "jumping the S-curve" requires extreme organizational ambidexterity 746. Management must simultaneously optimize the mature, sustaining business to harvest maximum cash flow while purposefully ring-fencing capital to fund disruptive, lower-margin ventures that will eventually cannibalize their own core products 6947.
Research shows that firms attempting to cram a disruptive technology into their existing operational models and sales channels almost universally fail, as the legacy cost structures and high-margin expectations of the core business inevitably crush the nascent innovation 4469. To survive disruption, incumbents must establish highly autonomous business units, physically and financially separated from the core enterprise, empowering them with distinct operating models, separate profit-and-loss responsibilities, and the freedom to pursue low-end markets without the burden of sustaining legacy margins 32166.
Ultimately, navigating technology S-curves requires corporate leadership to acknowledge that the financial metrics optimized for measuring present success - such as gross margins, efficiency ratios, and short-term return on investment - are inherently adversarial to the investments required for future survival 314.