SaaS niche performance by growth and retention in 2026
Macroeconomic Context and the Software Environment
The software-as-a-service market in 2026 is defined by a rigorous transition from growth-at-all-costs execution to structural capital efficiency. Market capitalization and private valuations have undergone a severe recalibration. In the first quarter of 2026, the median enterprise value to trailing-12-month revenue multiple for public software companies compressed to 3.3x, down from 4.9x at the end of 2025 and 6.2x at the end of 2024 1. This broad repricing - exacerbated by a sudden market sell-off in early 2026 dubbed the "SaaSpocalypse" - was triggered by a confluence of cautious corporate IT budget guidance, rising interest rates, and the rapid deployment of autonomous agentic artificial intelligence workflows that threaten traditional per-seat licensing models 12. During a 48-hour window in February 2026, approximately $300 billion in market value evaporated from the software sector 2.
Despite valuation compression, the underlying operational economics of the industry reveal a maturing sector rather than a collapsing one. Worldwide IT spending is projected to reach $6.15 trillion in 2026, with software remaining the fastest-growing segment 2. The global software-as-a-service market reached $408.21 billion in 2025 and is projected to expand to $465.03 billion in 2026, scaling toward a projected $1.37 trillion by 2035 2.
The Transition to Capital Efficiency
Capital markets no longer reward raw top-line expansion if it is accompanied by high cash burn. Efficiency metrics have become the primary determinants of valuation. The traditional "Rule of 40" - the sum of annual recurring revenue growth rate and profit margin - remains a baseline, but premium valuations are increasingly reserved for companies satisfying the "Rule of X," which heavily weights free cash flow margins alongside growth 4. While top-line growth steps down to an estimated public median of 12.7% for 2026, EBITDA margins continue expanding, projected to reach a median of 22.6%, up from 17.4% in 2024 1.
The cost of acquiring new revenue has structurally increased across the industry. Customer acquisition cost payback periods for mid-market and enterprise software companies have stretched to an industry-wide median of 18 months, driven by declining paid media efficiency, AI-overview disruption in organic search, and lengthened enterprise sales cycles 567. Consequently, top-performing organizations are shifting their operational focus from net-new logo acquisition to monetization, pricing optimization, and existing customer expansion. Expansion annual recurring revenue now accounts for 40% of all new revenue generated across the industry, and over 50% for companies scaling past $50 million in total annual recurring revenue 89.
Corporate Budget Rationalization and Vendor Consolidation
Enterprise technology officers are actively rationalizing their software environments. The average enterprise currently deploys 106 distinct cloud applications, a reduction from a peak of 130 in 2022 23. This consolidation is driven by budget scrutiny, the mitigation of shadow IT risks, and a desire to integrate natively with core systems of record. Approximately 68% of technology leaders plan further vendor consolidation in 2026, with most targeting a 20% reduction in total providers 3.
The drive toward consolidation is further justified by pervasive software waste. Estimates indicate that up to 50% of purchased software licenses remain unused, resulting in an average loss of roughly $18 million per year for large enterprises 2. As organizations adopt strict software management platforms - a sub-niche projected to reach nearly $10 billion by 2032 - procurement decisions are increasingly based on demonstrable utilization and measurable return on investment rather than speculative feature adoption 11.
General Software Performance Benchmarks
To contextualize the performance of specific niches, it is necessary to establish the baseline performance metrics of the broader business-to-business software market. Data aggregated from thousands of private and public software companies indicates a stabilization of growth rates at significantly lower thresholds than the 2020-2021 period, alongside distinct performance expectations based on company scale.
Annual Recurring Revenue Growth Dynamics
The median year-over-year annual recurring revenue growth rate for private business-to-business software companies has settled at 25% to 26% 81213. This represents a steady decline from the population median of 35% in 2022 and 30% in 2023 14. Growth expectations scale inversely with company size. During the scaling stage ($1 million to $10 million in revenue), the median growth expectation is 100%, with top performers reaching 150% to 250% 15. In the efficiency stage ($10 million to $50 million), growth naturally decelerates to a median of 50% 15. At the compounding stage (above $50 million), 25% to 40% year-over-year growth represents the top quartile of performance 215.
| Company Scale (ARR) | Median Growth Rate | Top Quartile Growth Rate | Expected Net Revenue Retention | Target Monthly Churn |
|---|---|---|---|---|
| $1M to $10M | 100% | 150%+ | 105% - 115% | 3% - 5% |
| $10M to $50M | 50% | 80%+ | 110% - 120% | 1% - 3% |
| $50M+ | 25% | 40%+ | 115% - 125% | < 1% |
Net Revenue Retention and Churn Realities
Net revenue retention - the percentage of recurring revenue retained from existing customers over a year, inclusive of expansions, contractions, and churn - remains the single strongest predictor of long-term commercial viability. In 2026, the industry-wide median net revenue retention has compressed to 101%, indicating that the average software company is barely growing from its existing base 81213. Top-quartile performers consistently achieve retention above 110%, while best-in-class enterprise vendors exceed 130% 9. Organizations with retention in the 110%+ range grow approximately 2.3 times faster than peers sitting at the 95-100% threshold 6.
Gross revenue retention, which excludes expansion revenue to isolate pure customer retention, currently ranges between 85% and 90% for the broader sector 913. A gross retention rate above 95% in the enterprise segment remains the benchmark for exceptional product-market fit and high switching costs 9. Regarding logo churn, pre-product-market-fit companies generally see 8% to 15% monthly churn, while mature organizations exceeding $100,000 in monthly recurring revenue maintain monthly churn below 3%, with top enterprise vendors operating well below 1% 1516.
Disparities Across Funding and Operational Models
A widening bifurcation in the market exists based on funding structure and operational models. The distinction between bootstrapped, traditional equity-backed, and AI-native companies dictates vastly different baseline expectations for growth and efficiency. Bootstrapped companies generating between $3 million and $20 million in revenue report a median growth rate of 15% to 20%, but maintain strong net revenue retention of 103% to 104% and a shorter customer acquisition cost payback period of 14 months 1217. Traditional venture-backed companies achieve higher median growth of 25% to 26% and a net retention of 101%, but suffer from longer payback periods averaging 18 months, driven by elevated spending on sales and marketing 8124.
In stark contrast, AI-native software platforms significantly outpace traditional operational models. These companies exhibit median growth rates approximating 100%, driven by extremely rapid development cycles - two to six weeks to a minimum viable product compared to three to six months for traditional software - and highly efficient customer acquisition models 19. AI-native firms also demonstrate superior net revenue retention averaging 118% due to outcome-based pricing, and achieve an exceptional acquisition payback period of roughly 6 months 19.
| Operational Model | Median ARR Growth | Median NRR | Median CAC Payback | ARR Per Employee |
|---|---|---|---|---|
| Bootstrapped | 15% - 20% | 103% - 104% | 14 Months | ~$110,000 |
| Traditional VC-Backed | 25% - 26% | 101% | 18 Months | ~$94,000 |
| AI-Native | 100%+ | 118% | 6 Months | $238,000+ |
The Structural Shift Toward Vertical Specialization
A defining dynamic in the 2026 market is the structural outperformance of vertical software - purpose-built for specific industries - over horizontal tools that remain industry-agnostic. Across the broader market, vertical companies are growing at a median rate of 31%, compared to 28% for horizontal providers, with some datasets indicating an even wider growth gap of 24% versus 16% 2.
Advantages of Industry-Specific Architecture
The outperformance of vertical software is rooted in workflow depth and functional specialization. By embedding deeply into the core, industry-specific operations of their customers, vertical platforms create massive switching costs that horizontal applications struggle to replicate 35. When software mirrors how a specific business inherently functions, encompassing unique compliance terminology and distinct operational rhythms, it transitions from a discretionary tool to critical infrastructure 56. This integration results in lower logo churn and fundamentally higher gross revenue retention.
Furthermore, vertical organizations benefit from highly efficient go-to-market motions. Because the total addressable market is narrowly defined, customer acquisition relies on targeted account-based marketing and community-led growth within specific trade networks. This laser focus significantly drives down marketing waste, allowing vertical companies to realize 40% to 50% greater sales efficiency than horizontal counterparts engaged in expensive, broad-market digital advertising 6.
Multi-Product Expansion Strategies
The most successful vertical software companies in 2026 operate as multi-product platforms. Rather than solving a single point-solution problem, these vendors establish a control point within an industry and subsequently expand into adjacent workflows. In 2025, 59% of vertical software companies reported offering more than one product 147.
The financial impact of a multi-product architecture is substantial. Multi-product vertical companies achieve annual recurring revenue growth roughly 21% faster than their single-product peers 147. By layering embedded financial technology, payroll, or procurement modules on top of core operational software, vertical vendors dramatically expand their revenue per account without incurring equivalent acquisition costs, driving net revenue retention well above the industry median.
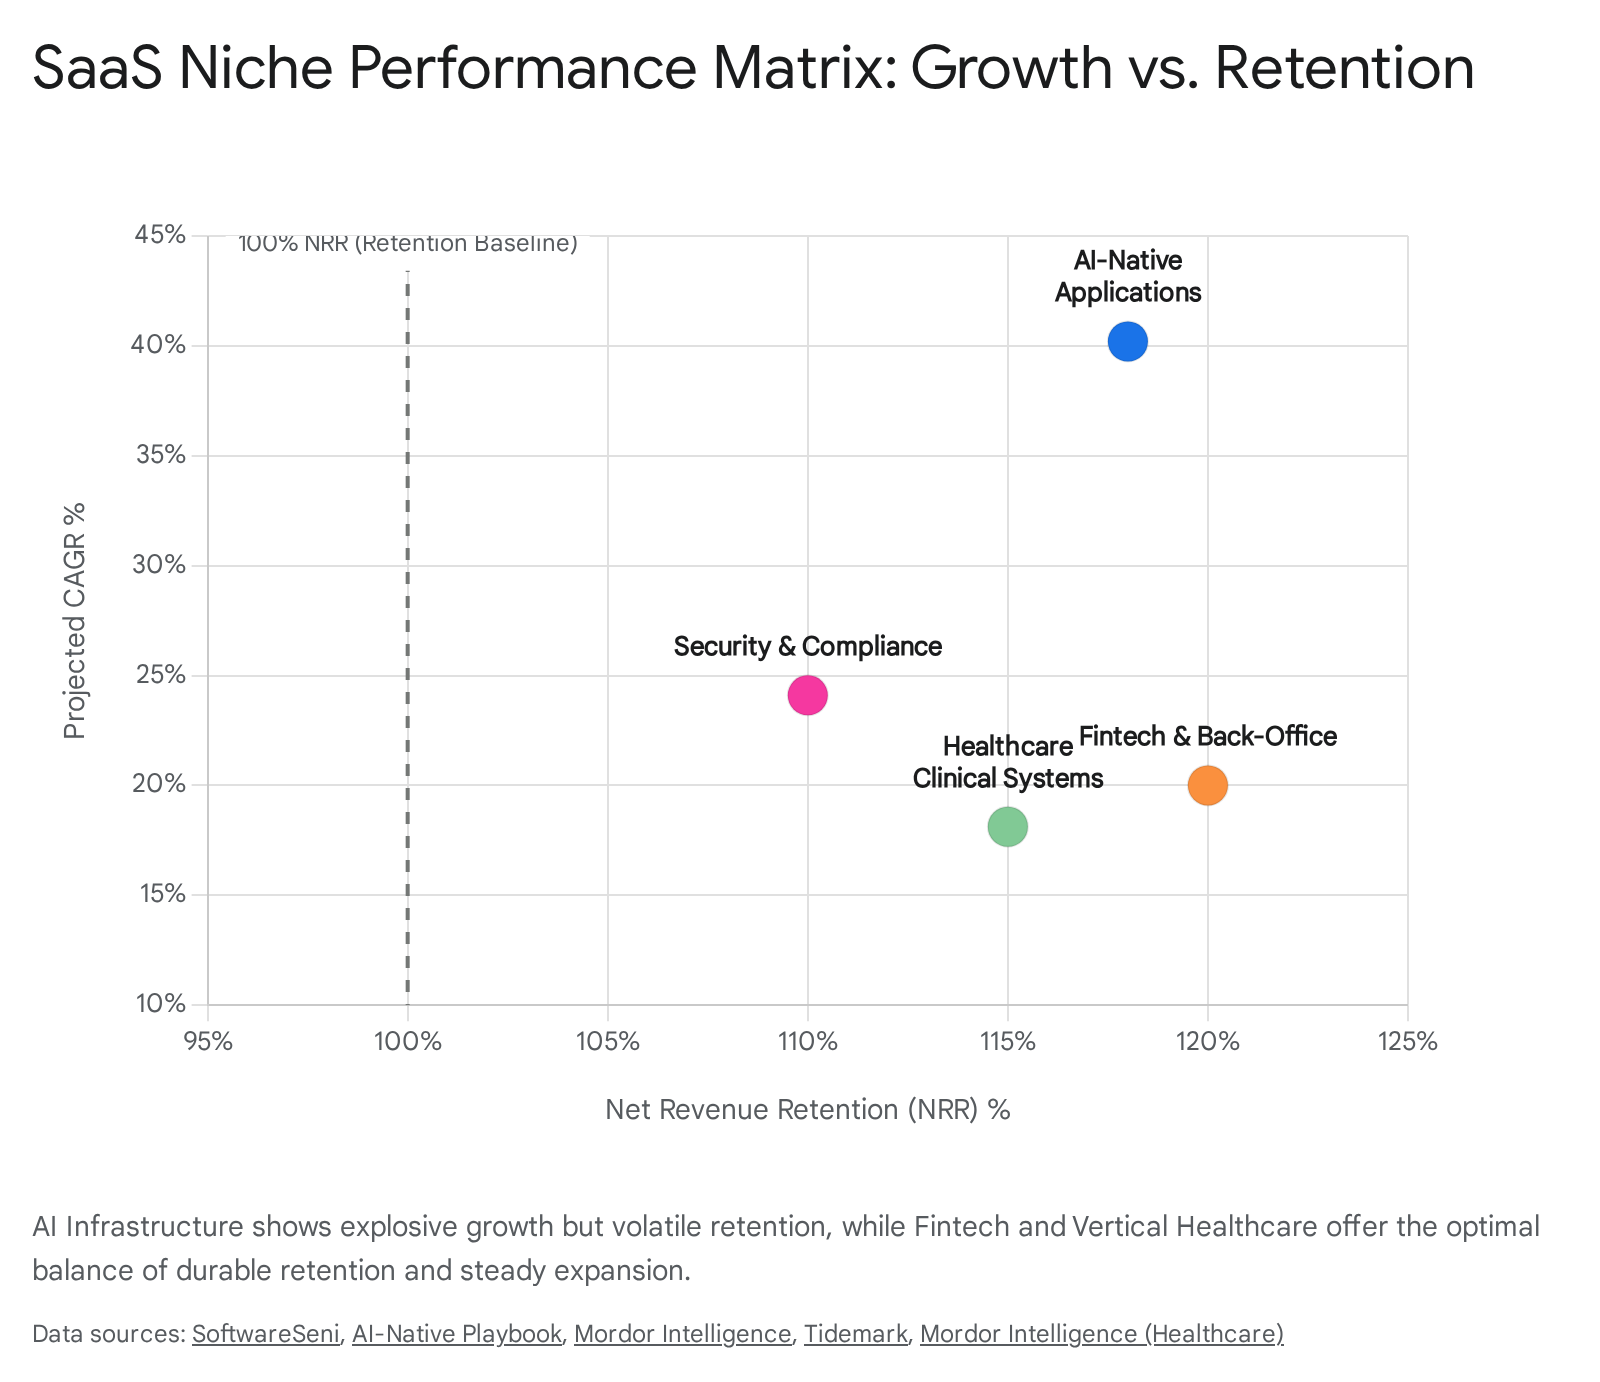
Top-Performing Niches by Growth and Retention
While the broader market faces macroeconomic headwinds, specific niches are capturing outsized shares of enterprise budgets. The highest-performing segments in 2026 are characterized by proprietary data moats, measurable labor-replacement economics, and strict alignment with regulatory compliance frameworks.
Artificial Intelligence Infrastructure and Applications
Artificial intelligence is not merely a feature addition in 2026; it is an architectural paradigm driving the highest growth rates in the software industry. Enterprise generative AI spending accelerated from $1.7 billion in 2023 to $37 billion by 2025, a 22-fold increase based on actual procurement data 23. The AI-created software market is expected to expand at a 40.2% compound annual growth rate through 2031, with AI infrastructure software spending projected to reach $230 billion in 2026 alone 2.
AI-native startups are capturing a disproportionate share of this spend, currently holding 63% of the application-layer market share compared to traditional incumbents 23. In specific enterprise sub-categories, AI-native solutions thoroughly dominate, holding 78% of sales software, 91% of finance and operations software, and 71% of product and engineering tools 23. Furthermore, the venture capital ecosystem heavily favors this niche; in the first quarter of 2026, enterprise software venture capital deal value reached a record $173 billion across 867 deals, vastly distorted by mega-rounds for core AI infrastructure firms 8.
The unit economics of AI-native platforms differ fundamentally from traditional operations. These companies are growing up to twice as fast as horizontal peers, with top-tier AI firms reaching $100 million in annual recurring revenue in 5.7 years, compared to the industry average of 7.5 years 1214. Development velocity is extreme, and revenue per employee frequently exceeds $238,000 early on, scaling to between $500,000 and $1 million at maturity 1219. However, retention presents unique challenges. While successful AI-native platforms utilizing outcome-based pricing achieve impressive net revenue retention of 118%, the broader AI application market suffers from high initial churn, sometimes recording 23% higher first-month churn than traditional peers 19. Many AI tools are easy to adopt but easy to cancel if they fail to integrate deeply into daily user workflows 4. Additionally, gross margins for AI companies are structurally lower, averaging around 25% due to intense compute and inference costs, requiring these firms to scale revenue rapidly to survive 5.
Healthcare Clinical and Operational Systems
Healthcare software has emerged as a powerhouse vertical, combining highly defensive recurring revenue with rapid scaling. The healthcare software-as-a-service market is projected to expand at a 16.94% compound annual growth rate, reaching $82.37 billion by 2031 25. Within this sector, clinical information systems are advancing at an even faster 18.12% compound annual growth rate 25.
This growth is propelled by cloud-native electronic health record replacement cycles, the automation of complex revenue-cycle management, and strict regulatory interoperability mandates that favor scalable, API-first subscription models 25. Health systems report significant measurable returns on investment, such as payment realization periods falling from 90 days to 40 days after adopting AI-enabled revenue-cycle tools 25.
What separates healthcare software in 2026 is its unprecedented operational velocity. The current generation of healthcare technology companies is leveraging clinical AI to scale to $100 million in annual recurring revenue in under five years - a milestone that traditionally took healthcare software companies over a decade 9. Furthermore, these companies boast unit economics and free cash flow margins that double those of standard high-growth horizontal software, driving public healthcare technology stocks to an 18% gain in 2025, significantly outpacing the broader emerging cloud indices 9.
Cybersecurity, Governance, and Compliance
As global digital infrastructure expands, security has transitioned from an IT overhead cost to a continuous operational imperative. For the third consecutive year, CIOs ranked cybersecurity and risk management as their absolute highest investment priority, with 47% planning direct spending increases in this category during 2026 10.
The security and compliance application layer is advancing at a 24.1% compound annual growth rate 28. This growth is structurally guaranteed by the escalating sophistication of cyber threats - with 92% of enterprises reporting at least one cyberattack in 2024 - and the implementation of rigorous global data regulations 25. Enterprises are actively replacing fragmented legacy systems with unified, zero-trust cloud stacks that offer built-in resilience and AI-driven preemptive threat detection 2511.
Additionally, the explosion of shadow AI usage has spawned a lucrative sub-niche in AI security and observability platforms. By 2028, it is projected that over 50% of enterprises will deploy dedicated AI security platforms to prevent data leakage, enforce usage policies, and protect against AI-specific risks such as prompt injection 12. Confidential computing is also experiencing massive uptake; by 2029, it is predicted that more than 75% of operations processed in untrusted infrastructure will be secured via hardware-based trusted execution environments 12.
Financial Services and Back-Office Operations
Software serving the financial services and back-office management sectors demonstrates the highest revenue durability in the entire market. According to 2025 vertical benchmark data, fintech-led companies maintain the strongest retention profiles across the industry, followed closely by back-office control point software 7.
The resilience of this niche lies in its absolute proximity to enterprise cash flow. When software facilitates payments, manages general ledgers, or dictates regulatory financial compliance, ripping and replacing the system poses an existential risk to the customer's core operations. Consequently, gross retention rates in this niche frequently exceed 95%, providing a highly stable foundation upon which to upsell additional modules and drive net revenue retention above 120% 97.
| Niche Category | Projected CAGR | Primary Growth Catalyst | Retention Profile | Key Vulnerability |
|---|---|---|---|---|
| AI-Native Apps & Infrastructure | ~40.2% | Labor replacement; workflow automation | High NRR (118%); High early churn | Low gross margins (high compute costs) |
| Security & Compliance | 24.1% | Escalating threat vectors; AI governance | Very High | Constant technological arms race |
| Healthcare Clinical Systems | 18.12% | Interoperability mandates; EHR modernization | High (Mission-critical infrastructure) | Long, complex enterprise sales cycles |
| Fintech & Back-Office | ~18.0% | Payments digitization; Multi-product expansion | Highest Industry Retention | Sensitive to macroeconomic corporate health |
Pricing Model Evolution and Revenue Architectures
The foundational pricing architecture of the software industry is evolving rapidly, shifting the metrics by which growth and retention are measured. Software vendors are deliberately pivoting away from predictable per-seat subscription models toward usage-based, capacity-based, or outcome-based pricing frameworks 1332.
The Decline of Pure Seat-Based Pricing
This pricing transition is largely catalyzed by the integration of artificial intelligence. As AI agents automate multi-step workflows previously handled by human employees, the economic value of the software shifts from the number of human logins to the volume of automated task output 14. In 2026, analysts estimate that as autonomous agent benchmarks pass the 60% labor replacement milestone, enterprise software spend is increasingly competing directly with traditional payroll budgets 14. A traditional annual charge of $1,200 per human seat is being replaced by charges of $10,000 for an automated workflow that assumes the equivalent workload 14.
Emergence of Usage and Outcome-Based Models
Currently, 41% of AI-native companies utilize usage or outcome-based pricing 19. Within the broader public markets, 51% of software companies now feature a usage-based component, up significantly from 27% in 2021 6. This model naturally aligns vendor revenue with the tangible value received by the client. Organizations employing usage-based models report a 24% higher net revenue retention compared to those relying strictly on per-seat licensing, as revenue automatically expands in tandem with client utilization 19.
However, this alignment of cost to value introduces high budgetary volatility for corporate IT departments. Forecasting expenses becomes highly complex when pricing fluctuates based on compute tokens or generative outcomes. In early 2026, 61% of IT leaders reported that unplanned price increases forced the cancellation of other planned technology projects, underscoring the friction inherent in transitioning to consumption models 13.
Regional Performance and Structural Advantages
The global distribution of software revenue and growth is undergoing a significant geographic rebalancing. While North America remains the dominant market leader in absolute terms, holding approximately 43% to 46.9% of global revenue and hosting roughly 17,000 software companies, the epicenter of growth is moving eastward 234.
North American Market Saturation and Scale
The North American market is projected to generate $141.06 billion in revenue in 2026 2. It leads in overall market maturity, benefiting from dense cloud infrastructure, high concentrations of technology innovators, and ubiquitous enterprise cloud adoption 2834. However, growth in this region is primarily driven by sophisticated enterprise transitions to hybrid cloud environments and the aggressive deployment of generative AI solutions, rather than first-time software adoption. The market is highly competitive, forcing vendors to engage in extensive merger and acquisition activity to secure market share; over 2,600 transactions closed in the prior year as private equity firms rolled up disparate vendors into comprehensive platforms 3.
Asia-Pacific Acceleration and Labor Dynamics
The Asia-Pacific region is currently the fastest-growing software market globally, with projected compound annual growth rates ranging between 18.7% and 20.79% through 2030 2835. By 2025, regional revenue was projected to reach $71.47 billion, driven by rapid mobile-first digitalization among small and medium-sized enterprises and vast government-led digital initiatives 3435. India has emerged as a major developmental hub, with its domestic software ecosystem growing at a 24% compound annual rate and hosting over 250 companies generating $10 million or more in annual recurring revenue 2.
The structural advantages driving this acceleration are deeply tied to regional macroeconomic challenges. Economies such as Japan, South Korea, and Singapore face acute population aging and severe structural labor shortages. Consequently, AI-enabled software and robotics are not viewed merely as productivity enhancements, but as essential mechanisms for economic survival and labor supplementation 15. This urgent domestic demand ensures sustained capital inflows and high adoption rates.
European Data Sovereignty and Regulatory Catalysts
In contrast to the labor-driven adoption in the Asia-Pacific, the European market is shaped by a highly complex regulatory environment. Europe commands approximately 25% of the global market, yet enterprise software spending per employee is more than double the global average, sitting at $248.80 compared to $115.70 globally 216.
The European ecosystem is defined by strict data sovereignty requirements. The proliferation of regulatory frameworks - including the General Data Protection Regulation, the Artificial Intelligence Act, the Network and Information Security Directive, and the Digital Operational Resilience Act - has forced enterprises to adopt highly secure, compliance-focused infrastructures 16.
Rather than stifling innovation, these regulations act as a powerful catalyst for domestic providers. Over 80% of European enterprises view regulatory frameworks as a baseline procurement standard rather than a hindrance 16. Solutions that natively offer localized data encryption, strict access control, risk reporting, and private cloud deployments experience immense demand 1617. As a result, European software companies demonstrate high predictability and improving profitability, with mature regional vendors possessing annual recurring revenue above €50 million frequently achieving gross margins of 80% 16.
| Region | Global Revenue Share | Projected CAGR | Primary Structural Growth Driver |
|---|---|---|---|
| North America | ~43.0% - 46.9% | Moderate | High market maturity; AI integration; Vendor consolidation |
| Asia-Pacific | ~15.0% - 20.0% | 18.7% - 20.8% | SME digitalization; Demographic labor shortages driving automation |
| Europe | ~25.0% | 24.0% (Historical) | Data sovereignty mandates; Strict regulatory compliance standards |