Scalable B2B software go-to-market strategies for 2026
The architecture of business-to-business (B2B) software growth has undergone a systemic and irreversible recalibration. The previous decade's foundational go-to-market (GTM) strategy - characterized by an abundance of cheap venture capital, volume-based digital acquisition, and a binary organizational choice between product-led and sales-led funnels - has collapsed under the weight of saturated digital channels and heightened capital scrutiny 1. In 2026, the go-to-market motions that successfully scale are defined by rigid capital efficiency, blended hybrid architectures, and a heavy reliance on existing ecosystems and customer bases 1232.
This research report examines the quantitative data defining go-to-market strategies in 2026, analyzing the benchmarks, operational shifts, and structural economics of modern software acquisition and retention. The analysis spans growth metrics, customer acquisition costs, retention dynamics, and the tactical evolution of product-led, ecosystem-led, and outbound sales motions.
The Macroeconomic Baseline For B2B Software
The prevailing narrative of software growth is no longer defined by hyper-expansion at all costs, but rather by the operational discipline required to generate profitable and durable annual recurring revenue (ARR).
Growth Deceleration And Market Capitalization
Overall growth rates across the SaaS industry have steadily decelerated since their peak in 2021. The global SaaS market reached $315.68 billion in 2025 and is projected to reach $1.48 trillion by 2034, functioning at an 18.7% compound annual growth rate (CAGR) 3. North America continues to command 46.9% of that total market share 3. However, individual company growth expectations have been severely moderated.
In 2024, the median growth rate for private B2B SaaS companies landed at 26%, notably lower than the 35% growth target that organizations had aggressively forecasted for the year 3456. The top quartile of performers, which historically maintained growth rates exceeding 60%, has compressed to a median of roughly 50% 356. For public SaaS entities, median next-twelve-months (NTM) revenue growth settled at 19%, down from 24% in 2023 7. Growth endurance - the rate at which year-over-year growth is retained as a company scales - has fallen from a historical average of 80% to approximately 65%, indicating that companies are finding it structurally harder to maintain momentum as baseline revenue increases 8.
Despite this deceleration, public SaaS market capitalization recovered to $1.92 trillion by the end of Q1 2026 7. Valuations have decoupled from raw top-line growth. The median enterprise-value-to-NTM-revenue multiple stands at 7.4x, but this median masks a sharp divergence based on capital efficiency 7.
The Implementation Of The Rule Of 40
The deceleration in absolute growth has elevated the "Rule of 40" - the sum of a company's revenue growth rate and its free cash flow (FCF) or EBITDA margin - from a theoretical benchmark to a strict operational mandate 191011. In 2026, the median Rule of 40 score across public SaaS companies sits at 38, with top-decile performers reaching 67 7.
High-performing private companies are increasingly achieving Rule of 40 compliance not through explosive top-line expansion, but through drastic improvements in profit margins. Data indicates that equity-backed companies in the $1M - $3M ARR tier improved their median profitability from -53% in 2023 to -8% in 2025 3. A company growing 60% with negative 10% margins achieves a healthy score of 50, but a company growing 30% with 10% margins sits precisely on the threshold 11. Companies failing to meet this threshold - specifically those exhibiting low net revenue retention combined with poor acquisition efficiency - report growth rates as low as 10% and Rule of 40 scores hovering near 5%, facing severe down-round risks 912.
Funding Archetypes And Spending Ratios
Operational metrics diverge sharply depending on a company's capitalization structure. Venture capital (VC) backed companies, private equity (PE) backed firms, and bootstrapped entities display different tolerances for burn rates and distinct allocations for sales and marketing (S&M).
Overall, median S&M spending accounts for 37% of revenue across the industry 8. However, VC-backed companies systematically over-index, spending 47% of revenue on S&M, compared to 33% for PE-backed firms 56810. Bootstrapped companies operating between $3M and $20M ARR demonstrate the highest degree of fiscal discipline. These self-funded entities exhibit a median growth rate of 15% (with the top decile reaching 42.3%), yet 85% of them operate at or near breakeven 813. Conversely, over half of VC-backed SaaS companies continue to operate at a significant net loss, relying on equity premiums to fund general and administrative (G&A) spending that runs 80% higher than their bootstrapped peers 8.
Customer Acquisition Cost Economics
The fundamental physics of software distribution have not changed, but the economic friction involved in capturing digital attention has intensified dramatically. The cost of acquiring B2B software customers has reached unprecedented levels, forcing a reevaluation of all inbound and outbound pipelines.
The Inflation Of Acquisition Expenditure
In 2024, the "New CAC Ratio" - the amount of gross sales and marketing expenditure required to generate one dollar of net-new customer ARR - climbed 14% year-over-year to a median of $2.00 36. This signifies that the average SaaS firm spends two dollars in acquisition costs for every dollar of newly acquired recurring revenue. Fourth-quartile laggards spend up to $2.82 per dollar of new ARR, a level of inefficiency that practically guarantees stalled growth if sustained over multiple quarters 3610.
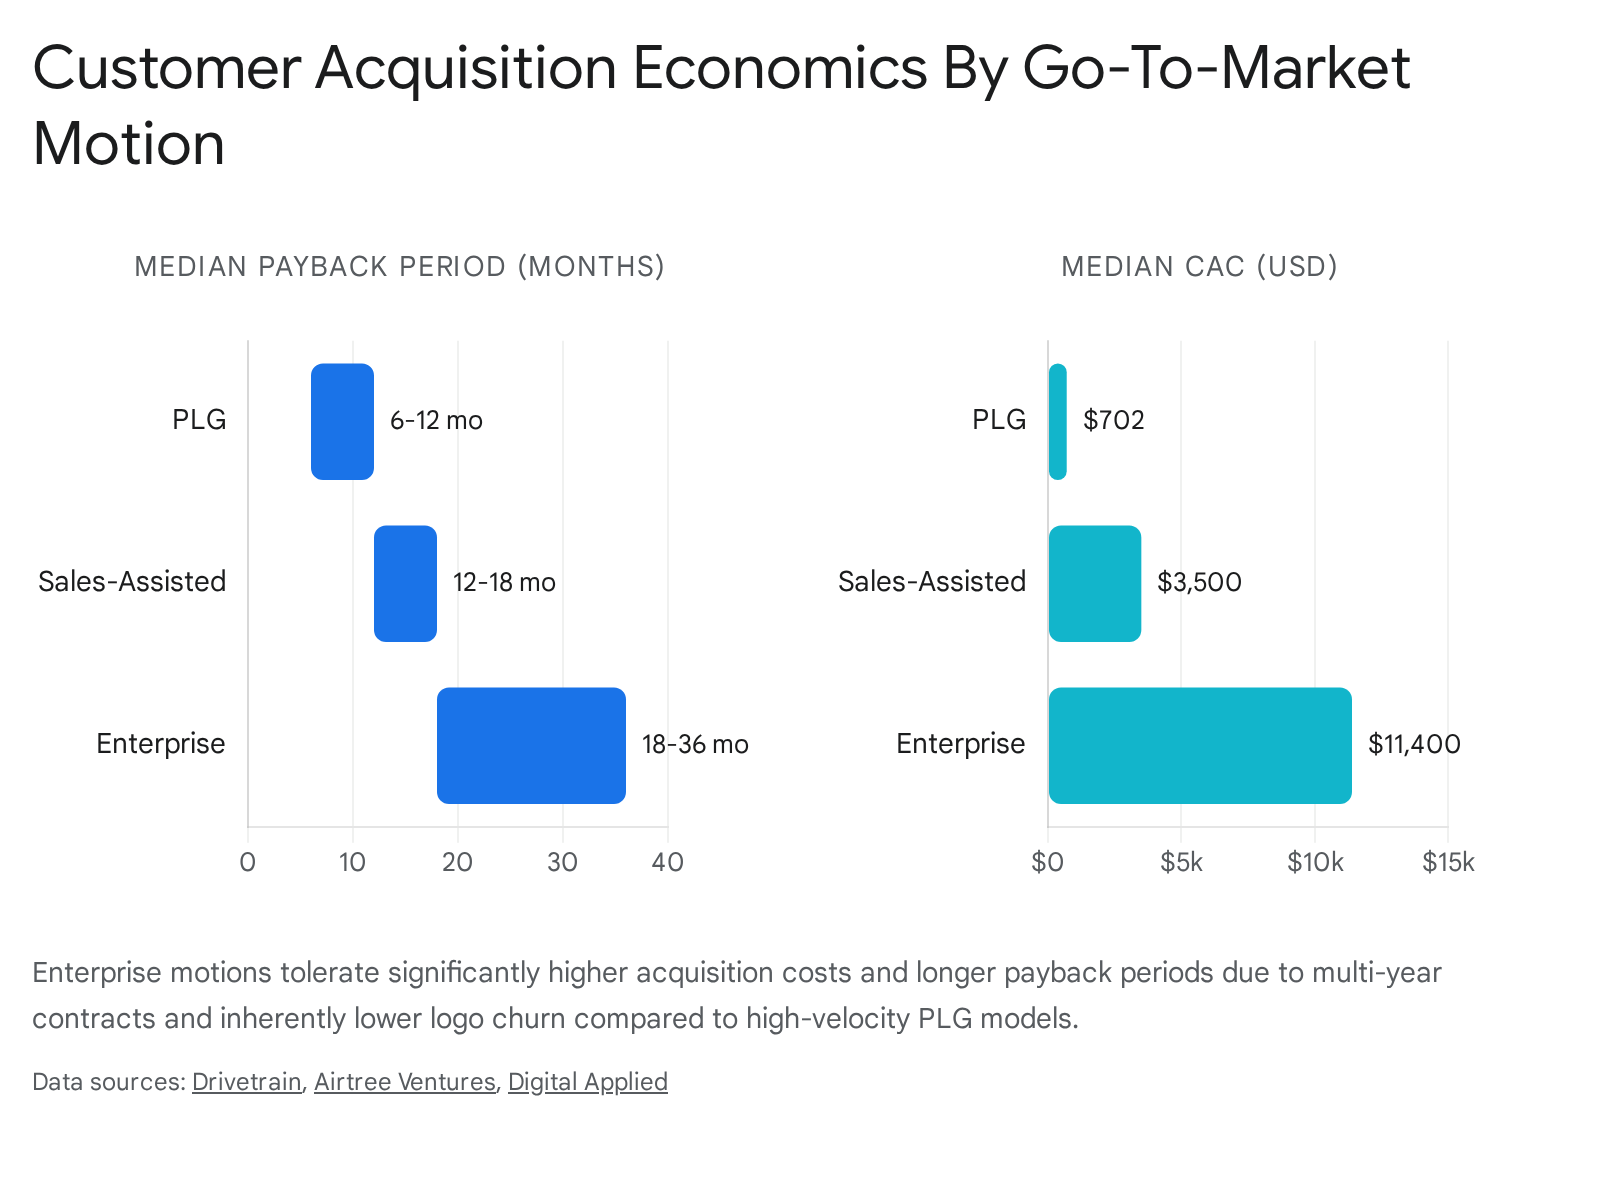
Raw Customer Acquisition Cost (CAC) metrics vary immensely based on the target customer segment. A blended industry average indicates a CAC of approximately $1,200 per customer, but this figure obscures the spectrum of acquisition costs 12. Self-serve SMB products often acquire users for a median CAC of $702 1417. Conversely, enterprise platforms relying on field sales and account-based marketing (ABM) face median CACs of $11,400 to $12,000 1417. This inflation is primarily driven by rising channel costs; digital advertising costs have surged, with Google Ads cost-per-lead increasing by 5.13% to £70.11 on average, and non-branded search cost-per-click (CPC) rising by 29% 15.
Customer Acquisition Cost Payback Trajectories
Because of inflated acquisition costs, CAC Payback periods have stretched. Across $5M - $50M ARR companies, the median blended CAC payback extended to 18 months by 2026, up from 15 months in 2023 714. The CAC Payback Period is calculated by dividing the fully loaded CAC by the monthly ARPU multiplied by the gross margin 17.
Payback expectations are heavily dictated by the specific go-to-market motion and average contract value (ACV). For sub-$5,000 ACV deals, the median payback is 8 to 12 months 91216. For mid-market deals ranging from $5,000 to $25,000 ACV, payback expectations shift to 14 to 18 months. Enterprise contracts exceeding $50,000 ACV regularly command payback periods of 24 months or longer 91216.
These extended payback horizons are only financially viable if the company maintains gross margins in excess of 75% and ensures long-term customer retention 349. Investors evaluate this sustainability through the LTV:CAC ratio. A healthy SaaS business targets a ratio between 3:1 and 5:1. Ratios dropping below 3:1 indicate cash incineration, while ratios exceeding 6:1 often signal that an organization is under-investing in top-of-funnel growth and leaving market share vulnerable to competitors 111716.
Revenue Per Employee As An Operational Barometer
As boards demand a clearer path to profitability, revenue per employee (ARR/FTE) serves as an un-gamable metric of operational efficiency, severely penalizing organizational bloat. In 2026, the overall median revenue per employee for private B2B SaaS sits between $129,724 and $167,500 417.
This metric scales systematically with company maturity. Startups in the $1M - $3M ARR tier average roughly $99,800 per employee 4. Once an organization establishes repeatable GTM motions, leverage increases. Established platforms in the $50M - $100M ARR segment have pushed revenue per employee to $200,000, and those scaling above $100M ARR frequently generate upwards of $300,000 per employee 456.
Product architecture and vertical focus deeply impact this efficiency. Vertical SaaS companies consistently outperform their horizontal counterparts, maintaining a median revenue per employee of $187,500 compared to $158,700 for horizontal applications 17. This nearly $30,000 delta is driven by the hyper-targeted nature of verticalized GTM efforts, which require fewer marketing resources for broad awareness and encounter less friction during the sales cycle due to deep industry alignment 17.
Unit Economics By Industry Segment
Customer acquisition and efficiency metrics do not apply uniformly across all software categories. Benchmarking requires vertical-specific context.
For instance, Financial Technology (Fintech) SaaS typically commands higher Average Revenue Per User (ARPU) ranging from $1,000 to $5,000 per month, but suffers from longer sales cycles and higher monthly churn (3% to 5%) due to intense market competition 18. Human Resources (HR) Technology exhibits moderate ARPU ($100 to $500 per month) but benefits from strong retention, typically boasting NRR between 105% and 120% due to the high switching costs of benefits administration platforms 18. Security SaaS operates as a premium segment, demanding gross margins between 75% and 85%, extremely low monthly churn (1.5% to 3%), and NRR consistently exceeding 110% 18. Developer Tools and DevOps platforms rely heavily on usage-based components and high switching costs to secure strong net retention, though they often require long technical evaluation periods resulting in CAC payback periods averaging 9.4 months 1819.
| SaaS Vertical | Median CAC Payback | Monthly Churn | Gross Margin Target | LTV:CAC Target |
|---|---|---|---|---|
| Education & Learning | 3.8 Months | Variable | Variable | > 4.0x |
| Productivity & Tools | 6.4 Months | High | 70% - 80% | > 3.0x |
| Marketing & Sales | 7.8 Months | 4% - 7% | 65% - 75% | > 3.0x |
| Finance & Fintech | 8.2 Months | 3% - 5% | 65% - 80% | > 4.0x |
| Security & DevOps | 9.0+ Months | 1.5% - 3% | 75% - 85% | > 4.0x |
| HR & Recruiting | 10.6 Months | 2% - 4% | 70% - 80% | > 3.5x |
Data synthesized from vertical-specific performance indices and CAC recovery tracking platforms 1819.
Net Revenue Retention And Base Erosion
Because new logo acquisition has become prohibitively expensive, Net Revenue Retention (NRR) has supplanted top-line growth as the primary determinant of enterprise value in B2B SaaS. Top-quartile SaaS companies achieving NRR rates of 113% trade at median enterprise-value-to-revenue multiples of 24x, whereas bottom-quartile companies with 98% NRR trade at a heavily discounted 5x multiple 2320.
The Divergence Of Net And Gross Retention
The SaaS industry has historically obsessed over NRR - the percentage of revenue retained and expanded from an existing customer cohort. However, this focus often neglected Gross Revenue Retention (GRR), which measures revenue retention excluding all upsells, cross-sells, and price increases.
In 2026, median NRR sits at a seemingly healthy 101%, indicating that the average SaaS company is slightly net-positive on existing accounts 3569. However, longitudinal data exposes a quiet but persistent decay: median GRR dropped from 90% in 2021 to 88% in 2026 325. The divergence between NRR and GRR indicates that expansion revenue is increasingly masking core logo churn. A company replacing leaking baseline revenue with a larger volume of upsells to power-users is structurally fragile. GRR is therefore the more critical diagnostic metric for underlying product-market fit; if older cohorts churn at the same rate as newly acquired cohorts, product entrenchment has failed 32621.
Customer Segment Retention Variances
Retention expectations fluctuate drastically depending on the target customer segment. The assumption that 100% NRR is universally "healthy" is factually incorrect when segment-level data is analyzed.
Across 939 tracked B2B SaaS companies, Enterprise SaaS (defined as ACV above $100,000) posts a median NRR of 118% 1220. Mid-market products ($25,000 to $100,000 ACV) maintain a median NRR of 108% 1220. Conversely, SMB-focused software products sit at a median NRR of 97% 1220. This means the median SMB SaaS company is actively shrinking within its existing user base and must aggressively spend on new acquisition simply to replace lost revenue. Furthermore, subscriber count limits NRR potential; companies with under 1,500 subscribers often achieve 100%+ NRR, but as subscriber bases swell beyond 12,000, top-quartile NRR naturally drops toward 76% due to the mathematical limits of continuous expansion 10.
The Expansion Revenue Mandate
Slower new logo growth has forced companies to rely on expansion revenue as the core commercial engine. In 2026, expansion Annual Recurring Revenue (ARR) accounts for 40% of all new ARR generated by the median SaaS firm, a 5% increase from 2024 45612. For mature companies exceeding $50M ARR, expansion revenue now constitutes over 50% of total new ARR 5615.
The underlying economics justify this shift. Expanding an existing customer contract from $1,000 to $1,500 in monthly recurring revenue costs approximately $500 in combined sales and customer success effort - an ROI of nearly 20:1. Acquiring a net-new customer at that same MRR tier yields an ROI closer to 2:1 20. Consequently, product engineering allocations have shifted; leading firms now dedicate roughly 40% of their roadmap to expansion features, 30% to retention features, and only 30% to net-new acquisition capabilities 20.
Retention Challenges In Artificial Intelligence Products
Despite explosive top-line growth, AI-native SaaS companies face acute retention crises that threaten long-term viability. While leading AI-native platforms reach $100M ARR in a record 5.7 years (compared to 7.5 to 7.8 years for traditional SaaS) 2, their retention benchmarks remain dangerously low.
Aggregate reports indicate median NRR for purely AI-native applications is hovering around 48%, with GRR at a dismal 40% 20. For context, the broader B2B SaaS median NRR is 101% 36. This extreme volatility reflects a deficit in durable product-market fit. The low integration friction and impressive initial utility that make AI tools easy to adopt also render them highly susceptible to churn when novelty fades, or when a competing foundational model offers a marginal technological improvement 20. The switching costs for AI wrappers are virtually nonexistent, making defensive moats difficult to establish.
The Convergence Of Go-To-Market Motions
The decade-long ideological debate between Product-Led Growth (PLG) and Sales-Led Growth (SLG) has effectively concluded. The empirical evidence from 2026 heavily favors a hybrid architecture known as Product-Led Sales (PLS).
Channel Proliferation And The End Of Single-Threaded Growth
Modern GTM strategy is defined by multi-channel orchestration. Inbound marketing remains the most popular primary motion, cited by 23% of GTM leaders, followed closely by direct Outbound (19%) and Account-Based GTM (18%) 28. However, reliance on a single primary channel is rare. The average software company currently operates five core GTM channels simultaneously, while running an additional 5.5 experimental channels in parallel 282930. For scaleups above $10M ARR, this channel fatigue is severe, with an average of 6.8 core channels in operation 29.
The Structural Ceiling Of Pure Product-Led Growth
Pure PLG relies on the product interface to drive acquisition, activation, and expansion entirely through self-service mechanics, theoretically bypassing the need for human sales personnel. While highly capital-efficient in the sub-$10M ARR phase, pure PLG struggles severely to penetrate the enterprise layer.
When average contract values scale beyond $10,000 to $25,000, organizational procurement complexity, legal compliance, security reviews, and the necessity of multi-stakeholder consensus render self-service checkout obsolete 313233. Companies attempting to cross the $50M ARR threshold exclusively through self-service inevitably experience stalled growth. Even category-defining, AI-powered PLG products like Cursor - which reached $200M ARR rapidly through product virality - have had to construct traditional enterprise sales teams to push beyond the mid-market ceiling and secure institutional revenue 3322.
Product-Led Sales As The Hybrid Baseline
In the hybrid PLS model, PLG mechanics (freemium tiers, short trials, self-serve onboarding) are utilized to capture the top of the funnel and dominate the SMB segment at low cost. Simultaneously, a dedicated sales-assist layer targets expansion within high-usage accounts and pursues complex enterprise deals 223.
The financial data validates this convergence unequivocally. According to 2024 - 2025 SaaS benchmarks, 67% of hybrid PLG+SLG companies achieve their net revenue retention targets, compared to only 58% of pure-PLG companies 2. Hybrid businesses utilize sales-assist personnel to manually cultivate accounts demonstrating high product usage. Pure PLG companies, lacking this human intervention layer, leave high-potential accounts to expand - or quietly churn - entirely on their own, resulting in inferior NRR 2. Furthermore, product-led sales companies are twice as likely to achieve 100%+ year-over-year revenue growth as their purely sales-led counterparts 2.
| Go-To-Market Characteristic | Pure Product-Led Growth (PLG) | Pure Sales-Led Growth (SLG) | Hybrid / Product-Led Sales (PLS) |
|---|---|---|---|
| Optimal Target ACV | < $5,000 - $10,000 | > $25,000 | Variable by tiered segment |
| Primary Growth Driver | Virality, Self-serve Conversion | Outbound, SDRs, Field Sales | Self-serve entry + Sales-assisted expansion |
| Median CAC Payback | 6 - 12 Months | 18 - 36 Months | 12 - 18 Months |
| Typical Conversion Metric | 3% - 9% (Free-to-Paid) | N/A | 15% - 20% (PQL-to-Paid) |
| Sales Cycle Duration | Minutes to Days | 40 - 180+ Days | Varies (Fast landing, structured expansion) |
Data compiled from OpenView, Iconiq, and digital benchmark reports comparing GTM architectures 2714323637.
Activation Bottlenecks And Freemium Evolution
Within any PLG or hybrid motion, the activation rate - the percentage of new users who experience the product's core value proposition, or "aha moment" - is the primary bottleneck. Most B2B PLG funnels currently operate with a 20% to 40% activation rate, leaving up to 80% of acquired signups as "zombie users" who abandon the application without interacting with its core utility 3238. Only 34% of PLG companies actively track this critical metric, despite top-performing software firms deliberately engineering their applications to push activation rates above 60% 3238.
To compress time-to-value and force activation, pricing and packaging structures have evolved dramatically. Trial durations are shrinking across the industry; median software trials are moving from 30 days down to 14 days, with AI-native tools contracting to 7 days 39. Data indicates that 7-day trials convert at 40.4%, compared to a 30.6% conversion rate for trials extending past 60 days 153239. Concurrently, indefinite freemium models are being rolled back or fundamentally altered. Nearly half of SaaS companies altering their freemium tiers in 2025 replaced free plans with time-boxed trials or sandbox environments 39. Usage-capped, credit-based pricing - which seamlessly accommodates AI token consumption - grew 126% in adoption across 2025, acting as the purest expression of hybrid monetization 2239.
Agentic Users And Headless Activation
Looking toward the immediate future of PLG, the nature of the "user" is undergoing a paradigm shift from human operators to autonomous AI agents. For API-first and developer-oriented platforms, massive percentages of new signups and API calls are generated by AI systems acting on behalf of organizations (e.g., Netlify reports 80% of new signups are AI agents) 2.
This necessitates a transition in GTM measurement. An AI agent does not require an intuitive user interface or a step-by-step onboarding walkthrough; it requires an API that returns structured value in milliseconds 38. Organizations building for agent-as-user are engineering "headless" PLG mechanics, prioritizing API latency, developer documentation legibility, and algorithmic integration over traditional UI activation events 238.
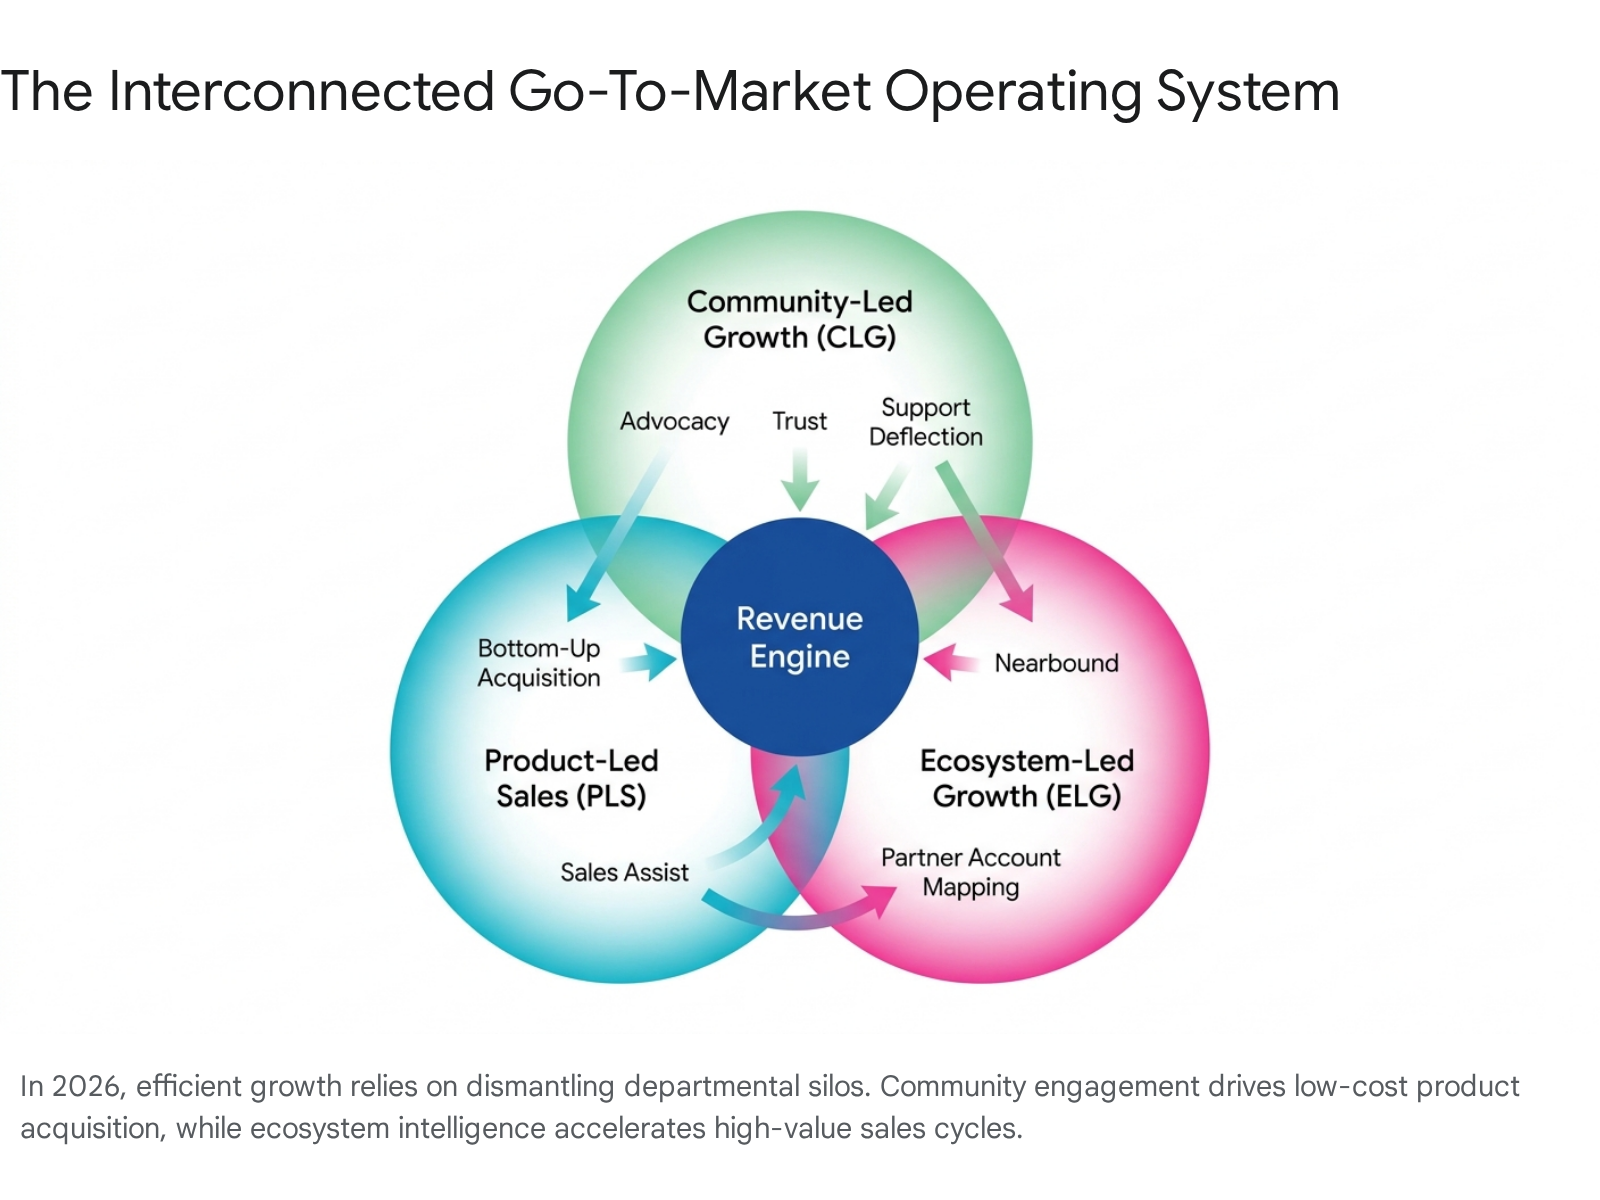
Ecosystem-Led Growth Architecture
As digital advertising costs inflate and cold outbound efficacy plummets, B2B SaaS companies have turned to their partner networks to source, qualify, and close pipeline. Ecosystem-Led Growth (ELG) is a systematic, data-driven methodology that treats a company's network of integration, service, and technology partners as the primary lever for GTM distribution, moving far beyond traditional co-branded marketing webinars 340.
Partner Account Mapping And Nearbound Selling
The operational engine of ELG is automated account mapping at scale. Utilizing secure ecosystem platforms (such as Crossbeam or PartnerTap), vendors continuously cross-reference their CRM data with their partners' databases to identify overlapping prospects, open opportunities, and shared customers without compromising underlying data privacy 340.
When a strategic overlap is identified, the GTM team generates an Ecosystem-Qualified Lead (EQL). Unlike a traditional Marketing Qualified Lead (MQL) generated by passive content consumption, an EQL carries contextual trust; it indicates that a target account is currently, successfully utilizing a partner's technology 3. The sales representative then leverages this shared connection to initiate a "Nearbound" sales motion. Rather than pitching cold, the seller requests a warm introduction from the partner, shares account intelligence regarding the buyer's tech stack, or co-sells a pre-integrated joint solution 340.
Quantifiable Performance Of Ecosystem Overlays
Historically, partner-sourced pipeline was relegated to a secondary status because attribution was highly subjective. In 2026, modern attribution technology has definitively quantified the outsized impact of ELG.
Extensive data spanning 2,100 B2B vendors reveals that the median partner-sourced revenue share sits at 24% for SaaS companies, climbing to 41% for hardware providers and 58% for services-led businesses 41. The operational leverage is massive: ecosystem-led deal overlays win 3.6x more often than cold-direct deals 41. Opportunities incorporating partner intelligence and warm introductions convert at a 53% higher rate, close 28 to 46 days faster than standard sales cycles, and yield average deal sizes that are approximately 40% larger due to the perceived value of an integrated solution 342.
The Ecosystem Technology Stack
The infrastructure required to support this interconnected motion has firmly crossed the adoption chasm. Partner Relationship Management (PRM) platforms, which facilitate deal registration, revenue attribution, and partner enablement, have achieved a 62% adoption rate among companies with over $25M in ARR, up drastically from 39% in 2023 41.
Furthermore, artificial intelligence is accelerating the efficiency of partner channels. Approximately 38% of channel teams are currently piloting AI-driven tools for partner-content personalization, while others deploy AI for automated co-sell deal-matching (19%) and partner-onboarding agents (24%) 41. This ensures that ecosystem data does not remain siloed within the partnerships team, but is actively surfaced to Account Executives directly within their CRM workflows.
Community-Led And Customer-Led Operating Models
Operating parallel to Ecosystem-Led Growth are Community-Led Growth (CLG) and Customer-Led Growth strategies. These motions are a direct response to changing buyer behavior, recognizing that the vast majority of modern B2B vendor research occurs in private, untrackable channels - Slack groups, Reddit forums, peer-to-peer review sites, and "dark social" - long before a buyer ever fills out a lead capture form or engages a sales representative 404344.
Architecting Organic Advocacy
Community-Led Growth focuses on fostering a dedicated, non-transactional digital ecosystem where users can educate, troubleshoot, and support one another 434445. Rather than pushing users down a rigid sales funnel, CLG builds a platform where product advocates create high-value, user-generated content (troubleshooting threads, playbooks, templates).
This motion serves as an unparalleled multiplier for acquisition efficiency. Industry analyses estimate that companies with active, moderated communities grow revenue 2.1x faster than peers lacking community infrastructure 45. This growth is heavily subsidized by a 32% reduction in overall customer acquisition costs, as community forums act as organic SEO engines, deflect baseline customer support tickets, and accelerate the trust-building phase of the buyer journey through peer validation 444546.
Customer Lifetime Value And Advocacy Attribution
Customer-Led Growth shifts the organizational center of gravity away from net-new sales pipelines and toward post-sale advocacy. By treating Net Revenue Retention (NRR) and the Customer Referral Rate as primary growth KPIs, Customer-Led models build expansion pipelines via advocacy participation 47.
The success of CLG is measured through specific business impact metrics, such as Community-Attributed Revenue (CAR) - revenue tied to organizations whose members engaged in community forums prior to appearing in the CRM - and Product Qualified Leads (PQLs) sourced directly from community interactions 43. Customers engaged in active community environments generally demonstrate a 30% to 46% higher Customer Lifetime Value (CLTV) due to deeper product entrenchment, shared knowledge, and a significantly lower propensity to churn 4546.
Outbound Acquisition And Artificial Intelligence Workflows
While organic, product-led, ecosystem, and community channels have gained strategic primacy, direct outbound sales remains an absolute necessity for proactively capturing named enterprise pipeline. However, the unit economics, technological requirements, and baseline expectations for outbound have degraded and evolved substantially.
The Degradation Of Traditional Outbound Engagement
Cold outbound outreach in 2026 is fighting unprecedented friction. Inboxes are fortified by stringent spam algorithms (including aggressive filtering by Google and Apple Mail Privacy Protection), and executive buyer fatigue is at an all-time high 3748.
The aggregate statistics paint a stark picture of the death of volume-based outreach:
| Outbound Metric | Average / Median Performance | Top Quartile / Elite Performance |
|---|---|---|
| Cold Email Open Rate | 20% - 30% (often inflated by bots) | 40% - 55%+ (Highly targeted) |
| Cold Email Reply Rate | 1.0% - 3.4% | 5.5% - 10.7%+ |
| Positive Reply Rate | 0.5% - 1.5% | 2.0% - 4.0% |
| Meeting Booked Rate | 0.3% - 1.0% | 2.0% - 3.0% |
| Opportunity-to-Close (Win Rate) | 22% | 30%+ |
Data aggregated from 2025/2026 cold email platform benchmarks analyzing billions of outbound touches 37484950.
Given that a positive reply rate sits around 1% for the average organization, traditional "spray and pray" methodologies are mathematically unsustainable. Sales Development Representatives (SDRs) relying on generic messaging frequently require thousands of automated touches to secure a single meeting, severely inflating CAC and damaging domain reputation 37. Only 27% to 30% of B2B sales reps hit quota in 2024, confirming a systemic failure in traditional outbound playbooks 37.
Sequence Mathematics And Multi-Threading
To combat declining conversion rates, outbound sequences have become highly structured and multi-threaded. Research confirms that reliance on a single touchpoint is disastrous; 65% to 70% of potential replies occur on follow-up touches rather than the initial email 48. The first email generates roughly 30% to 35% of total replies, the second generates 25% to 30%, and touches four and beyond still contribute 15% to 20% of engagement 48. Furthermore, sequences that blend email with LinkedIn touches consistently outperform email-only sequences by 15% to 25% in positive reply rates 48.
Intent-Based Prioritization And Signal Routing
Top-performing GTM teams have pivoted from pure volume to extreme precision. Signal-based outbound utilizes behavioral data, hiring trends, ecosystem overlaps, funding rounds, and content consumption intent to trigger personalized outreach at exact moments of buyer vulnerability 3751.
Organizations utilizing hyper-segmented, intent-driven plays report booking rates of 5% to 8% - drastically outperforming the 1% baseline 37. Precision targeting also demands narrower ideal customer profiles (ICPs); generic personas like "marketing leaders" are being replaced by hyper-specific targets such as "growth marketing managers at Series A SaaS companies struggling with attribution," yielding up to 40% higher reply rates 50. Interestingly, founder-led outreach consistently outperforms SDR-led outreach by 30% to 50% in reply volume, proving that sophisticated buyers respond preferentially to perceived authority and authentic expertise over automated sales cadences 50.
Artificial Intelligence Deflation Of Acquisition Costs
Artificial Intelligence is creating a profound divide between organizations capable of engineering intelligent workflows and those utilizing AI merely for superficial content generation.
While general AI deployment is ubiquitous (91% of GTM teams use general tools like ChatGPT), actual ROI is highly concentrated among a minority of organizations 2830. Currently, 53% of leaders see little to no impact from their AI investments because they fail to connect internal context and proprietary data to their LLM instances 52.
However, companies successfully integrating specialized AI agents into lifecycle marketing, deeply personalized copywriting, and programmatic SEO (Answer Engine Optimization) are witnessing immense efficiency gains. For these elite teams, AI autonomous engines are creating up to 25% of overall pipeline and achieving 50%+ open rates on hyper-personalized emails 52. Across marketing departments, the median content output per marketer has scaled by 4.3x, and SDR research time per account has plummeted by 41% (dropping from 22 minutes to 13 minutes per account) 7.
Most importantly, these operational efficiencies translate directly into financial performance. SaaS organizations adopting AI-assisted GTM architecture report median CAC payback periods that are 3.8 to 5.4 months shorter than non-adopting competitors 7. As Answer Engine Optimization (AEO) begins generating up to 13% of high-intent leads for forward-thinking platforms, AI is fundamentally rewiring how pipeline is sourced and closed 29.
Conclusion
The definitive conclusion from the 2026 B2B software data is that isolated, single-channel growth strategies are obsolete. Organizations utilizing purely sales-led models are drowning in inflated customer acquisition costs, while those relying exclusively on product-led funnels are failing to penetrate enterprise revenue ceilings.
The strategy that scales is fundamentally blended and ecosystem-aware.
It demands a hybrid Product-Led Sales foundation to separate low-cost, self-serve acquisition from high-touch, human-assisted expansion. It requires the deep integration of Ecosystem-Led account intelligence to bypass outbound friction and accelerate win rates. It necessitates Community-Led models to subsidize acquisition costs through peer advocacy. Ultimately, with growth rates stabilizing and the era of endless venture subsidies concluded, go-to-market excellence is measured entirely by capital efficiency: preserving gross margins above 75%, pushing net revenue retention past 110%, and recovering acquisition costs in under 15 months. Businesses that successfully engineer their commercial operations to meet these stringent benchmarks will dictate the future of the software economy.