B2B SaaS performance and growth benchmarks 2026
The business-to-business (B2B) software-as-a-service (SaaS) sector in 2026 operates within a stabilized but relentlessly disciplined macroeconomic environment. Following the hyper-growth peaks of the early 2020s and the subsequent market corrections of 2023 and 2024, the industry has fundamentally re-architected its performance standards 123. Capital efficiency, measurable revenue retention, and rigorous unit economics have definitively superseded absolute revenue growth as the primary determinants of enterprise valuation 45. Simultaneously, the proliferation of AI-native software architectures has introduced a parallel benchmark ecosystem, characterized by unprecedented growth velocities but substantially compressed gross margins 46.
The global SaaS market reached an estimated valuation of $390 billion to $408 billion in 2025 and is projected to expand to approximately $465 billion to $492 billion in 2026, advancing toward a projected $1.4 trillion to $1.5 trillion by the early 2030s, driven by a compound annual growth rate (CAGR) exceeding 18% 4789. Enterprise software spend broadly is forecast to grow 15.2% to reach $1.43 trillion in 2026, pushing global IT spending past the $6 trillion threshold for the first time 10. However, the underlying operational metrics required to capture and retain this market share have tightened considerably. This report details the definitive 2026 benchmarks for B2B SaaS growth, retention, acquisition economics, go-to-market strategies, regional variations, and the diverging economic realities of AI-native platforms.
Industry Context and Public Market Capitalization
The valuation environment for SaaS companies has achieved a new equilibrium in 2026. Public SaaS market capitalization closed the first quarter of 2026 at $1.92 trillion across major cloud indices, representing a 14% year-over-year increase and returning to levels not seen since the late-2021 peak 9. The median enterprise value to next-twelve-months (EV/NTM) revenue multiple for public SaaS companies stands at 7.4x, recovering from the 5.9x lows of 2024 9.
However, beneath the headline indices, there is significant bifurcation based on business model and growth efficiency. Pure SaaS portfolios lacking AI-native components or high-efficiency operating margins have seen valuation multiples compress to decade lows, with some indices tracking pure SaaS at 3.1x NTM revenue 6. This represents an 80% decline from the peak multiples of 2020 and illustrates a generational repricing of what the market believes traditional B2B software is worth when divorced from strict capital discipline 6.
In the private markets, SaaS companies currently trade at multiples between 3x and 7x annual recurring revenue (ARR), while AI-native platforms demonstrating high velocity and strong retention command substantial premiums of 25x to 30x ARR 10. The convergence of these public and private valuation standards dictates that private companies aiming for successful exits or subsequent funding rounds must adhere strictly to the updated operational benchmarks detailed below.
Revenue Growth Rate Metrics
Revenue growth expectations in 2026 reflect a market that rewards sustainable, efficient scaling over capital-intensive hyper-growth. The industry has fully transitioned away from growth-at-all-costs methodologies toward models that balance top-line velocity with bottom-line profitability 51011.
The median annual recurring revenue (ARR) growth rate for private B2B SaaS companies in 2026 has settled at 26% 4512. This represents a significant deceleration from the 30% to 35% medians observed in previous eras, highlighting a structural shift toward prolonged procurement scrutiny, expanded buying committees, and extended enterprise sales cycles 513. Top-quartile private SaaS companies continue to achieve growth rates of approximately 50%, setting the benchmark for elite performance, while the bottom quartile struggles at roughly 10%, with 35% of tracked companies reporting year-over-year growth declines 410.
Growth expectations scale inversely with company size. As the revenue base expands, the mathematical difficulty of maintaining high percentage growth increases, resulting in a natural deceleration curve.
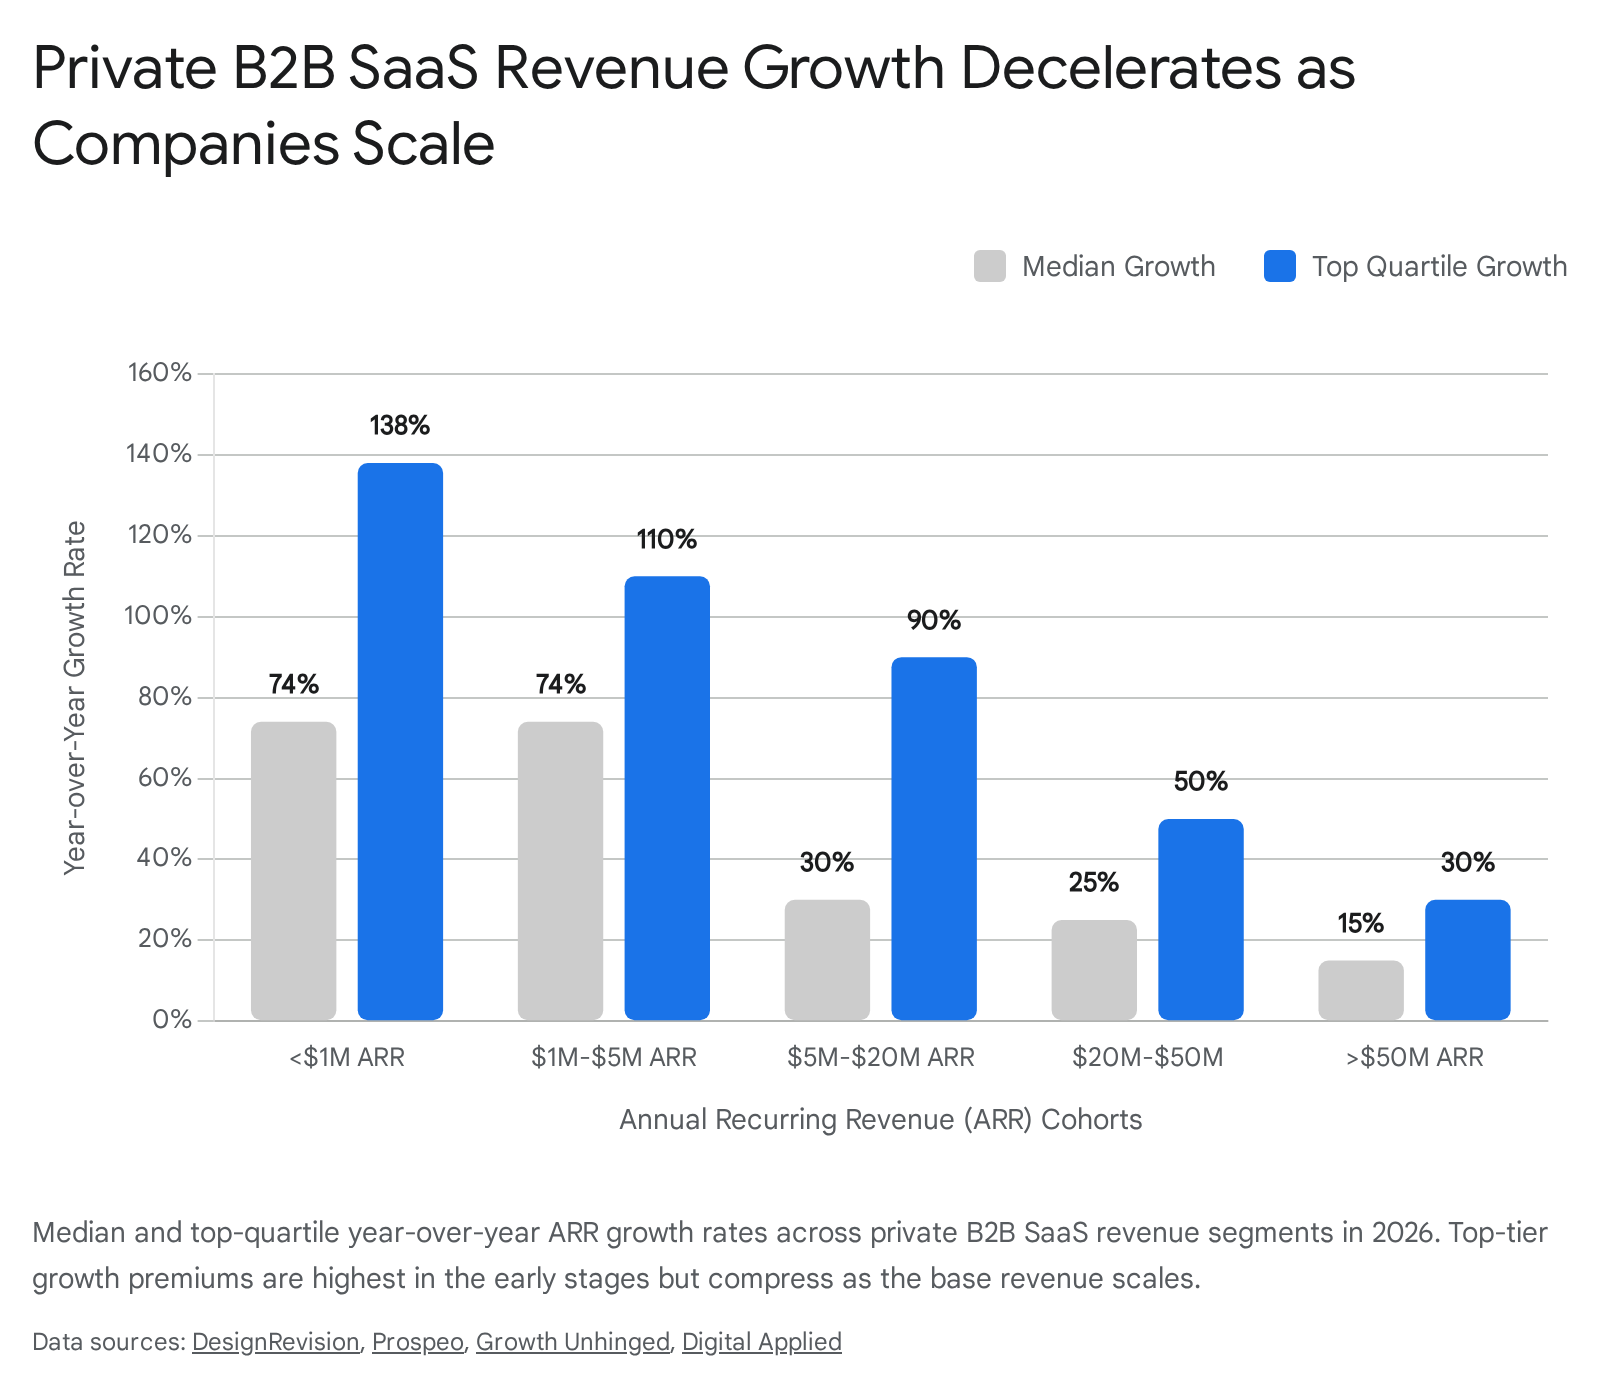
| ARR Stage Cohort | Median YoY Growth Rate | Top Quartile YoY Growth Rate |
|---|---|---|
| Pre-$1M ARR | 74% - 100% | 138% - 150%+ |
| $1M to $5M ARR | 74% - 80% | 110% - 115% |
| $5M to $20M ARR | 30% - 35% | 90% - 95% |
| $20M to $50M ARR | 24% - 25% | 50% - 60% |
| Greater than $50M ARR | 15% - 20% | 30% - 40% |
Data synthesized from 2025/2026 private SaaS benchmarking surveys and index reports 191114.
Public SaaS companies, which serve as the ultimate maturity benchmark, demonstrate stabilized median growth rates of 17% to 19% 1915. This represents a marked recovery from the compression seen in 2023 but remains lower than the pandemic-era peaks.
Funding models also heavily dictate growth trajectories and internal expectations. Venture-backed SaaS companies report median growth rates of 25% to 30%, driven by deployed capital explicitly modeled to capture market share rapidly 5. In contrast, bootstrapped SaaS companies operating in the $3M to $20M ARR range report a median growth rate of 15% 16. Bootstrapped entities structurally trade absolute top-line velocity for capital preservation, operational control, and immediate profitability, presenting an entirely separate but equally viable performance curve.
The Rule of 40 and Capital Efficiency
The Rule of 40 - which dictates that a software company's combined revenue growth rate and profit margin should equal or exceed 40% - remains the definitive proxy for SaaS financial health and investor readiness in 2026 171819. While historically applied primarily to public equities to justify premium valuations, it has moved decisively upstream into private venture evaluations, serving as a gating metric for Series B and C funding rounds 417.
There is ongoing analytical divergence regarding the exact profit margin input for this calculation. Utilizing the EBITDA margin is common for public reporting comparability, but utilizing Free Cash Flow (FCF) margin is increasingly required by analysts, as it accounts for capital expenditures and more accurately reflects true liquidity while stripping out the distortions of stock-based compensation 18. In 2026, the median public SaaS Rule of 40 on an FCF basis stands at approximately 38% to 39%, while the EBITDA-based median is significantly lower, at roughly 22% to 23% 918.
Across the private markets, the median SaaS company continues to fall short of the 40% threshold. Median Rule of 40 performance by ARR bands in private SaaS sits at 33% for companies with $1M to $5M ARR, drops to 20% for companies in the $5M to $20M scaling phase, and recovers to 30% for mature companies exceeding $50M ARR 17. Only top-quartile performers consistently clear the 40% benchmark across all revenue bands. The valuation impact of achieving this benchmark is stark: companies clearing the Rule of 40 on an FCF basis trade at median EV/Revenue multiples 74% higher than companies that fail the metric (4.8x versus 2.7x) 18.
Auxiliary Efficiency Metrics: Burn Multiple and RPE
Beyond the Rule of 40, boards and operators in 2026 rely heavily on two auxiliary efficiency metrics: the Net Burn Multiple and Revenue per Employee (RPE).
The Net Burn Multiple is calculated as Net Burn divided by Net New ARR. It measures the precise capital consumption required to generate one new dollar of recurring revenue. A ratio under 1.0 is considered excellent, indicating highly efficient growth. A ratio between 1.0 and 2.0 is healthy for early-stage companies, while a ratio above 2.5 is viewed as an existential warning sign of inefficient go-to-market dynamics 202122. Industry analysis indicates the Burn Multiple has become the single highest-correlation predictor of B2B SaaS valuation in the post-2024 landscape 2022.
Revenue per Employee (RPE) establishes strict parameters for headcount expansion. The median RPE for mid-market SaaS companies ($10M to $40M ARR) sits between $150,000 and $200,000, while top-quartile performers clear $300,000 1220. Elite public decile companies consistently clear $400,000 to $700,000 per employee, enforcing the principle that revenue scale must be decoupled from linear headcount growth through automation and product-led architectures 20.
Customer Retention and Expansion Metrics
In a constrained demand environment where new logo acquisition is increasingly expensive, complex, and slow, the mathematical compounding of existing customer bases dictates long-term enterprise viability. The industry has shifted its analytical focus from top-of-funnel volume to post-sale retention dynamics, viewing the installed customer base as the primary growth engine 2324.
Net Revenue Retention (NRR) and Gross Revenue Retention (GRR)
Net Revenue Retention (NRR) measures the percentage of recurring revenue retained from existing customers over a specific period, inclusive of all expansion (upsells, cross-sells, seat additions) and contraction (downgrades, logo churn) 2528. Gross Revenue Retention (GRR) measures retained revenue strictly excluding any expansion, creating a pure baseline of product stickiness and core satisfaction 25.
In 2026, the industry-wide median NRR has compressed to 101% to 106%, down from the 2021 peaks of 105% to 110% 4510. This baseline indicates that the average SaaS company is only barely offsetting its churn and contraction through expansion. Best-in-class performance in 2026 requires an NRR of 115% to 125%, with elite enterprise platforms consistently maintaining metrics above 130% 4101126. The mathematical impact of high NRR is profound: companies with NRR exceeding 110% grow 2.3 times faster than peers operating in the 95% to 100% range, simply through compounding account values 923.
The GRR median sits between 86% and 88%, with top-quartile operators clearing 95% 425. The variance between NRR and GRR is highly scrutinized by investors and acquirers during due diligence. A company reporting an acceptable NRR of 101% but a low GRR of 80% relies too heavily on extracting revenue from a rapidly shrinking customer base. This "leaky bucket" phenomenon signals a systemic product-market fit deficiency or poor onboarding architecture that is being temporarily masked by aggressive upselling to power users 430.
| ARR Stage Cohort | Median NRR | Top Quartile NRR | Median GRR | Top Quartile GRR |
|---|---|---|---|---|
| $1M to $5M ARR | 99% | 114% | 87% | 93% |
| $5M to $25M ARR | 105% | 118% | 91% | 96% |
| $25M to $100M ARR | 109% | 124% | 93% | 97% |
| Greater than $100M ARR | 112% | 130% | 95% | 98% |
Data reflecting the direct correlation between company scale and retention stability in 2026 9.
Retention metrics scale positively with Annual Contract Value (ACV). Enterprise accounts (ACV >$100,000) deliver a median NRR of 118% to 122%, mid-market accounts ($25,000 to $100,000) yield 108% to 114%, and Small and Medium Business (SMB) accounts (<$25,000) yield a much more volatile 96% to 97% 910.
Expansion Revenue and Usage-Based Pricing
Expansion revenue now accounts for 38% to 40% of all new ARR generated across the B2B SaaS sector in 2026, rising to over 50% for mature companies with ARR exceeding $50 million 491231. The primary mechanism driving this structural shift is the mass adoption of hybrid and usage-based pricing models.
By 2026, 51% of public SaaS companies have integrated a usage-based or consumption component into their pricing architecture, up significantly from 27% in 2021 9. Pure subscription (fixed per-seat) models have contracted to represent only 28% of public SaaS pricing structures. The most effective monetization approach combines a baseline subscription commitment with an overage component linked to utilization 926. This structure minimizes entry friction while aligning revenue automatically with customer value realization, eliminating the friction of traditional sales-led renewal negotiations and driving net retention uplifts of roughly 6 percentage points 92632.
Logo Churn Benchmarks
Logo churn - the absolute percentage of customers canceling their subscriptions - operates on strict thresholds dictated entirely by customer segmentation. The overall B2B SaaS monthly logo churn median hovers around 3.5%, but this aggregate figure obfuscates severe segment disparities that must be benchmarked independently 27.
A monthly churn rate of 4% to 5% is lethal for an enterprise-focused company but represents acceptable operational reality for a platform serving volatile SMBs or prosumers, provided acquisition costs are sufficiently low 927.
| ACV Segment | Median Monthly Logo Churn | Top Quartile Monthly Churn | Implied Annual Churn |
|---|---|---|---|
| Consumer / Prosumer (<$500) | 6.2% | 3.4% | ~54% |
| SMB ($500 - $5,000) | 4.1% | 2.2% | ~39% |
| Mid-Market ($5K - $25K) | 1.3% | 0.7% | ~14% |
| Enterprise ($25K - $100K) | 0.7% | 0.4% | ~8% |
| Strategic ($100K+) | 0.4% | 0.2% | ~5% |
Data tracking logo retention across contract value tiers in 2026 9.
For scale-stage enterprise companies (>$50M ARR), a monthly logo churn exceeding 1% is considered a critical operational failure requiring immediate intervention by the executive team 911.
Customer Acquisition Cost and Unit Economics
The cost to acquire a customer has persistently inflated across the SaaS ecosystem. By 2026, B2B SaaS companies spend a median of $2.00 in sales and marketing to generate $1.00 of new ARR, an efficiency metric referred to as the CAC Ratio 410. The blended customer acquisition cost has surged to approximately $1,200 per account across the industry - driven by escalating digital advertising media costs (e.g., Google Ads and LinkedIn CPCs) and elongated enterprise sales cycles, which have stretched to an average of 134 days compared to 107 days in early 2022 1025.
CAC Payback Period by Deal Size
The CAC Payback Period - calculated as the number of months required for a customer's gross profit contribution to offset their exact acquisition cost - is the industry's preeminent measure of go-to-market efficiency.
The industry-wide median blended CAC payback period for B2B SaaS in 2026 rests between 15 and 18 months 4928. This represents a lengthening from the 15-month median observed in 2023, reflecting a tougher demand environment and saturated marketing channels 928. Elite companies operating in the $10M to $40M ARR bracket target a payback period of under 12 to 14 months 2930.
However, establishing a single benchmark for payback is insufficient, as the metric is inextricably linked to Annual Contract Value (ACV). Historical data demonstrates a direct correlation: CAC payback expectations lengthen significantly as deal sizes increase.
| Annual Contract Value (ACV) Band | Median CAC Payback Period | Top Quartile Target |
|---|---|---|
| Under $5,000 (SMB) | 8 - 9 Months | < 6 Months |
| $5,000 - $25,000 (Mid-Market) | 14 - 18 Months | < 12 Months |
| $25,000 - $50,000 (Commercial) | 22 Months | < 16 Months |
| Greater than $50,000 (Enterprise) | 24+ Months | < 18 Months |
Derived from 2026 CAC payback correlation models and ACV analyses 5.
The data reveals that sub-$5K ACV accounts must pay back in 8 to 9 months, while enterprise contracts exceeding $50K commonly require 24 months or more to recover acquisition costs 5. Extended payback periods in the enterprise segment are mathematically acceptable only if paired with enterprise-grade NRR (120%+). If a high-value account yields 30% annual expansion, an initial 24-month payback rapidly compresses into highly profitable unit economics by year three 28. Conversely, permitting a 24-month payback on an SMB account that operates with a 95% NRR is fundamentally unsustainable, as the cohort will likely churn before reaching profitability.
Lifetime Value to Customer Acquisition Cost (LTV:CAC)
The Lifetime Value to CAC ratio evaluates the aggregate long-term return on sales and marketing expenditures. In 2026, a 3:1 ratio represents the baseline threshold for viable, sustainable growth 2830.
Top-tier, scale-ready SaaS companies consistently target an LTV:CAC ratio of 4:1 to 5:1 30. High industry variance exists based on vertical integration; Cybersecurity and HR Technology SaaS, which leverage inherently high switching costs and profound workflow integration, frequently average ratios of 3.5:1 to 4.2:1 2830. In contrast, Marketing Technology (MarTech) platforms dealing with lower switching barriers and intense competition must strictly monitor acquisition spend to maintain the 3:1 baseline.
Go-to-Market Strategy and Sales Efficiency
Go-to-market (GTM) motions dictate the underlying physics of a SaaS company's financial model. By 2026, the rigid dichotomy between pure Product-Led Growth (PLG) and pure Sales-Led Growth (SLG) has largely dissolved, favoring a hybrid architecture for scale-stage companies.
Product-Led vs. Sales-Led Economics
Product-Led Growth (PLG): In a product-led motion, the software itself serves as the primary acquisition, activation, and retention vehicle. Self-serve free trials or freemium tiers minimize human intervention. Consequently, PLG customer acquisition costs are structurally lower - averaging $200 to $2,000 - allowing for rapid payback periods of 6 to 12 months 102831. The top-of-funnel visitor-to-lead conversion rates are relatively high (3% to 9%), and pure self-serve trial-to-paid conversion averages 4% to 6% 910. However, PLG models suffer from inherently higher early-stage churn, as self-serve users possess lower organizational commitment and virtually zero sunk implementation costs 11.
Sales-Led Growth (SLG): This motion relies on outbound business development, Account-Based Marketing (ABM), and direct quota-carrying sales teams. SLG is mathematically necessary for products with high ACVs (>$15,000) that require security reviews, legal redlining, and stakeholder consensus 2931. Visitor-to-lead conversion is notably low (0.5% to 1.5%), and CAC is exorbitant (frequently exceeding $11,000), necessitating extended payback periods of 18 to 36 months 1028. The SLG advantage manifests in deep post-sale stickiness; retention rates are significantly higher, producing outsized lifetime values 1128.
The Hybrid Revenue Architecture (Product-Led Sales)
Market analysis demonstrates that pure PLG models struggle to cross the $25M ARR threshold without adding enterprise sales capabilities, while pure SLG models burn excessive capital attempting to acquire lower-tier customers via expensive human routing 2931. The dominant and most capital-efficient paradigm in 2026 is the Hybrid or Product-Led Sales (PLS) model.
In a hybrid architecture, a self-serve PLG funnel operates at the bottom of the market, serving as an efficient, low-CAC acquisition net. High-usage accounts that trigger specific segmentation rules (e.g., user volume thresholds, specific feature adoption, or matching ideal customer profile firmographics) are flagged as Product-Qualified Leads (PQLs) and routed to a sales team for enterprise expansion 2931. PQLs convert at 15% to 20% - substantially higher than traditional Marketing Qualified Leads (MQLs) sourced from gated content - delivering the lowest combined acquisition cost with the highest ceiling for ACV expansion 931.
Marketing Allocations and AI-Assisted Operations
Marketing budget allocations have adapted to prioritize capital efficiency. Top-quartile SaaS marketing teams now attribute 41% of their qualified pipeline to organic search, content, and Answer Engine Optimization (AEO), while the share of pipeline generated by paid acquisition has fallen to 26%, down from 34% in 2023 9.
The integration of generative AI into go-to-market operations is showing measurable returns. Companies that have systematically deployed AI agents for lifecycle email personalization, ad copy generation, and SEO content production report median CAC payback periods 3 to 5 months shorter than non-adopters, while simultaneously reducing content production costs by 40% to 60% 928.
Annual Contract Value (ACV) Optimization
Annual Contract Value (ACV) optimization is recognized in 2026 as the highest-leverage lever available to improve capital efficiency. The structural reality of SaaS economics dictates that the same dollar of marketing acquisition spend produces 50% to 70% faster payback when applied to an Enterprise ACV compared to an SMB ACV 38.
Top-decile scaling programs systematically walk away from poor-fit, high-churn small deals to redeploy Account Executive capacity toward larger enterprise opportunities. While this shift naturally lengthens average sales cycles (from 30 days at the SMB level to 90-180 days at the Enterprise level), the economics firmly favor the transition 38. Lifting average ACV via multi-year contract incentives and deal desk discipline not only compresses payback periods but also dramatically improves baseline NRR due to lower underlying churn rates inherent to enterprise deployments.
Regional SaaS Market Variations
The geographic distribution of the global B2B SaaS market reveals distinct operational priorities, growth constraints, and strategic trajectories.
North America: The United States and Canada continue to dominate the global landscape, commanding approximately 47% to 48% of worldwide SaaS revenue 4939. The North American market boasts the highest density of enterprise cloud penetration and advanced digital infrastructure 7. Given the maturity, saturation, and intense competition of this market, North American SaaS vendors focus heavily on deep competitive displacement strategies, AI-enabled workflow optimization, and maintaining premium ACVs through multi-product platform consolidation.
Europe: Europe accounts for roughly 25% of the global SaaS market, with revenues projected to approach $95 billion in the near term 939. The European ecosystem is characterized by an intense focus on capital efficiency, data sovereignty, and regulatory compliance (e.g., GDPR). Top European SaaS companies (those exceeding €50M ARR) command EBITDA margins of 28% and trade at 6.7x revenue multiples, indicating a strong investor preference for disciplined, highly profitable scaling over expansion-at-all-costs 40. Furthermore, European growth is disproportionately driven by Vertical SaaS (purpose-built platforms for specific industries like Legaltech, Healthtech, and Manufacturing), which is growing three times faster than horizontal SaaS in the region (28% vs. 9% YoY) 40. European vendors also lead globally in providing localized, strict Data Security Standard (DSG) compliant AI infrastructures.
Asia-Pacific (APAC): APAC represents the primary growth engine for global SaaS adoption, expanding at an aggressive Compound Annual Growth Rate (CAGR) of 20% to 25% 7841. The region's expansion is fueled by rising middle classes, record internet penetration, and massive digital transformation initiatives among Small and Medium Enterprises (SMEs) 841. India has emerged as a formidable global SaaS hub, with domestic companies growing at a 24% CAGR and a rapidly increasing number of firms surpassing $10 million in ARR 9. Furthermore, the cost arbitrage of building technical infrastructure and engineering teams in technology centers like Bangalore provides massive capital efficiency advantages for bootstrapped founders 42. However, success in the broader APAC market demands highly localized execution; companies must navigate severe price sensitivity, fragmented regulatory environments across forty distinct national markets, reliance on localized partner ecosystems, and the absolute necessity of vernacular language support 414344.
| Metric / Characteristic | North America | Europe | Asia-Pacific (APAC) |
|---|---|---|---|
| Global Revenue Share | ~47% - 48% | ~25% | Fastest Growing (20%+ CAGR) |
| Primary Market Driver | Enterprise consolidation, AI workflow integration | Capital efficiency, Vertical SaaS, Data Sovereignty | SME digital transformation, cost arbitrage hubs |
| Strategic Focus | Competitive displacement, ACV expansion | GDPR compliance, profitability (28% EBITDA targets) | Extreme localization, vernacular support, mobile-first |
Summary of regional B2B SaaS market characteristics and strategic imperatives in 2026 794041.
The Divergence of AI-Native Software
The defining operational inflection point of 2026 is the mainstream integration of artificial intelligence into B2B software. However, the market differentiates heavily between traditional SaaS companies adding AI features, and AI-native SaaS companies - architected from inception around Large Language Models (LLMs) and autonomous agents. These AI-native entities are rendering traditional benchmarks obsolete by fundamentally altering the unit economics of software delivery 43233.
Hyper-Accelerated Growth vs. Margin Compression
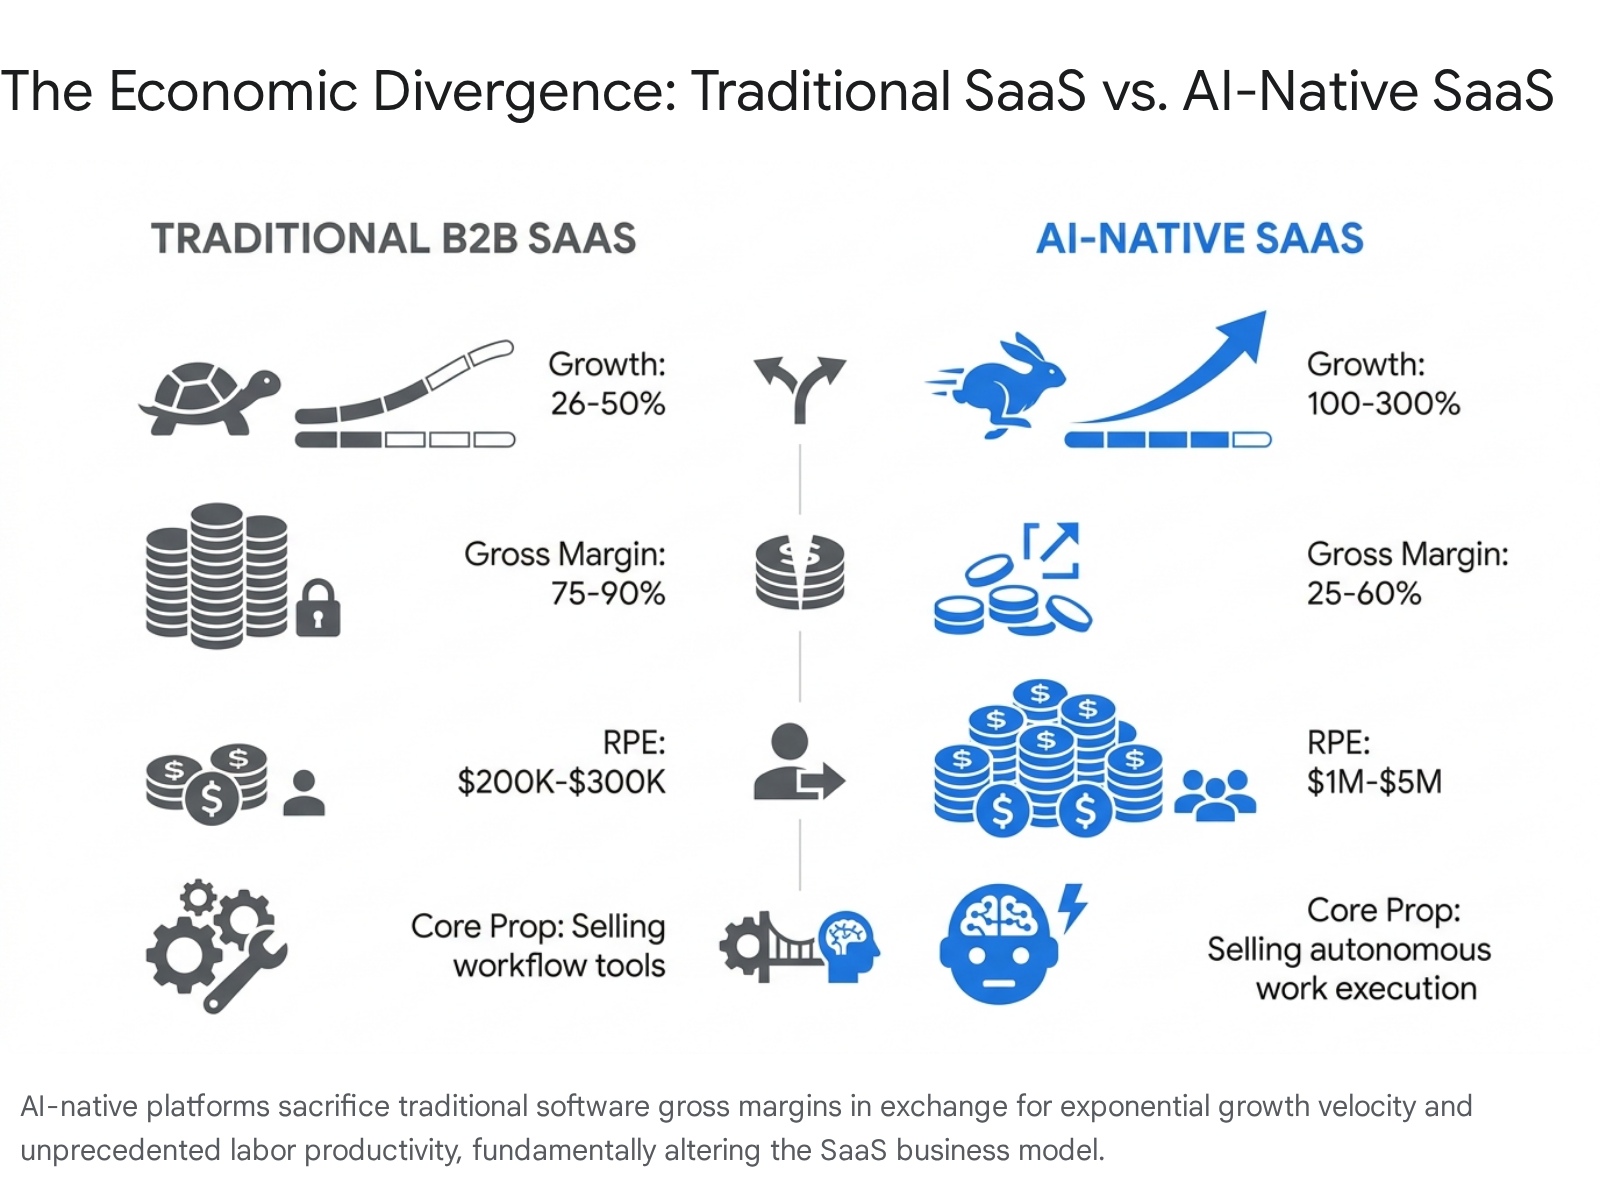
AI-native companies are breaking all historical scaling records. Top-performing AI startups achieve $100 million in ARR ("Centaur" status) in an average of 5.7 years, a full 18 to 24 months faster than the broader industry average of 7.5 years 34. Across nearly every revenue band, AI-native platforms exhibit year-over-year growth rates 2x to 3x higher than their traditional B2B SaaS counterparts 41435. Valuations reflect this velocity, with the average top-tier private cloud/AI company reaching an $11.2 billion valuation, commanding revenue multiples of 24x compared to 19x for non-AI peers 34.
However, this explosive top-line growth requires a structural trade-off in gross margins. Traditional SaaS relies on the economic principle of near-zero marginal replication costs; once core code is written and deployed, serving an additional user costs fractions of a cent in hosting, allowing for standard 80% to 90% gross margins 49.
AI-native SaaS operates fundamentally differently. Delivering AI value requires continuous, compute-heavy inference processing 449. Every prompt, generation, or autonomous agentic action incurs a direct variable cost paid to cloud providers and foundational model developers. Consequently, AI-native gross margins sit significantly lower, frequently between 25% (in the highly scaling, compute-intensive early stages) and 40% to 60% (at maturity as model efficiency improves) 4649.
To offset this margin compression, AI-native platforms must operate with radically leaner headcounts. The Revenue per Employee (RPE) metric for top-tier AI companies frequently ranges from $1 million to $5 million, dwarfing the traditional SaaS benchmark of $200,000 to $300,000 46.
The Retention Dichotomy
The data surrounding AI-native retention reveals a fascinating contradiction based on the depth and utility of the application layer.
Broad market surveys report that early AI-native SaaS companies suffer a dismal median NRR of 48% and a Gross Revenue Retention of 40% 32. This indicates a profound lack of durable product-market fit among "wrapper" applications - tools that simply place a rudimentary user interface over an underlying foundational model API. These products experience high viral adoption driven by curiosity, followed by rapid churn as the novelty fades, inference costs mount, or superior native models are released directly by major labs 32. The low switching costs that aid acquisition simultaneously guarantee high attrition.
Conversely, enterprise-grade AI applications integrated deeply into core business workflows show the exact opposite trend. When autonomous AI agents successfully execute complex workflow tasks (e.g., autonomous legal document generation, end-to-end customer support resolution, or enterprise-scale code architecture) rather than merely providing assistive software tools, customers readily expand their usage boundaries. Venture capital benchmarks indicate that top-tier AI-native enterprise platforms achieving this deep integration record staggering NRR rates of 130% to 200% 6.
Operating Cadence and Board Reporting
The stringent macroeconomic environment of 2026 has transformed executive reporting expectations. SaaS CEOs and revenue leaders must align their operating cadence with the exact metrics that dictate capital efficiency and enterprise valuation.
Vanity metrics regarding top-of-funnel volume have been replaced in board presentations by rigid unit economic scorecards. Investors now demand explicit visibility into pipeline coverage ratios - targeting 3x coverage as healthy and 4x as elite, calculated as qualified pipeline divided by the next quarter's sales target 22. This is paired directly with forecast accuracy metrics, where executive teams are expected to land within 10% to 15% of their quarterly revenue projections 22.
The board deck in 2026 is anchored heavily by the Net Burn Multiple and the Rule of 40, ensuring that executive decisions regarding headcount expansion, marketing allocations, and product development are explicitly tied to their impact on overall capital consumption and margin preservation 2122.
Conclusion
The state of B2B SaaS in 2026 is defined by a rigorous return to fundamental financial discipline for traditional software providers, operating alongside a wild frontier of economic experimentation for AI-native platforms. The baseline expectation for a healthy mid-market SaaS business is now mathematically clear: maintain a 26% top-line growth rate, preserve gross margins above 75%, achieve Net Revenue Retention exceeding 101%, and restrict the CAC Payback Period to under 18 months 45.
Companies failing to meet these strict efficiency standards will struggle to secure venture capital, negotiate favorable debt facilities, or command premium exit valuations. Concurrently, as artificial intelligence transitions from an assistive feature enhancement to the core computing paradigm of the enterprise, the industry is preparing for a reality where software is no longer priced and evaluated merely as a tool to facilitate human labor, but rather as an autonomous agent executing the work itself. This profound shift will continue to rewrite the fundamental benchmarks for margins, growth, and retention through the remainder of the decade.