Retail Leverage and Risk Profiles in Swing Trading
Introduction
The democratization of financial markets has precipitated a structural transformation in retail trading behavior, characterized most notably by an unprecedented adoption of leveraged derivative instruments. Over the past decade, and accelerating sharply post-2020, the retail trading landscape has shifted from traditional cash-equity investing toward highly complex, path-dependent vehicles 12. These include Contracts for Difference (CFDs), zero-days-to-expiration (0DTE) options, and aggressive portfolio margin accounts. While the underlying assets may be conventional equities, macroeconomic indices, or foreign exchange pairs, the introduction of leverage fundamentally alters the return distribution of these trades, transforming linear investments into highly convex, asymmetric risk profiles 34.
A pervasive misconception among retail market participants - often perpetuated by the opaque framing of brokerage interfaces and the gamification of trading platforms - is the belief that leverage scales profits and losses symmetrically. Under this assumption, a twofold increase in leverage simply doubles the expected return of an underlying asset. However, rigorous quantitative analysis and empirical market data systematically debunk this linear fallacy 567. In reality, the application of leverage introduces severe structural frictions, most notably volatility drag (variance drain), exponential increases in the probability of ruin, and continuous holding costs comprised of overnight financing spreads and time decay 4583.
Furthermore, the macroeconomic environment from 2023 onward, characterized by elevated interest rates and sudden volatility shocks - such as the August 2024 unwinding of the Japanese Yen carry trade - has exposed the deep fragility of highly leveraged retail portfolios 4115. As global central banks transitioned away from zero-interest-rate policies, the cost of carrying leveraged positions surged, transforming what was once a negligible friction into a primary driver of portfolio decay 1314. In response to these systemic risks, global regulatory bodies have increasingly diverged in their approaches to retail investor protection. While the European Securities and Markets Authority (ESMA), the UK's Financial Conduct Authority (FCA), and the Australian Securities and Investments Commission (ASIC) have implemented stringent leverage caps and negative balance protections for over-the-counter (OTC) derivatives, the United States continues to prohibit CFDs entirely, relying instead on evolving intraday margin requirements and centralized clearing to mitigate counterparty risk 36717.
This report provides an exhaustive mathematical, structural, and regulatory analysis of retail leverage. By dissecting the mechanics of path dependence, the hidden costs of derivative exposure, and the disparate geographic regulatory frameworks governing these instruments, this analysis delineates the precise mechanisms through which leveraged trading structurally disadvantages the retail investor.
The Illusion of Symmetrical Returns: Volatility Drag and Path Dependence
The fundamental mathematical error in retail leveraged trading is the conflation of arithmetic mean returns with geometric (compound) mean returns. In a single-period, discrete-time framework, leverage appears symmetrical: a 2x leveraged position will yield twice the return of the unleveraged benchmark. However, financial markets operate continuously over multiple periods, where returns are inherently multiplicative and path-dependent 678.
The Mathematics of Variance Drain
When an asset's returns are compounded over time, volatility negatively impacts the long-term growth rate - a phenomenon formally known in quantitative finance as volatility drag or variance drain 568. The continuous-time geometric return ($g$) of an asset is approximated by its arithmetic return ($\mu$) minus half of its variance ($\sigma^2$):
$$g \approx \mu - \frac{\sigma^2}{2}$$
This relationship demonstrates that even if a hypothetical unleveraged asset has an arithmetic average daily return of exactly zero (e.g., oscillating equally between +2% and -2% in perpetuity), its compound growth rate is definitively negative, and the asset's terminal value will trend toward zero over an extended horizon 58.
When leverage ($L$) is applied to an investment, the impact on the portfolio's expected arithmetic return ($\mu_L$) must account for the cost of borrowing capital ($r$). The arithmetic return of the leveraged portfolio becomes:
$$\mu_L = L\mu - (L - 1)r$$
However, leverage scales the volatility of the portfolio proportionally ($\sigma_L = L\sigma$). Because the volatility drag component is determined by the square of the standard deviation, the geometric return of the leveraged portfolio ($g_L$) suffers an exponential increase in variance drain 619:
$$g_L \approx \left[ L\mu - (L - 1)r \right] - \frac{1}{2}L^2\sigma^2$$
This mathematical reality exposes the deep asymmetry of leveraged trading. If an investor utilizes 2x leverage ($L = 2$), the expected arithmetic return is roughly doubled (minus financing costs), but the volatility drag is quadrupled ($2^2 = 4$). At 3x leverage, the drag is multiplied by nine. Consequently, there exists a mathematical threshold where the application of additional leverage destroys expected geometric growth, forcing the portfolio into an inevitable decay regardless of the underlying asset's positive arithmetic drift 5619.
Path Dependence and Rebalancing Frictions
The structural design of leveraged products - particularly Leveraged Exchange-Traded Funds (LETFs) and daily resetting CFDs - creates strict path dependence. Because these products reset their leverage exposure at the end of each trading session to maintain a constant leverage ratio, their cumulative returns over longer horizons deviate significantly from the target multiple of the underlying index 72021.
The direction and magnitude of this compounding effect rely heavily on the autocorrelation and dynamics of the underlying market. In a momentum-driven market exhibiting positive autocorrelation (where positive returns are consistently followed by positive returns), daily resetting leverage can theoretically result in returns that exceed the stated multiple 721. However, equity markets frequently exhibit mean-reverting or oscillating behaviors. In a volatile, sideways market, the daily resetting mechanism forces the leveraged position to systematically buy higher and sell lower to maintain its fixed exposure ratio, extracting a continuous penalty 7.
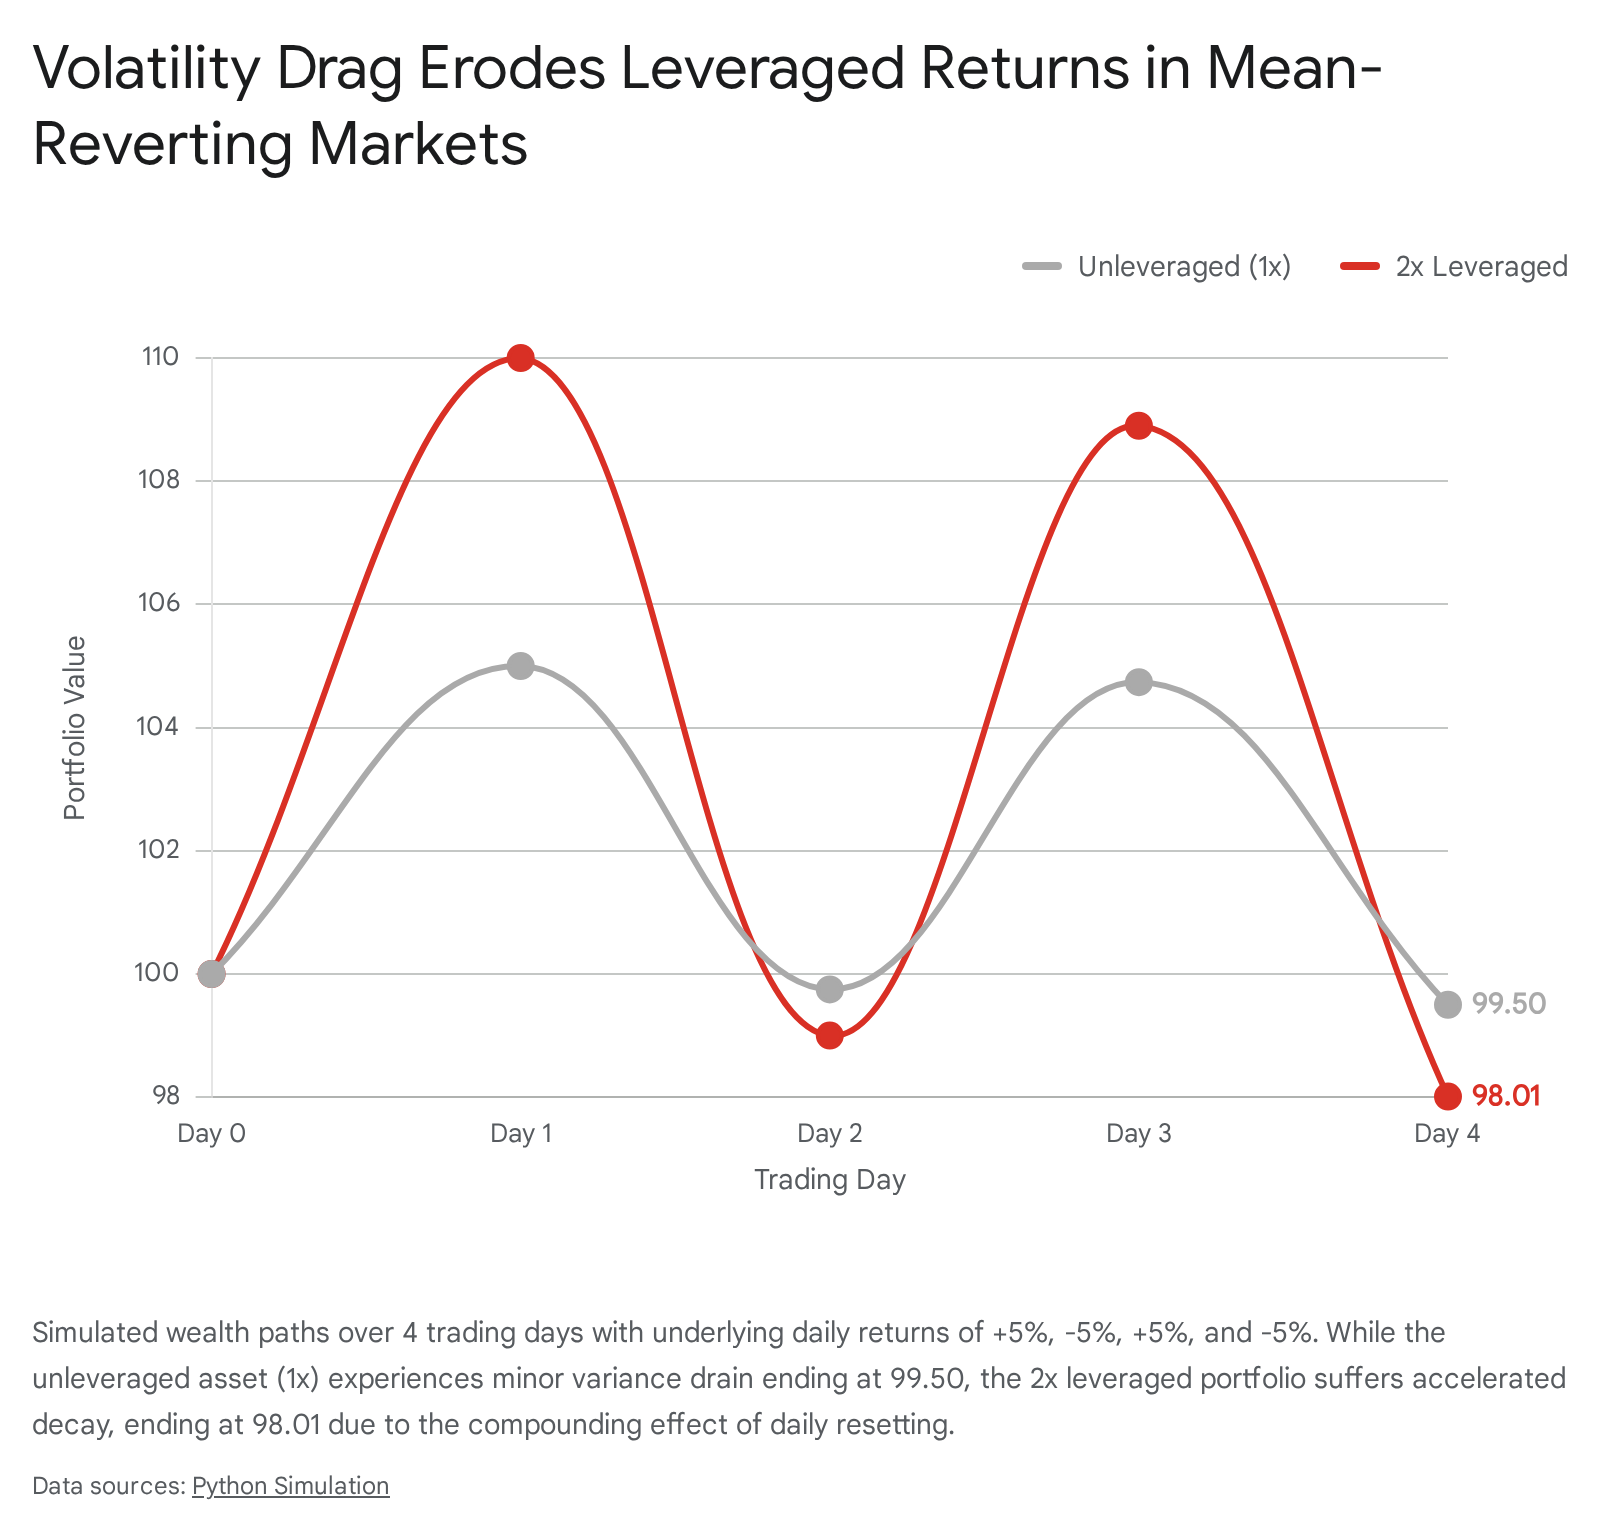
To illustrate this mathematically, consider a simplified multi-session scenario where an underlying asset experiences alternating volatility over four trading days. Table 1 demonstrates how an unleveraged asset and a 2x daily-resetting leveraged portfolio respond to a sequence of +5% and -5% daily returns, assuming an initial capital base of 100.
| Day | Underlying Return | Unleveraged Wealth (1x) | Leveraged Wealth (2x) | Implied Symmetric Value |
|---|---|---|---|---|
| 0 | 0% | 100.00 | 100.00 | 100.00 |
| 1 | +5% | 105.00 | 110.00 | 110.00 |
| 2 | -5% | 99.75 | 99.00 | 99.50 |
| 3 | +5% | 104.74 | 108.90 | 109.48 |
| 4 | -5% | 99.50 | 98.01 | 99.00 |
As demonstrated, if an underlying index rises by 5% on Day 1 and falls by 5% on Day 2, the unleveraged index experiences minor variance drain, ending at 99.75. A 2x leveraged product, however, rises by 10% to 110 on Day 1, and falls by 10% on Day 2, resulting in a terminal value of 99.00. By Day 4, the unleveraged asset is down 0.5%, but the leveraged position has lost nearly 2.0% due entirely to path-dependent compounding .
Academic studies analyzing the long-term performance of leveraged funds consistently demonstrate that in highly volatile environments, LETFs deliver only 58% to 61% of their expected multiples over extended horizons 20219.
The Mathematics of Survival: Probability of Ruin in Leveraged Systems
While volatility drag guarantees long-term portfolio decay in the absence of a substantial positive arithmetic drift, short-term survival in leveraged trading is governed by the probability of ruin. Academic literature on risk management, stemming from the foundational Cramer-Lundberg model of ruin probability in insurance, demonstrates that a positive expected return (a "trading edge") does not immunize a portfolio against a total loss of capital 101112. Quantitative evaluations of claim distributions, specifically utilizing Monte Carlo simulations with lognormal and gamma distributions, reveal that heavy-tailed events dramatically increase the probability of ruin compared to standard exponential models 10. Applied to financial markets, these heavy tails represent sudden volatility shocks and market gaps that are severely amplified by leverage.
Quantifying the Risk of Ruin
The Risk of Ruin (RoR) mathematically quantifies the exact probability that a trader will exhaust their capital - or breach a catastrophic drawdown limit - before reaching a profit target or continuing operations. Formalized for financial speculation by Ralph Vince and subsequent quantitative literature, the general approximation for the probability of ruin is expressed as 8272829:
$$RoR = \left( \frac{1 - A}{1 + A} \right)^N$$
Where: * $A$ represents the per-trade edge (expected value as a fraction of the unit risked). * $N$ represents the number of independent risk units in the account (Total Capital divided by Capital Risked Per Trade).
This formula yields profound insights that contradict prevailing retail trading strategies. First, if a trading system has a negative or zero expected edge ($A \le 0$), the base of the exponent equals or exceeds 1. Raised to any power, the result is 1 (or 100%). Consequently, no position sizing or leverage manipulation can rescue a strategy that lacks a positive mathematical expectancy; ruin is a statistical certainty over an infinite horizon 82730. Furthermore, academic models exploring asymmetric payoffs reveal that highly skewed reward-to-risk ratios (e.g., targeting a 20-to-1 payoff) dramatically elevate the ruin probability early in a sequence of trades, even if the mean expectancy is mathematically positive 30.
The Impact of Leverage on Capital Units ($N$)
The true peril of leverage lies in its manipulation of the exponent $N$. Consider an unleveraged trader with $10,000 who risks $100 per trade on an asset. The number of risk units $N$ is 100. If the trader possesses a modest statistical edge of $A = 0.05$ (a 5% positive expectancy per risk unit), the probability of ruin is $\left(\frac{0.95}{1.05}\right)^{100} \approx 0.007$, or less than 1% 28.
If the trader applies 5x leverage to amplify the nominal size of their positions, the capital at risk per trade increases to $500, dropping $N$ from 100 down to 20. Holding the exact same mathematical edge of 5%, the risk of ruin explodes to $\left(\frac{0.95}{1.05}\right)^{20} \approx 0.135$, or 13.5% 8. At 10x leverage, risking $1,000 per trade ($N = 10$), the probability of ruin skyrockets to 36.7% . This nonlinear relationship dictates that doubling leverage does not merely double the risk of a margin call; it increases the probability of absolute ruin exponentially 28.
Attempts to mathematically optimize this sizing often rely on the Kelly Criterion, which calculates the exact percentage of capital to risk per trade to maximize the geometric growth rate 82731. However, the academic consensus warns that trading at "Full Kelly" allocations results in extreme volatility, routinely subjecting portfolios to drawdowns of 40% to 60% 827. Because path-dependent risk measures confirm that such severe retracements lead to psychological capitulation, professional institutions universally deploy "fractional Kelly" strategies to deliberately suppress leverage and preserve capital 827.
Behavioral Asymmetry and Volatility Feedback
The mathematical destruction caused by leverage is frequently exacerbated by human behavioral biases. Empirical studies on asymmetric volatility and mental framing demonstrate that retail investors do not act as rational utility-maximizing agents. Instead, investors exhibit the disposition effect, tilting their portfolios toward riskier assets subsequent to realized losses while rapidly liquidating profitable positions to secure gains 1314. This behavioral asymmetry artificially depresses the trader's average reward-to-risk ratio, eroding their mathematical edge ($A$) precisely when leverage is systematically reducing their survival horizon ($N$) 1315.
Furthermore, the broader market exhibits asymmetric volatility, often referred to as the leverage effect. Initially theorized by Black (1976) and Christie (1982), this dynamic suggests that as equity values drop, corporate financial leverage increases, fundamentally raising the volatility of the asset 1316. Subsequent academic literature favors a volatility feedback mechanism: because volatility is priced, an anticipated increase in variance raises the required return on equity, leading to an immediate decline in asset prices 16. Regardless of the exact mechanism, the empirical reality is that downside price movements are accompanied by surging volatility, creating a hostile environment for leveraged long positions exactly at the point of maximum financial stress 131416.
Hidden Frictions: The Cost of Carry, Implied Volatility Crush, and Time Decay
Beyond the mathematical realities of path dependence and ruin probabilities, the implementation of retail leverage carries severe structural frictions. The cost of holding leveraged positions over time guarantees a negative drift parameter in the portfolio's expected return. These frictions manifest primarily through overnight financing rates in margin and CFD accounts, and through implied volatility crush and time decay (theta) in options trading.
Overnight Financing and Borrowing Costs in CFDs and Margin
Trading on margin or holding a Contract for Difference (CFD) requires the trader to borrow capital from the broker to fund the leveraged portion of the trade. This service incurs an ongoing interest charge, applied daily, fundamentally altering the profitability of swing trades and long-term holdings 363738.
The standard formula for calculating the daily overnight financing cost of a long position is 36:
$$\text{Daily Financing Cost} = \frac{\text{Notional Value} \times \text{Annualized Rate}}{360 \text{ or } 365}$$
The divisor depends heavily on the jurisdiction and currency; while the 365-day divisor is standard for markets denominated in GBP, SGD, and ZAR, a 360-day divisor is utilized for USD-denominated markets 37. The annualized rate applied by retail brokers is typically pegged to a benchmark overnight rate. Following the cessation of the London Interbank Offered Rate (LIBOR) due to manipulation scandals, the industry transitioned to transaction-based benchmarks such as the Secured Overnight Financing Rate (SOFR) in the US, which is calculated by the New York Fed based on Treasury repurchase agreements 171841.
During the zero-interest-rate environment that preceded 2022, these baseline benchmark rates were near zero, minimizing the cost of carry. However, as global central banks tightened monetary policy into 2023 and 2024, benchmark rates such as SOFR rose above 5% 1317. When a retail broker adds an administrative markup of 2.5% to 6.0% on top of a 5.3% SOFR base, retail margin rates can soar well above 10% 1336. While institutional platforms like Interactive Brokers may offer tiered margin rates around 4.7% for large multi-million dollar balances, the vast majority of retail participants trading at standard brokerages (e.g., Vanguard, Charles Schwab, E*TRADE) are subjected to margin lending rates approaching 11% to 12.45% 131442.
For a retail CFD trader taking a £75,000 notional long position on an index with a 20:1 leverage ratio (deploying only £3,750 in margin), an annualized rate of 7.8% translates to an explicit cash drain of roughly £16.05 per night 36. Held over five trading days and a weekend, this seemingly benign percentage extracts a severe toll, effectively acting as an anchor on the trade's net P&L. If the underlying asset fails to appreciate at a rate that exceeds this annualized financing hurdle, the trade is mathematically guaranteed to lose money in real terms, illustrating how borrowing costs skew outcomes negatively over time 3638.
0DTE Options, Time Decay, and Implied Volatility Crush
In the options market, leverage is embedded directly within the premium structure of the derivative contract, offering massive convex payoffs without the direct borrowing of cash 4. However, this leverage is heavily subsidized by structural decay. From 2022 onward, the options market witnessed a structural paradigm shift with the proliferation of zero-days-to-expiration (0DTE) options, which now constitute more than 75% of total retail S&P 500 index options volume 12.
Retail traders gravitate toward 0DTE options for their lottery-like asymmetric payout profiles. However, empirical academic research indicates that retail investors systematically lose massive amounts of capital trading these instruments. Between 2010 and 2021, retail investors lost an estimated $3 billion on options trading specifically around earnings announcements, enduring average losses of 5% to 9% per trade, escalating to 14% on highly volatile announcements 3. These wealth-depleting outcomes are primarily driven by three hidden structural costs 13:
- The Volatility Risk Premium (VRP): Options are priced based on implied volatility (IV), the market's consensus expectation of future variance. Because market makers assume significant tail risk by selling these convex instruments, they charge a premium. Academic studies confirm a persistent negative Volatility Risk Premium, meaning that the implied volatility priced into short-dated options consistently exceeds the realized volatility of the underlying asset 1. Consequently, retail traders who persistently purchase 0DTE options systematically overpay for exposure 1.
- Implied Volatility Crush: Retail investors frequently purchase short-dated options immediately preceding known macroeconomic catalysts or corporate earnings, times when IV is highly elevated. Once the event occurs and uncertainty resolves, IV collapses rapidly. Because the extrinsic value of an option is hyper-dependent on IV, this "IV Crush" evaporates the premium value. A trader can correctly predict the directional movement of the underlying asset, yet still suffer a net loss on the trade because the collapse in implied volatility outpaced the intrinsic directional gains 434445.
- Bid-Ask Spread Frictions: Retail investors incur massive transaction costs due to illiquidity and adverse selection around volatile events. Academic analyses reveal that the typical percentage "half-spread" for entering these positions is approximately 8% of the investment, meaning the underlying asset must appreciate significantly merely to overcome the cost of entry 3.
Furthermore, the surge in 0DTE option volume has introduced systemic fragility into broader equity markets. Option market makers hedging these short-dated flows accumulate massive negative gamma exposure. To remain delta-neutral, market makers must trade in the same direction as the prevailing market trend - selling into declining markets and buying into rising markets - thereby amplifying intraday volatility and contributing to an increasingly precarious macroeconomic environment 2.
Macroeconomic Catalysts and the Amplification of Margin Calls
The mathematical fragility of leveraged retail portfolios was brutally exposed during the macroeconomic volatility shocks of August 2024, most notably during the rapid unwinding of the Japanese Yen carry trade. For over a decade, Japan's near-zero and negative interest rates allowed institutional and retail market participants to borrow Yen cheaply to fund higher-yielding global risk assets 5. The Bank for International Settlements (BIS) estimated that off-balance-sheet Yen-denominated loans to non-banks outside Japan had swelled to approximately ¥40 trillion ($250 billion) by early 2024 1119.
However, in late July 2024, the Bank of Japan (BOJ) unexpectedly raised interest rates to 0.25%, precipitating a massive appreciation of the Yen against the U.S. Dollar 5. This dynamic created a perfect storm for leveraged investors: the cost of the funding currency (Yen) surged, while the value of the leveraged assets purchased with those funds declined 4115.
Procyclical Deleveraging and the Volatility Feedback Loop
As the value of leveraged portfolios collapsed, prime brokers and clearinghouses issued immediate margin calls, requiring investors to deposit additional collateral or liquidate positions. The Japan Securities Clearing Corporation, for instance, increased initial margins for long equity index positions by 60% to 80% 4. Because many investors lacked the liquid capital to meet these sudden demands, they were forced into asset fire sales 45. This indiscriminate selling of equities and digital assets - including a rapid 20% decline in Bitcoin - drove prices lower, triggering further margin calls in a textbook example of procyclical deleveraging 411. During this cascade, market participants rushed to purchase options and VIX futures to hedge their exposure, which amplified the spike in the VIX far beyond what historical S&P 500 returns would predict 4.
This episode perfectly illustrates the non-linear danger of leverage during macro shifts. In an unleveraged portfolio, an investor can choose to hold an underwater asset through a period of temporary drawdown. In a leveraged margin or CFD account, the investor is denied this agency. Brokers retain the right to automatically liquidate an account at any time to eliminate a margin deficiency, transforming unrealized drawdowns into permanent, irrecoverable capital destruction 32021.
The Regulatory Shift Toward Intraday Margin Requirements
Reacting to the increasing frequency of intraday volatility spikes, US regulators have begun comprehensively overhauling margin frameworks. Historically, retail margin in the US was governed by end-of-day calculations and the Pattern Day Trader (PDT) rule, which arbitrarily mandated a $25,000 minimum equity balance for frequent traders 6.
Recognizing that end-of-day calculations are structurally insufficient to manage the risks posed by 0DTE options and rapid cross-asset deleveraging, the Financial Industry Regulatory Authority (FINRA) adopted new intraday margin requirements, with a phased implementation culminating in October 2027 6. The new rules abolish the $25,000 PDT minimum and substitute it with a continuous, risk-based mandate requiring traders to maintain adequate maintenance margin - typically 25% for equities - at all times during the trading day 620. If an intraday margin deficit occurs, the brokerage will utilize real-time risk monitoring software to proactively block trades or immediately liquidate positions. Alongside amendments regulating Covered Agency Transaction Margin and advanced Portfolio Margin (which calculates requirements based on maximum potential portfolio loss rather than fixed percentages), this regulatory pivot highlights official acknowledgment that highly leveraged, path-dependent products pose acute systemic risks requiring real-time intervention 620.
Comparative Global Regulatory Frameworks: Arbitrage, Caps, and Counterparty Risk
The structural dangers of leveraged trading have elicited vastly different responses from financial regulators worldwide. The lack of a harmonized global approach has created an environment of regulatory arbitrage, where the specific geographical domicile of a retail trader dictates their access to leverage, their exposure to counterparty risk, and their eligibility for statutory compensation in the event of insolvency.
Comparative Analysis of Leveraged Instruments
To fully grasp the regulatory disparities, it is necessary to contrast the structural mechanics of the three primary vehicles for retail leverage: Reg T Margin, Listed Options, and Contracts for Difference (CFDs).
| Risk Dimension | Reg T Margin (Stock) | Listed Options (0DTEs) | Contracts for Difference (CFDs) |
|---|---|---|---|
| Market Structure | Direct ownership of the underlying asset funded by a broker loan. | Standardized derivative contracts traded on centralized exchanges. | Over-the-counter (OTC) bilateral contracts strictly between trader and broker. |
| Maximum Retail Leverage | 2:1 (50% Initial Margin requirement per Reg T). | High intrinsic leverage via premium pricing; defined risk for buyers, unbounded for naked sellers. | Up to 30:1 for major FX, 20:1 for indices (capped by ESMA/FCA/ASIC). |
| Financing & Holding Costs | High annualized interest rates (often 8-12%) charged daily on borrowed funds. | No daily cash financing charges; leverage is baked into the upfront premium. | Daily overnight financing charges (Benchmark Rate + Markup) deducted from equity. |
| Time-Decay Factors | None. Equity does not decay organically over time. | Severe. Time value (Theta) decays exponentially, accelerating rapidly as 0DTE expiration nears. | None intrinsically, though daily financing acts as a synthetic negative drift over time. |
| Counterparty Risk | Extremely Low. Assets held in custody; protected by SIPC in the event of broker insolvency. | Negligible. Contracts guaranteed by centralized clearinghouses (e.g., OCC). | High. The broker is the direct counterparty to the trade; conflicts of interest and insolvency risk are paramount. |
The Jurisdictional Divide: US vs. UK/EU vs. Australia
The United States (SEC, FINRA, CFTC) The US regulatory regime heavily restricts the distribution of complex OTC derivatives to retail investors. The SEC and CFTC effectively ban the offering of CFDs and retail foreign exchange products that resemble CFDs to retail clients 3. Instead, US retail traders are funneled toward centrally cleared listed options and traditional Reg T margin accounts. While Reg T limits initial equity leverage to 2:1, the explosive volume in the 0DTE options market demonstrates that retail traders have simply migrated to listed derivatives to satisfy their appetite for extreme convexity 3320.
The United Kingdom and European Union (FCA, ESMA) Conversely, the UK and EU permit the trading of CFDs but recognize their devastating impact on retail wealth. Following data showing massive retail losses, ESMA introduced sweeping product intervention measures in 2018, which the FCA subsequently adopted permanently 17. These regulations aggressively cap CFD leverage: 30:1 for major forex pairs, 20:1 for major equity indices, 10:1 for commodities, and 5:1 for individual equities 1736. Crucially, European regulators mandate "Negative Balance Protection," ensuring retail clients cannot lose more than their total account deposit - a vital safeguard against catastrophic gap-risk during macro shocks 17.
The UK also hosts a unique derivative product: Spread Betting. Functionally similar to CFDs, spread bets allow traders to wager a specific monetary amount per point of price movement 4950. The critical distinction lies in taxation; under UK law, spread betting is classified as gambling, rendering all profits entirely exempt from Capital Gains Tax (CGT) and stamp duty for individual traders, whereas CFD profits remain subject to CGT 38495051.
Australia (ASIC) Historically known for a permissive regulatory environment that attracted global CFD brokers, Australia has recently pivoted toward aggressive enforcement. Replicating the ESMA framework, ASIC enacted a Product Intervention Order (PIO) in 2021, imposing identical leverage caps (e.g., 30:1 to 2:1) and mandating negative balance protection. In 2022, this PIO was extended until May 2027 222354.
ASIC has aggressively pursued brokers violating these directives. In a landmark 2024-2025 industry review of 52 licensed CFD issuers (Report 828), ASIC forced the CFD sector to return nearly $40 million to over 38,000 retail investors 235424. The regulator found that over half of CFD issuers had contravened the PIO by offering illegal "margin discounts" to clients holding opposing long and short positions, effectively saddling retail traders with dual financing costs while preventing them from generating net profits on the offsetting positions 235424. ASIC's explicit finding that 68% of retail CFD traders lost money in the 2024 financial year - totaling $458 million in losses and $73 million in fees - underscores the inherent toxicity of the product 235424.
Investor Compensation and Broker Insolvency
The risk profile of leveraged trading is further complicated by the nature of broker custody and counterparty risk. When trading OTC CFDs, the broker acts as the direct counterparty to the trade 721. If the broker defaults or engages in fraudulent activity, the retail trader's capital is severely compromised 721. To mitigate this, global jurisdictions offer varying statutory compensation schemes, though their specific boundaries are frequently misunderstood by retail participants.
In the United States, the Securities Investor Protection Corporation (SIPC) protects customers of insolvent SEC-registered broker-dealers up to $500,000, which includes a strict $250,000 sublimit for uninvested cash 562526. However, a critical caveat exists: SIPC exclusively insures against the loss of the custody function - that is, when assets are stolen or missing during the liquidation of the brokerage firm 562526. SIPC does not function like FDIC deposit insurance; it provides absolutely no protection against market losses, poor investment advice, or the evaporation of leveraged portfolio equity 562526. Furthermore, SIPC coverage generally excludes off-exchange commodity futures, foreign exchange contracts, and unregistered investment contracts, unless they are held in a specialized, SEC-approved portfolio margining account 562526.
In Australia, the regulatory response to widespread broker misconduct culminated in the April 2024 launch of the Compensation Scheme of Last Resort (CSLR). Funded by industry levies and established following the Hayne Royal Commission and the Ramsay Review, the CSLR provides up to $150,000 in compensation to eligible consumers 27602862. To qualify, a consumer must have secured a favorable ruling from the Australian Financial Complaints Authority (AFCA) relating to personal financial advice, credit intermediation, securities dealing, or credit provision, which remains unpaid due to the financial firm's insolvency 27606229. This framework attempts to bridge the critical gap between regulatory enforcement and actual victim restitution, a necessary evolution given the historically high failure rate and misconduct of aggressively marketed OTC derivative brokers.
Conclusion
The persistent retail appetite for leveraged financial instruments is driven by a profound misunderstanding of asymmetric risk profiles and the mathematical realities of path dependence. The empirical evidence demonstrates that leverage does not merely scale linear returns; it introduces exponential vulnerabilities through volatility drag, continuously eroding capital through structural holding costs and implied volatility crush. The mathematical laws governing the probability of ruin dictate that even strategies possessing a positive statistical edge will systematically fail when excess leverage reduces the portfolio's survivability horizon, a dynamic further worsened by the behavioral biases of human traders during periods of intense market volatility.
The global regulatory landscape reflects an uneasy, fragmented consensus regarding these dangers. While the United States relies on instrument prohibition (banning CFDs) and dynamic intraday margin monitoring to contain systemic risk, European and Australian regulators attempt to domesticate OTC derivatives through stringent leverage caps, negative balance protections, and aggressive retroactive compensation schemes. Ultimately, the synthesis of mathematical friction, macroeconomic fragility, and structural financing costs guarantees that highly leveraged retail trading remains fundamentally disadvantaged, serving primarily as an asymmetric mechanism for transferring wealth from speculative retail participants to institutional market makers and brokerages.