Outcome-Driven Innovation and the opportunity algorithm
Theoretical Origins and Development
The paradigm of product development has historically struggled with a high rate of commercial failure, frequently attributed to a foundational misunderstanding of customer needs and an overreliance on subjective ideation. Outcome-Driven Innovation (ODI) was developed to rectify these structural flaws. Conceptualized and refined by Anthony W. Ulwick beginning in the early 1990s, the methodology posits that consumers do not inherently desire products or services; rather, they "hire" these offerings to execute specific, functional tasks or "jobs" 12. Operating on the premise that innovation can be transformed from a probabilistic creative endeavor into a highly predictable, mathematically rigorous science, ODI shifts the locus of analysis from the product itself to the underlying processes customers attempt to complete 34.
The developmental origins of the framework trace back to Ulwick's tenure as a senior product manager at IBM during the 1980s. Following the commercial failure of a heavily researched product, Ulwick sought to apply the rigorous process-control mechanisms of Six Sigma, Quality Function Deployment (QFD), and TRIZ to the discipline of innovation 2. This synthesis led to the realization that if a customer's job is treated as a business process, it can be deconstructed into discrete steps, measured, and systematically improved 25. After demonstrating significant commercial success with Cordis Corporation in 1992 - reportedly driving their market share from 1% to 20% - Ulwick founded the consulting firm Strategyn in 1999 to formalize and commercialize the methodology 26.
In 1999, Ulwick introduced his methodology to Harvard Business School professor Clayton Christensen. Christensen integrated these concepts into his seminal 2003 publication, The Innovator's Solution, effectively popularizing the "Jobs-to-be-Done" (JTBD) nomenclature 1267. Over subsequent decades, the interpretation of JTBD diverged into two distinct academic and operational camps. The "Jobs-As-Progress" theory, championed by Christensen and Bob Moesta, interprets a job through a psychological and emotional lens, defining it as a consumer's desire to make positive progress or life changes 789. In contrast, Ulwick's ODI framework represents the "Jobs-As-Activities" ideology. This model maintains a strictly functional, utilitarian perspective, viewing a job as an activity where the objective is to improve the efficiency, speed, or cost-effectiveness of the execution process 8.
The Outcome-Driven Innovation Methodology
The ODI process requires organizations to abandon traditional methods of capturing the "Voice of the Customer" (VOC), which often involve asking consumers what features they want in a future product 110. The methodology asserts that customers lack the engineering or design expertise to conceptualize breakthrough solutions, inevitably leading to incremental or "me-too" products 10. Instead, ODI operates as a front-loaded, predictive sequence consisting of market definition, qualitative outcome extraction, quantitative validation, and strategic market segmentation 45.
Market Definition and Job Mapping
The foundational step in the ODI framework involves redefining the boundaries of the market itself. Conventional business strategy defines markets around specific product categories, underlying technologies, or demographic cohorts 14. Because technologies inevitably become obsolete and demographic profiles rarely correlate with unified purchasing behavior, these definitions are viewed as volatile and misaligned with value creation 411. ODI redefines a market as a specific group of people combined with the core functional job they are attempting to execute 49.
Once the market is defined by the job rather than the product, strategists utilize a tool known as the Universal Job Map. The Job Map visually deconstructs the core functional task into a chronological sequence of steps, completely independent of the solutions or technologies currently utilized to perform them 121314. The lifecycle of a universal job typically contains eight phases: defining objectives, locating inputs, preparing the environment, confirming readiness, executing the core task, monitoring progress, making modifications, and concluding the process 14.
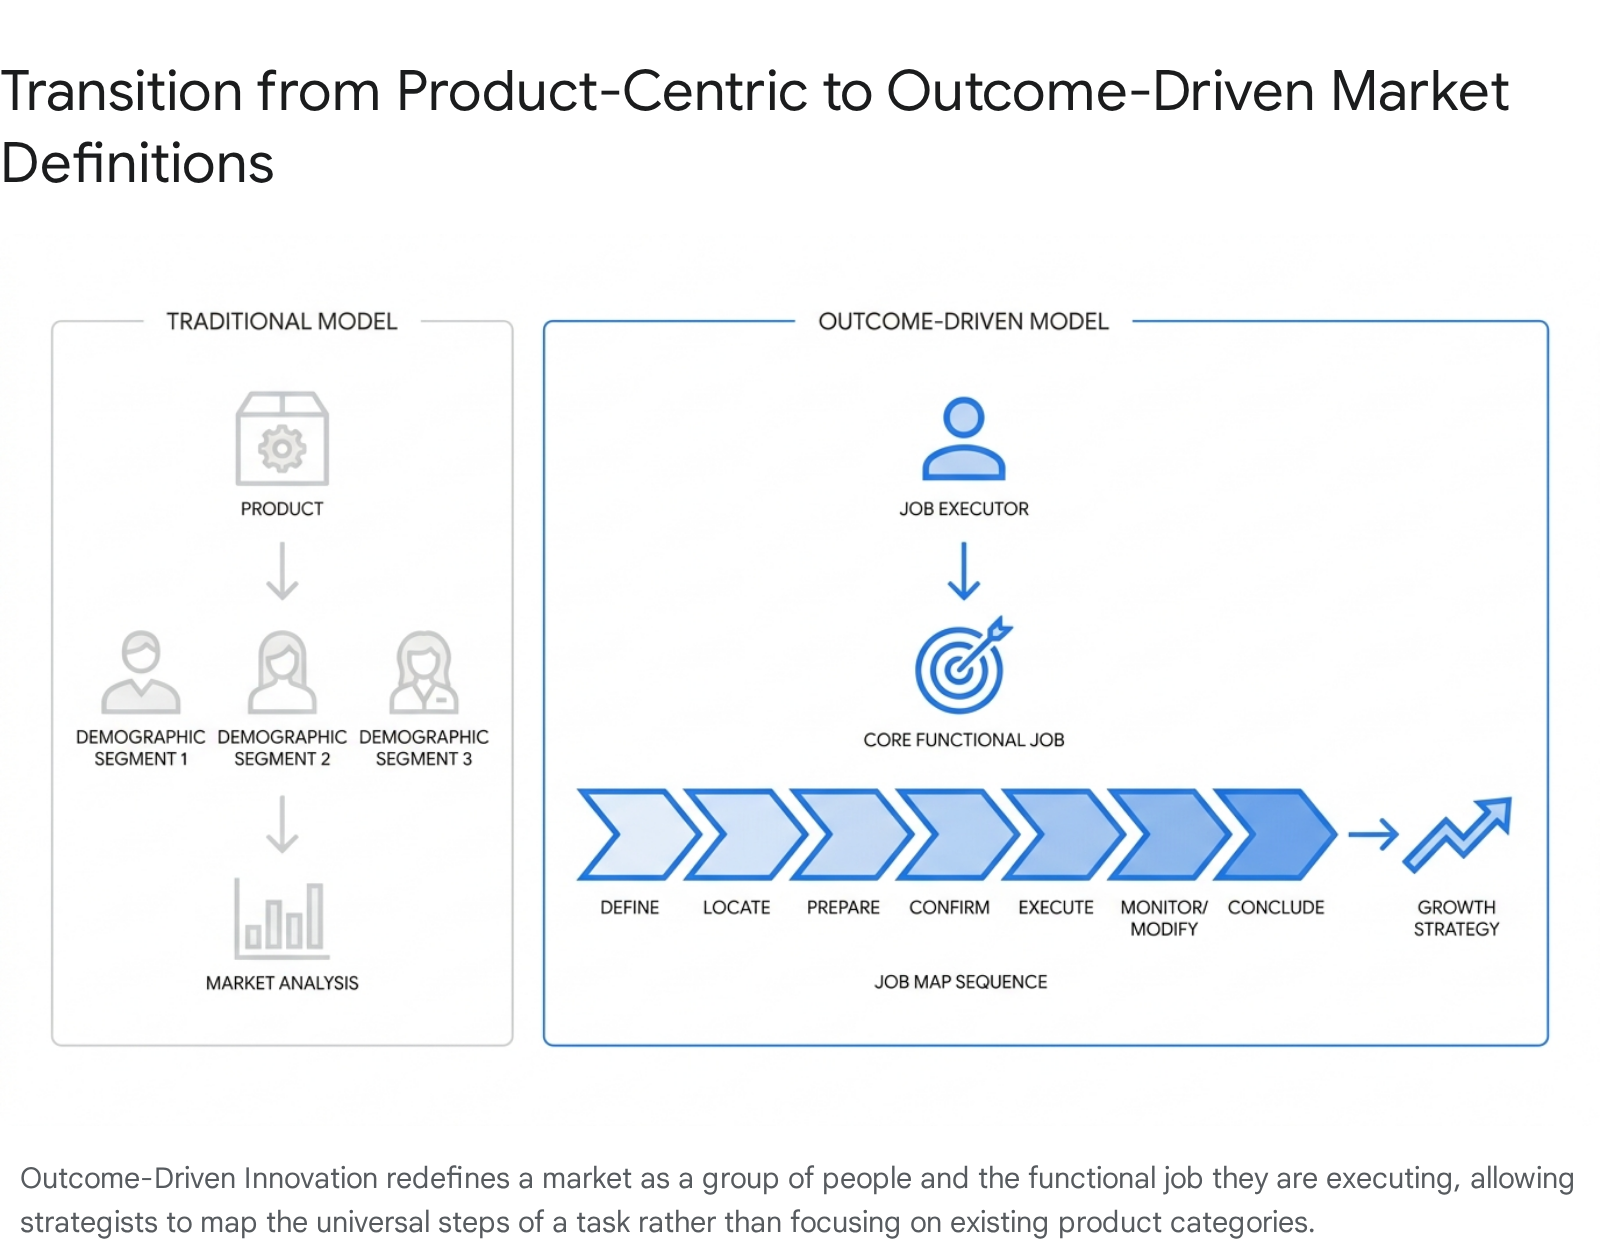
By mapping the job horizontally across these universal phases, analysts can pinpoint upstream and downstream friction points that product-centric views entirely obscure 1213.
Outcome Extraction and Formulation Syntax
With the Job Map established, qualitative research is conducted to extract "desired outcomes" from the target audience. In the ODI lexicon, a desired outcome is a highly precise, solution-agnostic metric that a customer inherently uses to gauge the successful execution of a specific step within the Job Map 41115. An exhaustive qualitative phase typically uncovers between 50 and 150 distinct outcome statements for a single core job 111315.
To ensure these statements are empirically measurable, unambiguous, and stable over time, ODI enforces a highly rigid linguistic syntax 1011. A correctly formulated outcome statement must commence with a direction of improvement - nearly always "minimize" or "maximize" - followed by a specific unit of measurement, such as time, likelihood, or effort, and conclude with the contextual condition 1016. For example, rather than capturing a vague customer preference such as "make the software easier to use," an ODI practitioner translates the need into a functional outcome metric: "minimize the time it takes to verify data compliance before export" 1115. This transformation from subjective preference to objective metric constitutes the foundation for the subsequent quantitative analysis.
Opportunity Algorithm Mechanics
The transition from qualitative discovery to quantitative prioritization represents the defining characteristic of the ODI framework. Strategyn asserts that conventional gap analysis, which evaluates the simple arithmetic difference between importance and satisfaction, fails to adequately prioritize extreme customer struggles 1. To resolve this, Ulwick engineered the Opportunity Algorithm, a mathematical formula designed to identify with statistical certainty which of the 100 or more desired outcomes present the most lucrative avenues for resource deployment 111315.
Survey Deployment and Data Capture
The execution of the Opportunity Algorithm relies entirely on primary quantitative research. Analysts deploy a comprehensive survey instrument to a statistically valid, representative sample of the target market, typically requiring between 180 and 600 respondents 16. Respondents are presented with the complete inventory of 50 to 150 outcome statements and are asked to rate each statement across two distinct dimensions using a Likert scale.
The first dimension measures the fundamental Importance of achieving the specific outcome 1617. The second dimension measures the customer's current level of Satisfaction regarding their ability to achieve that outcome utilizing whatever incumbent solutions, manual workarounds, or competitive products they presently employ 1617.
When utilizing a standard 1-to-5 scale, the methodology focuses primarily on the top-two boxes. The raw score is calculated by determining the percentage of the respondent population that selects a 4 or 5 (indicating "very/extremely important" or "very/extremely satisfied") 21. This percentage is then normalized onto a 10-point scale. If 82% of the surveyed population rates an outcome as highly important, the mathematical Importance Score for the algorithm is recorded as 8.2 21.
Mathematical Formulations and Thresholds
The Opportunity Algorithm generates a final composite score by applying the normalized data to the following formula:
Opportunity = Importance + max(0, Importance - Satisfaction) 1151718.
The architecture of this formula is intentional. The baseline equation doubles the weight of the Importance variable while adding the deficit between Importance and Satisfaction 11718. By penalizing outcomes where current solutions already satisfy the market, the algorithm forces highly critical but poorly resolved issues to the top of the prioritization hierarchy 1719. The inclusion of the max(0) function serves a specific bounding purpose: it ensures that in scenarios where satisfaction exceeds importance, the resulting negative deficit does not subtract from the baseline importance score, thereby establishing a floor for the gap calculation 1417.
The mathematical output is an Opportunity Score bounded between 0 and 20. ODI literature provides strict threshold categorizations to guide executive decision-making based on these outputs 142119.
| Priority Classification | Score Range | Market Condition | Strategic Directives |
|---|---|---|---|
| Extreme Opportunity | 15.0 - 20.0 | Highly Underserved | Primary targets for transformative innovation. Customers experience severe struggle and demonstrate high willingness to pay a premium for solutions. |
| High Opportunity | 12.0 - 14.9 | Underserved | Strong candidates for differentiated features, competitive positioning, and sustained research and development investment. |
| Solid Opportunity | 10.0 - 11.9 | Moderately Underserved | Viable targets for incremental improvements, though insufficient to independently anchor a disruptive market entry. |
| Table Stakes | Low Importance / High Satisfaction Gap | Appropriately Served | Outcomes where satisfaction mirrors importance. The organization must maintain baseline performance to remain viable, but further investment yields rapidly diminishing returns. |
| Irrelevant Excess | < 10.0 (High Satisfaction / Low Importance) | Overserved Market | Outcomes where the market is saturated with complex solutions for trivial needs. Represents opportunities to reduce product cost, strip away bloat, and deploy disruptive strategies. |
The algorithm allows product teams to definitively bypass internal political debates and subjective executive opinions by relying on objective, customer-defined metrics 19. For example, if B2B software users rate a specific data-reconciliation feature at an importance of 9.0 but a satisfaction of 3.0, the resulting Opportunity Score of 15.0 immediately flags it as an extreme priority, superseding aesthetically pleasing but functionally trivial requests 1719.
Strategic Market Segmentation
While calculating aggregate opportunity scores establishes a baseline understanding of market demands, the ODI framework achieves its highest predictive validity through its proprietary approach to market segmentation 1120.
Outcome-Based Clustering
Traditional market analysis generally relies on demographic variables, psychographic profiles, or behavioral classifications to define target audiences. Strategyn argues that these conventional methodologies generate "phantom segments," as individuals within the same demographic bracket or industry vertical rarely share identical functional struggles 111.
To circumvent this limitation, the ODI methodology performs outcome-based segmentation. By applying clustering algorithms directly to the quantitative survey data, practitioners discover distinct groups of people who share the exact same pattern of unmet needs, regardless of their age, geographic location, or corporate title 111520. For instance, within a project management software market, outcome-based clustering might reveal a hidden segment of users highly underserved in outcomes related to resource capacity planning, while a secondary segment is overserved by existing complex scheduling features 111921. This data-backed segmentation enables highly surgical product positioning and eliminates the financial waste associated with marketing monolithic solutions to disparate audiences 1120.
The Opportunity Landscape Matrix
To translate statistical segmentation into actionable corporate strategy, the aggregated data is plotted onto a visual diagnostic tool called the Opportunity Landscape 15. The landscape operates as a two-dimensional scatter plot, mapping the Importance score on one axis against the Satisfaction score on the other. This mapping distributes the 50 to 150 customer outcomes across distinct strategic quadrants 1415.
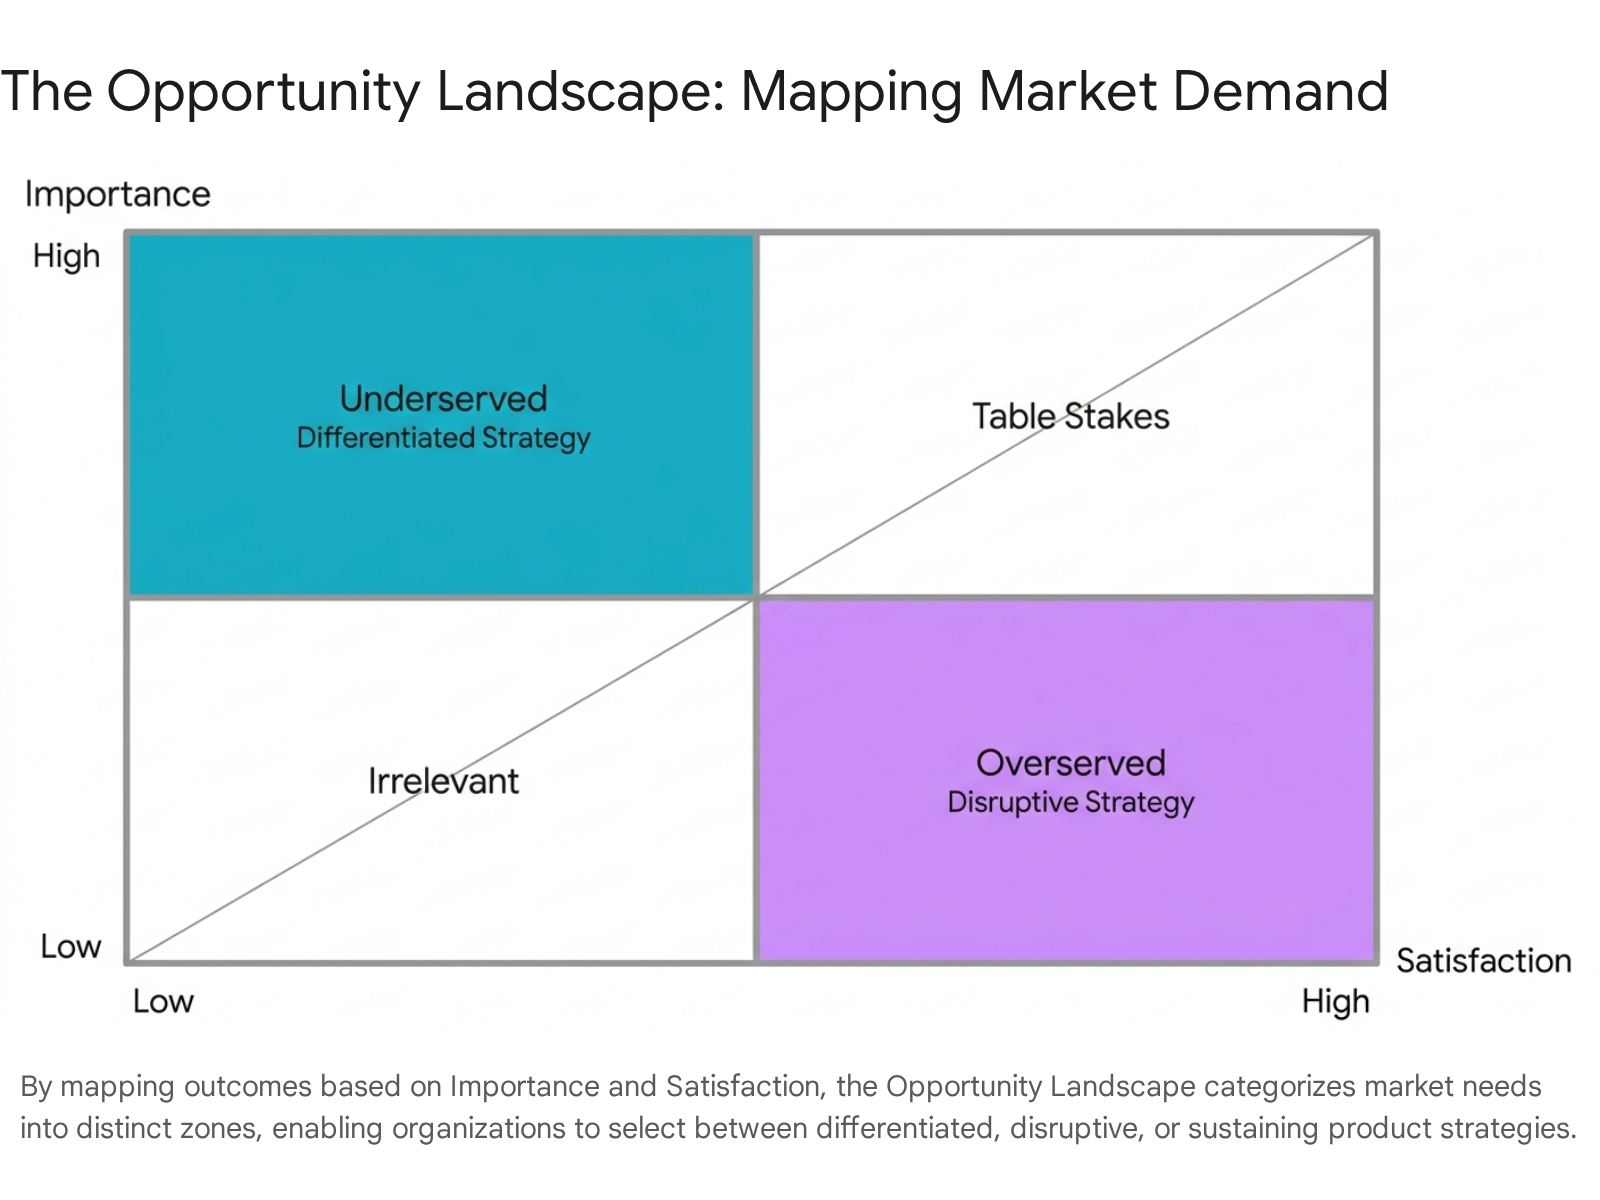
The upper-left quadrant of the landscape visualizes the Underserved Market. Outcomes clustered here exhibit high importance and low satisfaction, directly correlating to high Opportunity Scores 1415. Organizations targeting this quadrant must adopt a differentiated strategy, engineering premium features that demonstrably resolve the customer's struggles better than existing alternatives .
Conversely, the lower-right quadrant maps the Overserved Market, where outcomes possess low importance but high satisfaction. In these zones, incumbent competitors have typically over-engineered their products, providing complex features that the customer ultimately does not value 14. Outcomes in this quadrant signal that the market is ripe for a disruptive strategy 15. An invading company can capture market share by stripping away irrelevant excess, simplifying the user experience, and offering a significantly cheaper solution that fulfills the core job without the unnecessary technological bloat 14.
Applications in Software and Cloud Architecture
While Tony Ulwick initially tested the ODI framework within hardware manufacturing and the medical device sector, the methodology has demonstrated profound relevance in the contemporary Software-as-a-Service (SaaS) economy. The global SaaS market, which surpassed $315 billion in valuations by the mid-2020s, is characterized by aggressive consolidation and an uncompromising demand for workflow efficiency 222328. In this environment, software that fails to align precisely with user outcomes is rapidly abandoned in favor of intuitive, outcome-centric alternatives.
Strategic Validations in File Synchronization
The early trajectory of Dropbox serves as a definitive case study in addressing highly underserved outcomes without relying on technological invention. Dropbox did not invent the concept of cloud storage; enterprise solutions from Microsoft, Google, and Box already existed in the market 2425. However, those incumbent platforms were heavily siloed, tying their storage solutions to proprietary document ecosystems 2425.
Analyzed through the lens of ODI, Dropbox identified an extreme opportunity score regarding cross-platform collaboration. The target user's core job was not simply "store data," but rather to manage and share assets across fragmented operating systems and hardware environments without friction. The competitors were overserving the market with complex enterprise administrative features while underserving the fundamental need to "minimize the likelihood that files are siloed when collaborating across different corporate environments" 2425. By focusing singularly on this underserved outcome - ensuring cross-platform synchronization that "just worked" - Dropbox secured massive adoption among freelancers and modern knowledge workers 2526. Furthermore, the company reinforced its outcome-driven strategy by integrating Google Workspace and Microsoft Office directly into its architecture, prioritizing the customer's desired outcome of seamless workflow over the traditional enterprise strategy of monopolizing the software ecosystem 24.
Failure Modes in Collaboration Software
Conversely, ignoring the principles of the Opportunity Algorithm and focusing on internal assumptions rather than customer outcomes often leads to rapid commercial decline. The trajectory of InVision illustrates the dangers of misaligned innovation. Once a $2 billion market leader in design prototyping relied upon by major technology firms, InVision suffered a catastrophic collapse, ultimately shutting down its core design collaboration services in 2024 27.
The failure stemmed from abandoning its core functional job in favor of peripheral feature bloat. While customers required tools to execute rapid, seamless prototyping, InVision diverted development resources into building tangential whiteboards and workflow management tools - areas where the market was likely already appropriately served or where InVision held no competitive advantage 27. Simultaneously, competitor Figma recognized an underserved outcome: the need to minimize the friction of context-switching between design creation and interactive prototyping. By addressing this highly critical gap with a unified, browser-based solution, Figma captured the market while InVision fell victim to the exact inefficiencies the ODI methodology is designed to prevent 27.
The integration of Artificial Intelligence into SaaS platforms follows a similar outcome-driven mandate. Rather than indiscriminately deploying generative AI, successful platforms isolate historically tedious steps in a user's job map and apply algorithmic automation to achieve specific outcomes, such as minimizing the time required to synthesize meeting notes or reducing the likelihood of manual data-entry errors 282834.
Platform Design and Deep Learning Enhancements
As digital ecosystems evolve, the fundamental principles of Outcome-Driven Innovation have been adapted to address multi-sided platforms and advanced data analytics.
Systemic Job Mapping for Platform Ecosystems
In traditional ODI, the analysis revolves around a single core functional job executed by an individual customer. However, the rise of multi-sided marketplaces and complex digital ecosystems requires a broader structural approach. Frameworks such as the Platform Design Toolkit integrate Ulwick's methodology by transitioning from a singular functional job to a "core systemic job" 12.
Under this adapted framework, an entire marketplace or "Arena" is mapped to understand the interactions of all participating entities - both consumers and producers 12. The Universal Job Map is utilized to frame the lifecycle of the ecosystem, while outcome-based segmentation identifies where both sides of the platform experience friction. Platform designers analyze three key categories of platform gains: general value gains, convenience gains (performing tasks faster or cheaper), and scope/connection gains (minimizing the effort to find the correct niche producer) 12. By quantifying outcomes across these dimensions, platform architects can determine whether to launch with a disruptive tool strategy to acquire supply, or a dominant marketplace strategy to capture demand 12.
Algorithmic Extraction of Customer Needs
The most persistent operational hurdle in deploying ODI is the significant time and financial investment required for the qualitative discovery phase. Extracting 100 to 200 nuanced outcome statements historically demanded dozens of rigorous, manual customer interviews conducted by specialized practitioners 29.
Recent academic research has demonstrated the viability of automating this discovery process using advanced natural language processing. A study published in the journal Sustainability (MDPI) proposed a data-driven method utilizing BERT-based deep learning models to systematically extract job-to-be-done metrics directly from massive datasets of online customer reviews 29. Focusing on the service sector - specifically the hotel industry - researchers deployed a 12-step "Service job map" to categorize unprompted customer feedback.
The deep learning model successfully classified customer statements into outcome categories, allowing researchers to calculate Service Opportunity Scores (SOS) without conducting a single survey. The algorithmic analysis accurately identified severe market deficits, assigning a massive SOS of 14.0 to the outcome of "maximizing safety to pay price/deposit" and a 12.5 to "maximizing the possibility to avoid waiting at the lobby" 29. While the neural networks still struggle with grammatically informal text and require human experts to finalize the syntax of clustered statements, this synthesis of big data and ODI principles represents a critical evolution in identifying unmet needs at scale 29.
Methodological Critiques and Limitations
Despite its documented successes and mathematical precision, the Outcome-Driven Innovation framework has encountered rigorous skepticism from both academic researchers and veteran market analysis practitioners. Critiques generally focus on the psychological constraints imposed by the methodology's linguistic rules and the statistical validity of the Opportunity Algorithm itself.
Linguistic Syntax and Survey Fatigue
A central pillar of the ODI framework is the translation of all customer inputs into a strict, standardized syntax (e.g., "minimize the likelihood..."). Prominent industry voices, notably Gerry Katz of Applied Marketing Science, argue that this rigid formatting replaces the authentic "Voice of the Customer" with the sterile "Voice of the Market Researcher" 10. Critics maintain that forcing organic consumer desires into mechanical structures strips away vital emotional context and nuance. Furthermore, the methodology explicitly rejects the existence of "latent needs," assuming that all consumer desires can be extracted through direct questioning, entirely dismissing the value of ethnographic observation in discovering unarticulated struggles 510.
The operational reality of deploying ODI surveys presents additional liabilities. Presenting a respondent with over 100 densely worded outcome statements, each requiring evaluation across two separate Likert scales, induces profound respondent fatigue 10. Controlled experiments demonstrate that surveys formatted with ODI syntax experience a 40% higher dropout rate and take 21% longer to complete than surveys utilizing natural, conversational language 1036. As fatigue sets in, data integrity plummets. Respondents confronted with repetitive, double-negative phrasing frequently engage in "straight-lining" or default to neutral middle values simply to complete the questionnaire, generating artificial "pitchfork" distribution patterns that corrupt the final algorithmic output 10.
Statistical Validity of the Opportunity Formula
Beyond data collection challenges, the core mechanics of the Opportunity Algorithm have been scrutinized. Market researchers, including MIT professor John Hauser, have labeled the algorithm "pseudo-scientific" due to its fundamental mathematical architecture 10.
The critique centers on the manipulation of ordinal data. The Likert scale utilized to measure Importance and Satisfaction produces ordinal values, indicating rank order rather than precise continuous magnitudes. The distance between a "4" and a "5" is not mathematically guaranteed to equal the distance between a "2" and a "3" 1036. Consequently, subtracting an ordinal Satisfaction score from an ordinal Importance score violates standard statistical assumptions, a practice critics liken to "subtracting apples from broccoli" 10.
Additionally, the algorithm's utilization of the max(0) function imposes a structural lower limit that prevents the model from differentiating among various categories of low-importance needs 10. This mathematical floor inherently biases the framework against discovering "delight" features - unexpected innovations that hold low initial stated importance but generate massive satisfaction and brand loyalty upon deployment 10.
Comparisons with Iterative Development Frameworks
The modern technological landscape relies heavily on frameworks such as Lean Startup and Agile Development. Understanding how ODI contrasts and complements these methodologies clarifies its specific utility within the broader product development lifecycle.
Predictive Validation Versus Rapid Experimentation
Outcome-Driven Innovation operates on a fundamentally predictive philosophy. The framework is entirely front-loaded, anchored in the belief that if an organization exhaustively maps the problem space and mathematically isolates unmet outcomes prior to engineering, commercial success becomes highly predictable 113738. ODI seeks to eliminate uncertainty through exhaustive quantitative analysis before any capital is committed to building a solution 5.
In direct contrast, the Lean Startup methodology, popularized by Eric Ries, operates on an iterative philosophy of validated learning 38394041. Lean Startup embraces the premise of extreme market uncertainty, suggesting that pre-development surveys are inherently flawed because customers cannot accurately predict their future behavior regarding non-existent products 39. Instead of front-loaded research, Lean Startup advocates for the rapid deployment of a Minimum Viable Product (MVP) to gather behavioral data in real-world conditions 404130. The core mechanism is the "Build-Measure-Learn" loop, prioritizing speed, market adaptability, and the willingness to pivot based on empirical feedback 404143.
Agile Software Development, distinct from both ODI and Lean Startup, is not an innovation discovery framework but a delivery execution engine 433132. Agile methodologies, such as Scrum or Kanban, focus on reducing cycle times and eliminating waste during the engineering process by delivering functional software in short, adaptive increments 30433133. Agile ensures that a product is built efficiently, but it cannot independently guarantee that the right product is being built 3930.
| Framework Attribute | Outcome-Driven Innovation (ODI) | Lean Startup | Agile Software Development |
|---|---|---|---|
| Philosophical Basis | Innovation is a predictable science requiring exhaustive upfront mapping of unmet needs. | Innovation requires navigating extreme uncertainty through rapid market experimentation. | Software development requires adaptive planning and continuous delivery of functional increments. |
| Primary Mechanism | Outcome formulation, quantitative surveys, and the Opportunity Algorithm. | The Build-Measure-Learn feedback loop and Minimum Viable Products (MVPs). | Timeboxed sprints (Scrum) or continuous flow (Kanban) based on the Deming PDCA cycle. |
| Target Phase | Problem Discovery and Strategic Market Selection. | Solution Validation and Business Model Formulation. | Engineering Execution and Product Delivery. |
| Risk Mitigation Strategy | Mitigates commercial risk by deeply analyzing the problem space before building. | Mitigates commercial risk by testing solution hypotheses during the building phase. | Mitigates execution risk by adapting to changing technical requirements late in development. |
| Recognized Vulnerabilities | High upfront cost, severe survey fatigue, and relies heavily on stated (not behavioral) data. | Can result in efficiently building the wrong product if the core customer problem is initially misunderstood. | Focuses entirely on delivery efficiency, offering no mechanism to ensure the product is commercially viable. |
Synergistic Application Across Development Lifecycles
While these frameworks are frequently positioned as competing ideologies, sophisticated organizations integrate them synergistically to form a comprehensive development pipeline 3383943. The frameworks do not compete; they excel at different stages of maturity 38.
Outcome-Driven Innovation is optimally deployed during the strategic discovery phase. By utilizing the Opportunity Algorithm, executive teams can mathematically confirm which specific outcomes represent the highest value deficits, providing a definitive target for innovation efforts 33843. Once ODI dictates what needs to be achieved, Lean Startup principles take over to determine how to achieve it. Product teams can develop MVPs specifically engineered to address the top-scoring underserved outcomes, putting prototypes into the market to validate the proposed solutions through behavioral learning 3374043. Finally, as the solution gains validated product-market fit, Agile frameworks are employed to scale the engineering architecture rapidly and efficiently, continuously refining the delivery of those essential outcomes 39433132. Through this sequential integration, the mathematical rigor of the Opportunity Algorithm provides the necessary strategic foundation for the rapid, iterative execution of modern software development.