Machine Learning versus Simple Rules in Equity Return Prediction
Introduction
The fundamental objective of empirical asset pricing is the accurate measurement and forecasting of risk premia. For decades, the academic and practitioner consensus relied on parsimonious, low-dimensional models - such as the Capital Asset Pricing Model (CAPM) and the Fama-French multi-factor models - or straightforward heuristic frameworks, including simple moving average (SMA) crossovers and cross-sectional value-momentum sorts. These traditional approaches prioritize theoretical interpretability and statistical simplicity to guard against the persistent threat of overfitting in financial data, which is notoriously noisy, non-stationary, and subject to structural breaks 113.
However, the proliferation of big data and advanced computational power has catalyzed a paradigm shift toward high-dimensional machine learning (ML) architectures. Recent comprehensive studies demonstrate that algorithms capable of mapping complex, non-linear predictor interactions - such as Random Forests (RF), Gradient Boosted Trees (GBT), and Deep Neural Networks (DNN) - can achieve unprecedented out-of-sample predictive accuracy 1423. Proponents of this shift argue for a "virtue of complexity," suggesting that heavily parameterized models capture authentic market dynamics that linear frameworks systematically ignore 7894.
The absolute superiority of machine learning in equity return prediction remains fiercely contested. Critics and emerging empirical literature highlight that the extraordinary theoretical gross returns of machine learning models often evaporate when exposed to real-world market frictions, a phenomenon formally termed the transaction cost trap 56. High-capacity models frequently generate signals reliant on micro-cap stocks, high-frequency turnover, and transient anomalies, yielding portfolios that are economically unviable net of execution costs 67. Consequently, simple rules characterized by low turnover, macroeconomic resilience, and intuitive risk exposure continue to serve as highly competitive, and sometimes superior, benchmarks in applied settings 141516.
This analysis exhaustively evaluates the comparative efficacy of machine learning models against simple heuristic rules in equity return prediction. The report synthesizes evidence on theoretical model complexity, gross out-of-sample statistical performance, the mitigating effects of transaction costs, the impact of macroeconomic regime shifts, and the integration of novel techniques such as Large Language Models (LLMs) and cost-aware neural architectures.
Theoretical Frameworks in Asset Pricing
The debate between simple heuristics and complex algorithms requires a deep examination of the underlying theoretical frameworks governing statistical prediction in financial markets. Asset pricing fundamentally attempts to isolate the expected return signal from the overwhelming noise inherent in equity price movements.
Limitations of Traditional Linear Models
The traditional econometric approach to predicting the cross-section and time-series of stock returns relies on Ordinary Least Squares (OLS) regressions and its variants. In these models, expected returns are modeled as a linear function of observable firm characteristics, such as book-to-market ratio, market capitalization, operating profitability, or macroeconomic variables 1417. While these models offer supreme clarity and interpretability, they impose severe structural limitations. Specifically, they assume that variables operate independently and that their relationships to returns are strictly linear and constant over time 118.
Traditional linear models struggle with the high dimensionality of modern financial datasets. The ever-increasing "factor zoo" leads to an abundance of free parameters, resulting in inefficient estimations when using traditional regression-based models 1. Furthermore, strict parametric assumptions, such as homoskedasticity and the independence of errors, are frequently violated by financial time series, which exhibit volatility clustering and heavy-tailed distributions 178.
Machine Learning and Non-Linearity
Machine learning models diverge from the linear paradigm by accommodating an expansive universe of potential predictors and relaxing assumptions about functional form. Algorithms such as Random Forests and Deep Neural Networks automatically detect and map non-linear relationships and intricate feature interactions that human researchers cannot easily hypothesize 11820. For instance, a firm's high valuation multiple might predict negative returns under normal market volatility, but predict massive positive momentum during a period of abnormally high corporate news flow 18.
Tree-based algorithms naturally segment the data to capture these conditional, regime-dependent thresholds without requiring prior specification by the researcher. Furthermore, machine learning frameworks handle multicollinearity far better than standard OLS models. Random Forest models, for instance, are estimated without requiring the inversion of a covariance matrix, freeing them from the instability that plagues linear regressions when independent variables are highly correlated 417.
The Virtue of Complexity Theory
A core theoretical debate in financial machine learning revolves around model parameterization. The conventional statistical wisdom - rooted in the bias-variance tradeoff - dictates that models with more parameters than observations will invariably overfit noise, leading to catastrophic out-of-sample failures. Consequently, traditionalists advocate for parsimonious models 7.
Recent research profoundly challenges this orthodoxy. Theoretical proofs and empirical analyses centered on the "virtue of complexity" demonstrate that extremely high-dimensional models can thrive out-of-sample, provided that appropriate implicit or explicit regularization (shrinkage) is applied 894. When models are sufficiently over-parameterized - such as in deep neural networks with parameters far exceeding the number of historical observations - the optimization landscape smooths out. This allows the model to perfectly interpolate the training data (a ridgeless regression) while maintaining a structural simplicity that generalizes well to unseen data 49.
Advocates argue that the data-generating processes in equity markets are inherently hyper-complex. Therefore, attempting to fit financial data with a simple three-factor or five-factor linear model fundamentally under-fits reality 79. Empirical testing of this hypothesis across U.S. equities establishes that timing strategies based on highly complex, non-linear machine learning models yield substantial Sharpe ratio improvements relative to simple models, validating the use of deep architectures in expected return modeling 94. The complexity paradigm suggests that researchers should include all plausibly relevant predictors and rely on the model's regularization algorithms to determine feature importance, rather than artificially constraining the model based on human intuition 22.
Algorithmic Architectures in Return Prediction
The umbrella term "machine learning" encompasses a vast array of distinct architectural approaches. The efficacy of these models in predicting equity returns varies significantly based on their capacity to process different types of financial data.
Penalized Linear Models and Trees
To address the limitations of standard OLS, researchers frequently deploy penalized linear regressions, such as Ridge, Lasso, and Elastic Net. These models introduce regularization terms that shrink the coefficients of less relevant predictors toward zero, effectively performing variable selection and mitigating the risk of overfitting in high-dimensional spaces 134. While they improve upon OLS, they remain fundamentally linear.
Tree-based ensemble models represent a significant leap in complexity. Random Forests operate by constructing a multitude of decision trees during training and outputting the mean prediction of the individual trees, which naturally reduces variance and resists overfitting 1710. Gradient Boosted Regression Trees (GBRT), including implementations like XGBoost and LightGBM, build trees sequentially, with each new tree attempting to correct the residual errors of the combined ensemble 24. For tabular financial data - such as panels of firm fundamentals and historical price metrics - gradient boosting is frequently cited as the state-of-the-art methodology, often matching or exceeding the performance of more complex deep learning models 2411.
Deep Neural Networks
Deep Neural Networks (DNNs) consist of an input layer, multiple hidden layers, and an output layer, with neurons connected through weighted links and non-linear activation functions 12. In empirical asset pricing, architectures ranging from one to five hidden layers have been exhaustively tested. Feedforward neural networks excel at identifying highly abstract representations of the input data. However, their vast parameter counts require stringent hyperparameter tuning, cross-validation, and early stopping protocols to prevent the models from memorizing historical noise 4613.
Sequential Models
Because financial markets operate sequentially over time, researchers have adapted models specifically designed for sequence processing. Recurrent Neural Networks (RNNs) model sequential data by updating a hidden state over time, theoretically allowing predictions to depend on historical context 8. However, traditional RNNs struggle to learn long-range dependencies due to the vanishing gradient problem.
Long Short-Term Memory (LSTM) networks solve this by utilizing a complex gating mechanism that can remember or forget information across extended sequences. LSTMs have proven highly effective at capturing temporal paradigms such as seasonal volatility and long-term momentum trends, frequently outperforming traditional feedforward networks in equity prediction 82829.
More recently, attention-based Transformer architectures - the foundation of modern generative AI - have been adapted for quantitative finance. Transformers eliminate recurrence entirely, utilizing self-attention mechanisms to establish connections between all elements in a time series simultaneously 2830. This permits the model to weigh the relevance of distant historical price movements dynamically without the chronological bottleneck of an LSTM 30.
Despite their architectural sophistication, empirical comparisons of Transformers against simpler baselines yield mixed results in tabular financial forecasting. Studies evaluating one-step-ahead return forecasting across major U.S. equities found that while Transformers are competitive, they do not uniformly dominate classical time-series models like ARIMA or simple Random Forests 831. The extraordinary parameter counts of Transformers render them highly susceptible to volatility clustering and regime shifts, meaning their predictive signals in raw price data remain modest and asset-dependent 831.
Empirical Statistical Accuracy and Gross Returns
The theoretical advantages of machine learning translate into measurable statistical and economic outperformance in empirical backtests that exclude transaction costs. Comprehensive studies evaluating the U.S. equity market over decades of data establish a new benchmark for cross-sectional return prediction using machine learning 1214.
Predictive R-Squared Metrics
The primary statistical metric for evaluating return prediction models is the out-of-sample R-squared. In financial forecasting, a positive out-of-sample R-squared indicates that the model's predictions possess lower mean squared error than a naive forecast of the historical average return.
When comparing models, linear methods frequently generate negative out-of-sample R-squared values at the individual stock level and for broad index forecasting. For example, aggregating stock-level forecasts from a benchmark linear model to predict the S&P 500 portfolio return often yields negative predictive variance 313. Conversely, non-linear machine learning methods, particularly tree-based algorithms and deep neural networks, consistently produce positive out-of-sample values across nearly all characteristic portfolios 313.
| Model Category | Specific Method | Out-of-Sample R-squared (Monthly %) | Gross Annualized Sharpe Ratio |
|---|---|---|---|
| Market Benchmark | Buy-and-Hold S&P 500 | N/A | 0.42 - 0.51 |
| Traditional Linear | Ordinary Least Squares (OLS) | -0.11% to -0.22% | 0.89 |
| Tree-Based Ensembles | Random Forest / Gradient Boosting | +1.08% to +1.39% | 1.35 - 1.69 |
| Deep Learning | Neural Networks (3 to 5 layers) | +1.80% | 2.35 |
Table 1: Gross predictive performance across model architectures. Data reflects theoretical gross performance on U.S. equities prior to the application of transaction costs or liquidity constraints, synthesizing findings from foundational empirical asset pricing literature 134613.
Portfolio Sharpe Ratios
This statistical edge maps directly into gross economic utility. Portfolios formed by taking long positions in the highest machine learning-predicted decile of stocks and short positions in the lowest decile routinely achieve annualized Sharpe ratios exceeding 1.0, and in some optimal configurations, greater than 2.0. This represents an improvement of more than double the performance of leading regression-based strategies 3613.
The performance of these models is highly sensitive to portfolio weighting schemes. Equal-weighted portfolios typically exhibit the highest theoretical gross returns and Sharpe ratios because machine learning algorithms frequently extract their strongest predictive signals from highly volatile small-cap and micro-cap stocks. When researchers enforce value-weighting - which diminishes the influence of small-cap anomalies - the gross Sharpe ratio of neural network strategies can drop by approximately 50%, though they still maintain a significant advantage over passive benchmarks and linear regression models 215.
Geographic Variations and Market Structures
The predictive superiority of machine learning is not an artifact isolated to the highly liquid U.S. market; the outperformance demonstrates robustness globally, though the precise algorithmic mechanics shift according to regional market structures.
Developed European Markets
In European equity markets, machine learning methodologies validate the hypothesis that complex interactions enhance predictive performance. However, studies evaluating tens of thousands of individual stocks across advanced European economies reveal that regularized linear models - particularly Ridge and Lasso regressions - often outperform highly non-linear deep learning models. The optimal model choice is market-dependent: Ridge regression dominates forecasting in the United Kingdom and France, while Lasso leads in Germany 3.
The success of these regularized linear models suggests that in certain developed markets, the core predictive signals reside in linear factor exposures that simply require robust high-dimensional variable selection to isolate, rather than deep non-linear interaction mapping 34. Furthermore, machine learning models applied to European datasets consistently demonstrate resilience against model breakdowns, generating their added value predominantly during bear markets when average investors suffer losses 11.
Emerging Markets Dynamics
In emerging markets, the informational inefficiencies present greater opportunities for algorithmic exploitation. Conventional quantitative linear models historically generate raw excess returns of approximately 0.8% per month in emerging stock markets. Implementing tree-based methods elevates this return to 1.0% per month, while deep neural networks and ensemble algorithms achieve up to 1.2% per month 2034. The algorithms successfully process the interactions of known factors - such as price-to-52-week-high, idiosyncratic volatility, and turnover - far more efficiently than linear regressions 34.
Notably, predictive models trained exclusively on developed market data are found to forecast emerging market stock returns nearly as accurately as natively trained emerging market models 35. This cross-regional validity indicates that the underlying non-linear relationships between fundamental firm characteristics and future returns are structurally similar across the globe. However, long-short returns generated in developed markets cannot fully explain out-of-sample returns in emerging markets, suggesting that the actual pricing of these characteristics is not fully integrated between the two market types 35.
Asian markets demonstrate similar algorithmic responsiveness. Forecasting the South Korean KOSPI index and international asset allocations reveals that machine learning models consistently outpace traditional benchmarks in tracking exchange rate impacts and stock market returns, facilitating highly profitable international diversification strategies 363738. Furthermore, research utilizing fundamental business efficiency scores in the Vietnamese stock market highlights that gradient boosted tree models, when combined with automated feature engineering, significantly reduce prediction errors relative to baseline linear models 16.
Baseline Simple Rules and Heuristics
Before definitively concluding that machine learning architectures are inherently superior, their performance must be rigorously contextualized against the strategies they seek to replace: simple heuristic rules. Two prominent benchmarks in quantitative finance are Moving Average crossovers and cross-sectional value-momentum factor sorts.
Moving Average Crossovers
The Simple Moving Average (SMA) crossover - typically triggering a long position when a short-term moving average (e.g., 20-day or 50-day) crosses above a long-term moving average (e.g., 200-day) - is one of the oldest and most widely deployed systematic trading rules 154041.
Recent large-scale evaluations of SMA rules using extensive cross-sectional data reveal surprising insights about their underlying predictive mechanisms. While traditional technical analysis interprets moving averages as trend-following momentum indicators, empirical data indicates that SMA divergence frequently captures mean reversion. A study analyzing millions of U.S. equity observations found that stocks trading furthest below their short-term moving averages systematically outperformed those trading furthest above them, generating an annualized return spread of -13.6% 17.
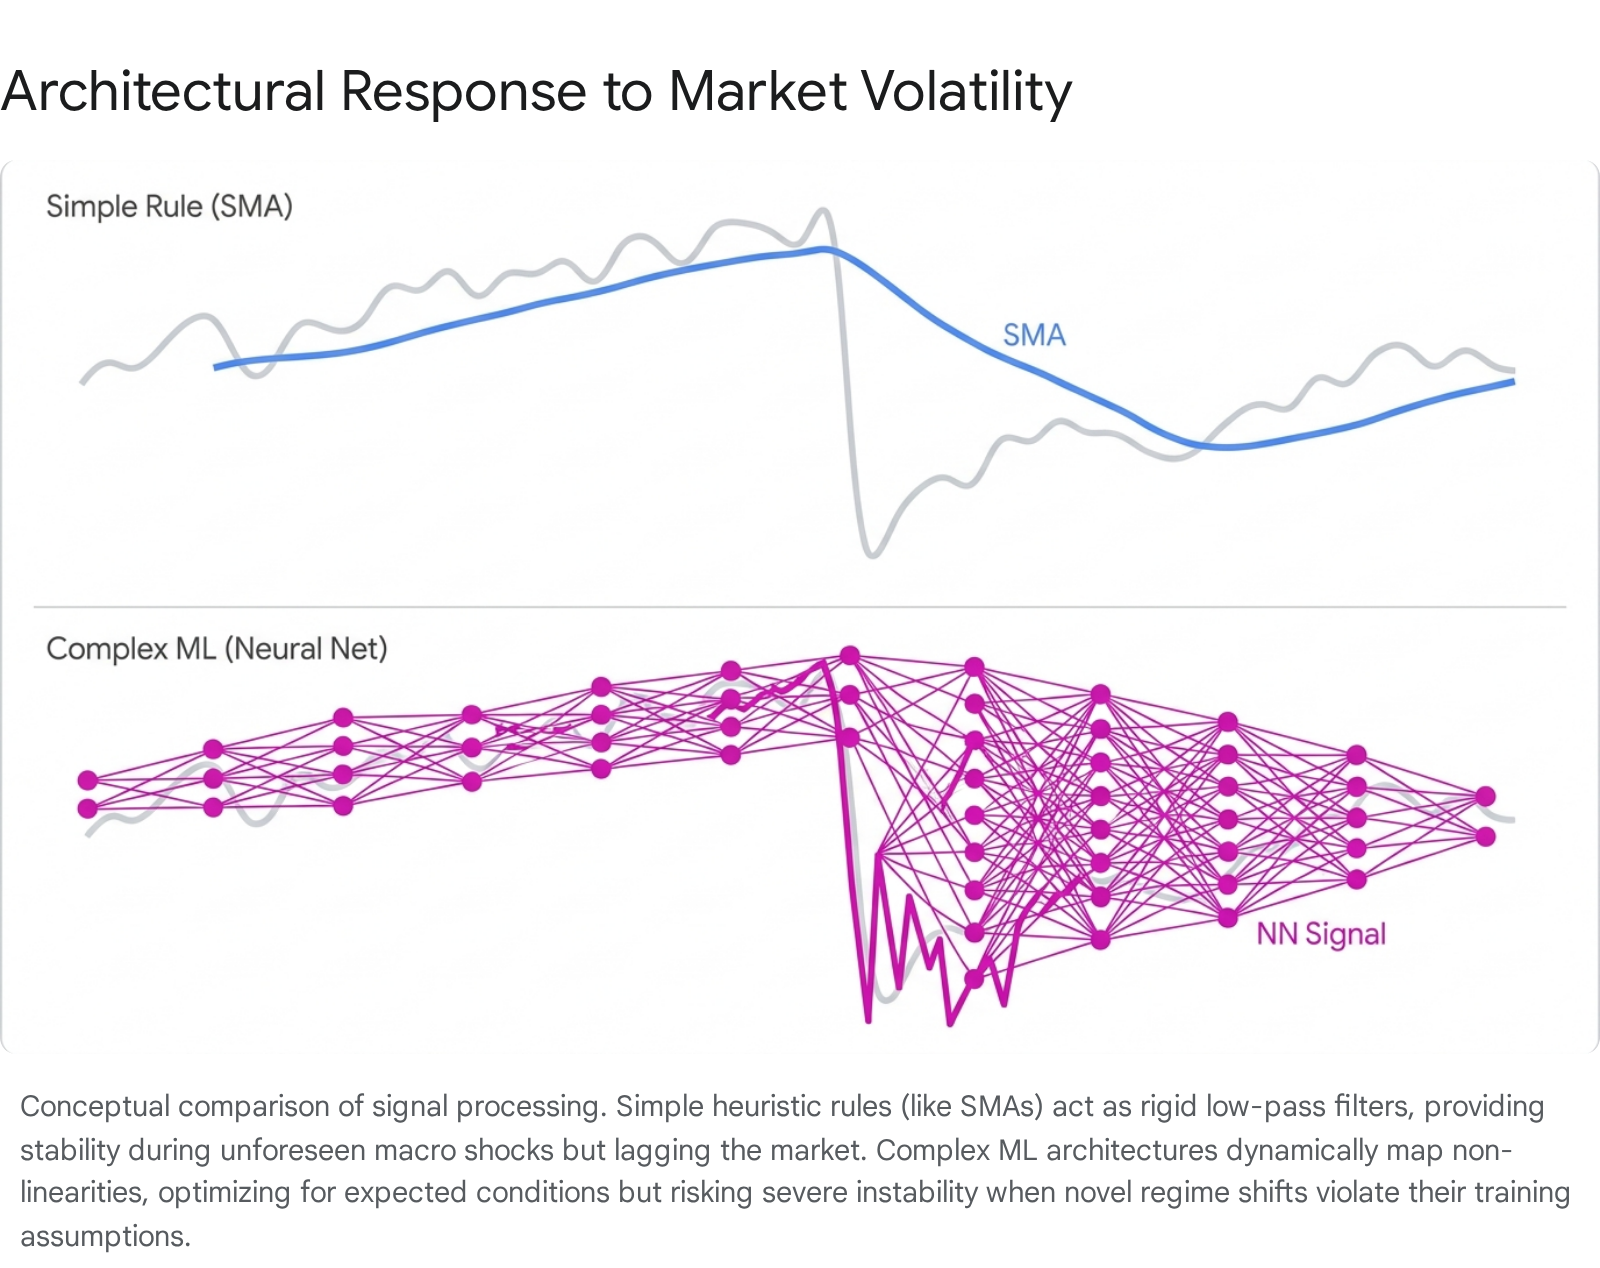
When subjected to rigorous backtesting over multi-decade horizons, SMA timing rules exhibit distinct advantages over complex machine learning models. The primary strength of an SMA strategy is macroeconomic resilience and draw-down protection. Applied to broad market indices, SMA rules often underperform pure "buy-and-hold" strategies in gross returns during secular bull markets, but they systematically avoid the catastrophic drawdowns of major bear markets 1618. Furthermore, because SMA signals shift infrequently, the portfolio turnover is exceptionally low (often limited to three or four round-trip macro trades per year), rendering the strategy highly immune to transaction cost decay 16.
The limitations of simple moving averages are well-documented: they are lagging indicators that suffer severe "whipsaw" losses in sideways, volatile, or choppy markets 151945. To mitigate this, practitioners increasingly use simple rules as baseline signals, utilizing machine learning algorithms purely as secondary filters to confirm volume anomalies or classify the probability of a false breakout, rather than relying on the algorithm to predict the exact return scalar 452047.
Factor Sorts and Momentum
Similarly, simple cross-sectional portfolio sorts based on characteristic momentum (systematically buying historical winners and shorting historical losers) generate persistent, robust returns without the need for high-dimensional fitting or hyperparameter tuning 14.
Machine learning researchers explicitly acknowledge that factor momentum remains the primary driver of cross-sectional variation. In studies utilizing machine learning to forecast which specific stock factors will outperform, factor momentum captures the vast majority of the algorithm's predictability. Once momentum is statistically controlled for, many long-short machine learning portfolios fail to generate any significant alpha 48.
| Performance Metric | Simple Rule (Markowitz Momentum Sort) | Machine Learning (XGBoost Momentum) |
|---|---|---|
| Cumulative Net Value Return | 17.55% | 40.43% |
| Annualized Return | 15.63% | 19.99% |
| Maximum Drawdown | -68.35% | -84.45% |
| Return-to-Drawdown Ratio | 0.26 | 0.31 |
Table 2: Comparative performance of a traditional rule-based momentum sort versus a machine learning (XGBoost) approach over an equivalent testing horizon. While the machine learning model achieves higher absolute returns, it exposes the portfolio to substantially deeper maximum drawdowns, illustrating the trade-off between absolute alpha and structural stability 14.
When directly compared in identical environments, an ML-based momentum strategy yields higher gross cumulative returns than a rule-based strategy. However, the machine learning model exposes the portfolio to substantially higher tail risk, evidenced by much deeper maximum drawdowns 14. The simple rule, while sacrificing absolute return, provides superior structural stability under acute market volatility.
Market Frictions and Implementation Feasibility
The most profound critique of machine learning outperformance in equity prediction lies in the massive gap between theoretical paper returns and implementable net returns. The extreme flexibility that allows machine learning models to map intricate feature interactions also drives them to exploit the most inefficient, illiquid corners of the market. Consequently, machine learning portfolios systematically select difficult-to-arbitrage micro-cap stocks and demand exorbitant portfolio turnover to capture fleeting, small-scale anomalies 67.
The Transaction Cost Trap
When realistic transaction costs - such as effective bid-ask spreads derived from high-frequency TAQ data - are applied to machine learning strategy backtests, the gross outperformance frequently collapses 621. The turnover required to maintain optimal machine learning weightings can routinely exceed 120% per month on a two-sided basis 6.
A highly detailed 2026 empirical study crystallized this phenomenon as "the transaction cost trap." Evaluating a regime-filtered ensemble of leading machine learning algorithms on large-cap equities, researchers found the model achieved an impressive 73.3% conditional directional accuracy in predicting trades. However, after applying a conservative 5 basis point execution cost, the strategy generated a devastating -42.49% annualized return, compared to a +34.77% return for a passive buy-and-hold benchmark over the same period 5.
The mathematical driver of this trap is magnitude asymmetry. The study revealed that winning algorithmic trades generated an average gain of +0.08%, while losing trades resulted in a -0.31% loss. Due to this 3.9x magnitude asymmetry, the expected value per trade becomes severely negative regardless of the high win rate. Furthermore, the model's high trade frequencies (e.g., 471 trades per year) create a mathematical breakeven accuracy threshold of 88%, which is an insurmountable statistical hurdle for current predictive architectures operating in weak-form efficient markets 5. The algorithms successfully detect multi-day institutional execution footprints but fail to isolate the price magnitude that the institutional order suppresses 5.
| Predictive Model | Gross Monthly Return | Monthly Turnover (Two-Sided) | Net Monthly Return | Transaction Cost Reduction |
|---|---|---|---|---|
| OLS-HUBER | 0.49% | 122.11% | 0.29% | -40.8% |
| Neural Network (LSTM1) | 1.64% | 129.56% | 1.42% | -13.4% |
| Neural Network (LSTM2) | 1.27% | 129.07% | 1.06% | -16.5% |
Table 3: The impact of transaction costs on gross returns for linear and deep learning models post-2005. Data demonstrates that while advanced LSTMs retain profitability net-of-costs, the frictional drag severely erodes the theoretical advantage due to massive algorithmic turnover requirements 6.
The Failure of Heuristic Mitigation Strategies
Attempts to salvage machine learning models using standard heuristic cost-mitigation techniques largely fail. Strategies such as filtering out the bottom 20% of stocks by market capitalization, restricting the universe to low transaction cost deciles, or mechanically capping turnover do successfully reduce absolute trading costs 629.
However, these constraints simultaneously destroy the algorithmic alpha. The reduction in gross returns caused by filtering out the highly volatile assets that the machine learning model relies upon is almost always larger than the savings in transaction costs, resulting in a net negative impact on the portfolio's Sharpe ratio 629. The only heuristic mitigation that marginally improves net performance is artificially extending the holding period to two or three months, which drastically curbs trading frequency but dilutes the immediacy of the predictive signal 6.
Methodological Vulnerabilities
Beyond physical market frictions, machine learning research in quantitative finance is uniquely susceptible to methodological flaws that systematically inflate perceived outperformance.
Multiple Testing and Overfitting
Because the parameter space in machine learning is vast and the historical record of equity prices is a single, unrepeatable time series, algorithms are highly prone to backtest overfitting. Researchers iterating through thousands of hyperparameter combinations, network depths, random seeds, and feature sets inevitably discover configurations that perform exceptionally well in-sample by memorizing historical noise rather than learning persistent economic signals 45022.
This systemic issue is akin to "p-hacking" in traditional statistics and has been recently termed "X-hacking" in the context of Explainable AI (XAI) metrics such as SHAP values. Automated machine learning pipelines can exploit "model multiplicity" - the existence of numerous distinct models with nearly identical predictive accuracy but different internal logic - to selectively report outcomes that validate pre-specified economic theories 232425. If a research loop evaluates candidate forecasters against historical data iteratively, the best in-sample R-squared is biased upward by an amount that grows with every iteration, functioning as a sophisticated form of statistical data dredging 23. Consequently, a large portion of the published literature asserting absolute machine learning dominance over simple rules is likely inflated by severe selection bias 26.
Macroeconomic Regime Shifts
Machine learning models, particularly deep neural networks, rely on the implicit assumption that future market dynamics will statistically resemble the training data distribution. This assumption breaks down violently during profound macroeconomic regime shifts.
The transition into the post-2022 macroeconomic environment - characterized by generational highs in inflation, aggressive central bank interest rate hikes, and severe geopolitical shocks - exposed the fragility of highly parameterized models trained exclusively during the low-inflation, quantitative-easing era of 2009 - 2021 275758. Studies forecasting equity returns and corporate financial distress through 2024 and 2025 demonstrate that model accuracy degrades significantly during these transitions 2758.
In a stable macroeconomic environment, fundamental firm-level variables (such as total debt or cash flow) primarily dictate algorithmic predictions. However, during systemic shocks, macroeconomic variables (inflation rates, Federal Funds Rate, consumer sentiment) abruptly override micro-fundamentals 2757. Complex machine learning models, lacking the structural economic theory inherent to simple benchmark rules, struggle to rapidly re-weight these exogenous features without extensive new training data 5758.
Consequently, during the high-inflation period of 2022 - 2024, highly flexible deep learning models proved unstable and suffered pronounced drawdowns, whereas rigid, classical statistical baselines and linear models demonstrated superior resilience 831. Interestingly, when predicting specific macroeconomic variables like the post-2022 inflation surge in advanced economies, linear machine learning models featuring robust variable selection (such as LASSO and Elastic Net) systematically outperformed complex non-linear models, accurately forecasting the trajectory of inflation metrics up to six months ahead 282961.
Novel Paradigms and Unstructured Data
Despite the structural challenges posed by transaction costs and regime shifts, machine learning research continues to evolve, pushing past standard numerical evaluation to process entirely new forms of financial information.
Large Language Models and Sentiment Extraction
Where advanced machine learning models unequivocally outperform simple rules is in the processing of unstructured data. Traditional quantitative strategies rely exclusively on structured numerical data (price, volume, accounting fundamentals). The incorporation of Large Language Models (LLMs) allows for the extraction of highly nuanced sentiment signals from corporate earnings calls, financial news, and analyst reports 626330.
Historically, sentiment analysis relied on static financial dictionaries (such as the Loughran and McDonald dictionary) to mechanically count positive or negative terms. This "bag-of-words" heuristic ignores linguistic context; for instance, the word "decline" is negative in the context of revenue, but highly positive in the context of debt. Pre-trained and fine-tuned LLMs (such as FinBERT, Llama3, and RoBERTa) natively understand this contextual nuance, capturing complex linguistic features that simple dictionaries entirely miss 623065.
Research indicates that predictive portfolios incorporating LLM-derived semantic intelligence achieve massive performance gains over those relying strictly on structured machine learning or human-curated dictionaries. In direct backtests, ML-based sentiment strategies achieved annualized alphas of 8.52% compared to just 3.44% for human-based dictionaries 65. The semantic understanding generated by LLMs serves as a contextual filter for quantitative signals, mitigating the risk of models misinterpreting fundamental data during periods of acute narrative-driven market volatility 62306631.
Cost-Aware Optimization Architectures
The empirical evidence dictates that pure statistical machine learning operating on tabular data is unlikely to reliably outperform simple rules in the real world due to the transaction cost trap. The solution lies not in abandoning algorithmic complexity, but in abandoning purely statistical objective functions.
Standard machine learning models optimize for statistical metrics like Mean Squared Error (MSE) or pure directional accuracy. In financial applications, minimizing MSE does not maximize wealth 7. Modern implementable frameworks are moving toward "cost-aware" machine learning architectures. These models fuse predictive learning directly with portfolio optimization, integrating transaction costs, tracking error, and risk-aversion parameters into the neural network's loss function itself 7213233.
By penalizing the algorithm mathematically during the training phase for selecting costly-to-trade micro-caps or requiring high-turnover rebalancing, the model learns to prioritize features that offer persistent, highly liquid predictability (such as large-cap value metrics) over transient, illiquid anomalies 2170. Furthermore, by incorporating market impact models (such as Kyle's Lambda) into the optimization, the algorithms scale position sizes dynamically based on predicted trading volume, avoiding the magnitude asymmetry trap 3334.
When evaluated on an implementable efficient frontier - which measures strictly net-of-cost returns for each level of risk - these economically optimized machine learning models succeed. They deliver out-of-sample net-of-cost returns that outperform both naive, unconstrained machine learning models and sophisticated heuristic benchmarks 72170. This cost-aware approach demonstrates that machine learning can genuinely extract alpha beyond simple rules, provided the algorithmic complexity is structurally bound by economic reality rather than theoretical statistics.
Conclusion
The question of whether machine learning models outperform simple rules in equity return prediction cannot be answered with a binary assertion. The extensive empirical evidence delineates a sharp divide between statistical theory and economic implementation.
In theoretical, gross-of-fee environments, machine learning establishes an absolute superiority. Highly parameterized models - including Random Forests, Gradient Boosted Trees, and Deep Neural Networks - effectively exploit the virtue of complexity. They systematically capture non-linear feature interactions and conditional thresholds that simple, low-dimensional rules (such as OLS regressions or moving average crossovers) are structurally blind to. The resulting improvements in out-of-sample predictability and gross Sharpe ratios are massive and observable across global markets. Furthermore, in the realm of unstructured data, Large Language Models offer an unparalleled capacity to extract actionable sentiment from textual sources, rendering traditional dictionary-based heuristic rules obsolete.
However, in applied execution, simple rules remain remarkably robust and often superior. The unconstrained flexibility of machine learning models drives them to over-trade illiquid assets, triggering a transaction cost trap where high directional accuracy is entirely consumed by magnitude asymmetry and execution drag. Furthermore, deep learning architectures exhibit severe fragility during unprecedented macroeconomic regime shifts - such as the post-2022 inflationary environment - whereas the structural rigidity of simple moving averages provides inherent protection against catastrophic drawdowns.
Ultimately, machine learning models do not unconditionally outperform simple rules. They only achieve practical superiority when their computational complexity is explicitly constrained by economic objective functions. Models that directly penalize turnover and transaction costs within their loss functions successfully bridge the gap, isolating persistent, liquid signals that generate true, net-of-cost outperformance.