Graph Neural Networks for Modeling Stock Interrelationships
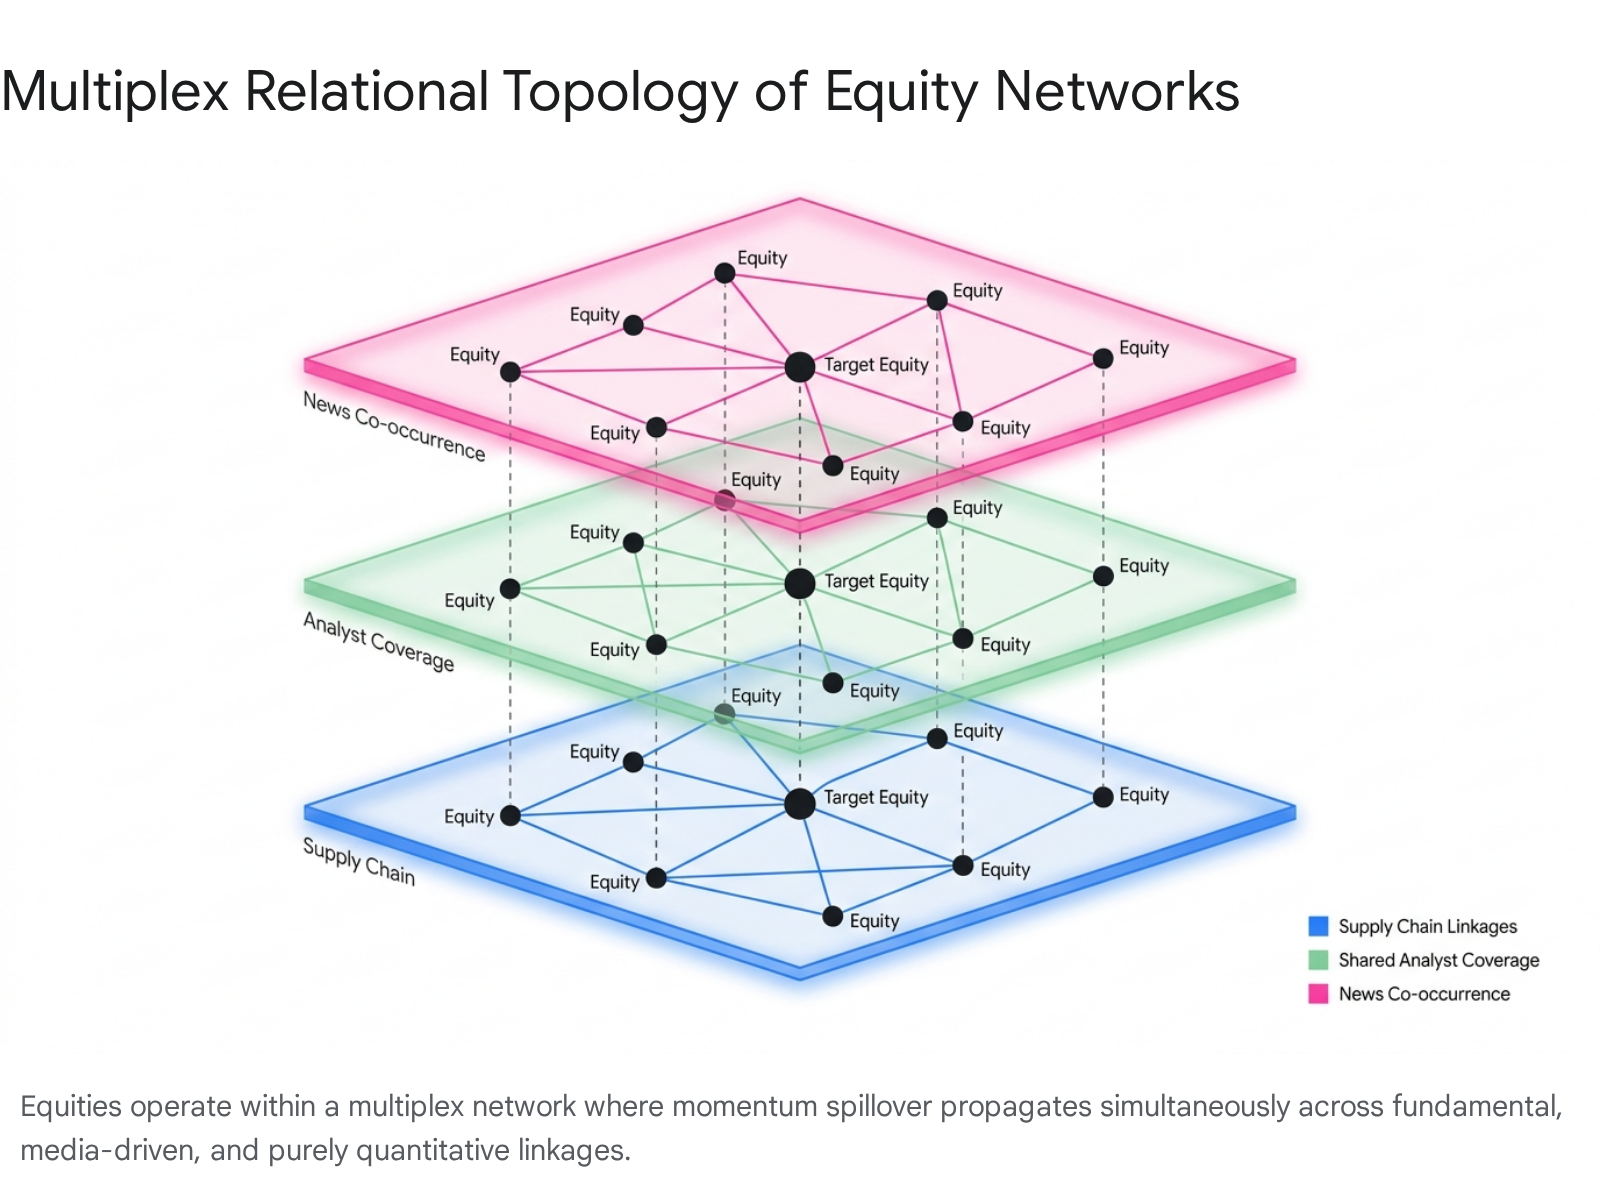
The predictive modeling of equity markets has historically relied upon analyzing isolated asset time-series, largely adhering to traditional econometric frameworks such as Autoregressive Integrated Moving Average (ARIMA) or Vector Autoregression (VAR). However, these frameworks fundamentally struggle to account for the complex, non-Euclidean topologies of modern financial ecosystems. Financial markets are not merely collections of independent price sequences; they are highly interconnected networks bound by supply chains, shared analyst coverage, geopolitical news co-occurrences, and correlated retail sentiment. As one asset experiences an economic shock, this perturbation traverses the network, manifesting as a phenomenon known as momentum spillover.
In recent years, the deployment of Graph Neural Networks (GNNs) has revolutionized the modeling of these interrelationships. By representing individual equities as nodes and their diverse economic linkages as edges, GNNs can dynamically capture both spatial (cross-asset) and temporal (historical) dependencies. This report comprehensively examines the theoretical foundations of momentum spillover, the methodologies for constructing financial graphs, architectural innovations in GNNs tailored for finance, empirical performance benchmarks, and the pressing challenges of computational overhead and edge overfitting.
Theoretical Foundations of Financial Interconnectedness
To successfully leverage graph-based deep learning, analysts must first understand the fundamental market dynamics that necessitate a relational modeling approach. Stock prices incorporate information not only from their own historical trajectories but also from the delayed reactions of related equities. Traditional models assume that markets assimilate information instantaneously, yet empirical evidence confirms that structural frictions cause delayed price discovery.
The Momentum Spillover Effect
Momentum spillover refers to the diffusion of momentum risk premium from one asset to another across economic linkages 1. Classical asset pricing theories often assume instantaneous information absorption, leading to efficient pricing. However, empirical evidence demonstrates substantial market friction. When an initial shock impacts a leading firm, the information diffuses gradually through the market network, creating a predictable lead-lag effect in the returns of connected firms 21.
This dynamic is particularly pronounced in the context of attribute-sensitive spillovers. An abnormal price drop in a source firm may only trigger a corresponding decline in a linked firm if specific structural conditions are met. For instance, if the trading volume accompanying the price drop is sufficiently high, or if the linked firm's valuation is stretched, the spillover effect is magnified 2. The bridging importance of these relations varies over time, transforming a static market anomaly into a highly dynamic variable that graph-based models are uniquely equipped to capture. Asset volatility is demonstrably affected by these lead-lag effects, confirming that analyzing the characteristics of a single stock in isolation is insufficient for accurate forecasting 36.
Microstructural Drivers in Emerging Markets
The mechanics of momentum spillover are heavily influenced by the composition of the investor base and the microstructure of the specific exchange. In developed markets, medium-term (three to twelve months) price momentum is a widely documented phenomenon 45. Conversely, emerging markets, such as the Chinese equity market, display distinct structural anomalies. Despite high retail investor dominance, medium-term momentum is conspicuously absent, often replaced by a pattern of reversals where past returns over one-to-six-month horizons consistently predict future underperformance 4.
However, high-frequency analysis reveals intense daily price momentum driven almost exclusively by the attention and trading behaviors of inexperienced retail investors. These investors exhibit a pronounced tendency to chase prior-day returns, generating short-term momentum that quickly reverses in subsequent weeks, underscoring their destabilizing influence 59. Large institutional investors and mutual funds generally act as a counterbalancing force to this retail-driven momentum, but their impact is often overwhelmed in the short term by retail volume 5.
Exchange Guardrails and Artificial Momentum
This high-frequency momentum phenomenon is further exacerbated by exchange-specific guardrails. The Chinese stock market, for example, enforces a strict 10% daily price limit on individual stocks 4. When a stock approaches this upper or lower threshold, a "magnet effect" can accelerate trading activities, as investors rush to execute orders before trading is halted 6.
This artificially distorts natural lead-lag propagation, creating a mechanical continuation of stock prices that graph models must filter out. In some instances, a "repellent effect" is observed, where investors recoil from trading when a limit-hit appears imminent 6. For GNNs, these microstructural nuances necessitate models capable of processing high-frequency spatial-temporal signals to differentiate between fundamental momentum spillover and retail-driven noise.
Macro-Structural Linkages in Equity Networks
Beyond short-term trading sentiment, structural macro-linkages dictate the pathways of shock propagation. These fundamental conduits provide the underlying architecture for financial graph construction, determining exactly how nodes (companies) are connected by edges (relationships).
Supply Chain Dependencies
Supply chain constraints and vendor-customer relationships form a primary vector for momentum spillover. A well-documented "customer momentum strategy" postulates that positive earnings shocks in a downstream consumer-facing firm will eventually propagate upstream to its suppliers 7. Investors in a supplier firm may be less aware of the financial state of the customer firm, creating an informational delay and an actionable lead-lag effect.
Exogenous macroeconomic shocks vividly illustrate this network dependency. Events such as the 2011 Japanese earthquake, the Thai floods, and the COVID-19 pandemic caused severe supply chain disruptions that rippled through global equity markets 89. Advanced supply chain risk modeling utilizes bigram analysis of corporate earnings calls to quantify this risk, demonstrating that supply chain sentiment acts as a leading indicator for stock price volatility and returns 8.
Corporate Hierarchies and Conglomerate Structures
In specific regional markets, deeply nested corporate structures fundamentally alter momentum spillover dynamics. In Asian markets, architectures such as the Japanese Keiretsu or the South Korean Chaebol facilitate rapid, internal shock transmission 1011.
These networked hierarchies are interlinked by institutional bridges that coordinate investments and alter standard competitive market dynamics 912. A shock to a central holding company or primary bank within a Keiretsu rapidly diffuses to all affiliated manufacturing and service entities. These structures create dense, highly correlated sub-graphs within the broader market network. Graph Neural Networks must account for these localized clusters of high connectivity to accurately model the propagation of risk and return 913.
Analyst Coverage and Media Co-Occurrence
Shared analyst coverage acts as another vital conduit for investor attention. Firms covered by the same financial analysts experience overlapping information diffusion, leading to predictable co-movements 214. Analysts acting as informational bridges can quantify the strength of company relationships more accurately than simple binary variables or broad industry sector groupings 2.
Similarly, news co-occurrence captures real-time economic linkages and systemic risks. Researchers construct financial networks based on how frequently firms appear in the same financial news articles 1920. News co-occurrence can be decomposed into an expected component (baseline industry coverage) and an unexpected shock component. The shock component arouses abnormal retail investor attention, and stock prices of firms that unexpectedly co-occur in news media tend to move strongly together in subsequent trading sessions 1516.
Methodologies for Adjacency Matrix Construction
The efficacy of a Graph Neural Network is strictly bound by the quality and design of its adjacency matrix. If the graph topology relies on spurious or overly rigid definitions of firm relations, the network will propagate mathematical noise, resulting in poor predictive performance. Researchers have developed multiple distinct methodologies to infer and construct these graph structures.
Price-Based Correlation Graphs
The most accessible method for graph construction involves generating an adjacency matrix based on the historical correlation of asset returns. Two nodes (stocks) are connected by a weighted edge representing their Pearson correlation coefficient or mutual information over a rolling temporal window 2324. Dynamic Time Warping (DTW) algorithms are also frequently employed to compute lead-lag relationships directly from raw price sequences, bypassing the limitations of simple linear correlation 2526.
However, pure correlation graphs present critical mathematical vulnerabilities. A correlation matrix is inherently dense, as nearly every stock has a non-zero correlation with the broader market index. Feeding a dense graph into a neural network leads to excessive computational overhead and the rapid homogenization of node embeddings - a failure state known as over-smoothing 2728. To resolve this, quantitative researchers apply thresholding mechanisms or utilize graph learning models to generate sparse adjacency matrices that retain only the most statistically significant connections, forming a purified "network momentum matrix" 25.
Exogenous Knowledge Graphs
To bypass the noise inherent in price-based correlations, alternative frameworks utilize exogenous datasets to build explicit knowledge graphs.
Supply chain and sector graphs are extracted from corporate filings or databases to connect nodes based on supplier-customer dynamics or Global Industry Classification Standard (GICS) codes. While highly accurate for mapping fundamental economic relationships, these graphs are mostly static. Supply contracts are updated quarterly or annually, causing these models to fail in capturing sudden, event-driven market shifts 729.
Conversely, news co-occurrence graphs are dynamically constructed utilizing Natural Language Processing (NLP) and Large Language Models (LLMs) to map how frequently firms appear in the same financial news articles 1920. This methodology captures real-time economic linkages and systemic risks that may not yet be reflected in fundamental supply chain data. However, assigning accurate directional sentiment polarity to these edges remains an ongoing challenge in NLP-driven finance 1517.
Table 1: Comparison of Graph Construction Methodologies in Stock Prediction
| Methodology | Data Source | Primary Advantage | Key Limitations |
|---|---|---|---|
| Correlation Graph | Historical price/volume sequences 2318 | Direct representation of quantitative market co-movement. | Over-dense adjacency matrices; highly susceptible to systemic market noise and spurious correlations. |
| Supply Chain / Sector Graph | Corporate filings, fundamental datasets 729 | Maps verifiable economic dependencies; highly interpretable. | Largely static; updates slowly (quarterly/annually); misses indirect sentiment-driven linkages. |
| News Co-occurrence Graph | Financial news wires, NLP extraction 191517 | Captures real-time, event-driven relationships and hidden systemic ties. | Relies on external NLP models; sentiment polarity can be difficult to quantify accurately. |
| Multi-Relational Dynamic Graph | Combined multimodal sources (Price, Text, Fundamentals) 3 | Provides a holistic, multiplex view of the asset network. | High computational overhead; susceptible to feature sparsity and edge overfitting. |
Dynamic and Adaptive Graph Formulations
A severe limitation of early GNN research in quantitative finance was the reliance on static graphs, which fundamentally fail to capture the evolving nature of inter-corporate relationships over time 3. Firms continuously form new alliances, break supply contracts, and shift strategic focus, dictating that the adjacency matrix must be treated as a dynamic entity.
State-of-the-art frameworks, such as the Multi-modal Temporal Dynamic Graph method (MTDGraph), model these time-varying relationships explicitly 3. By injecting causality factors via transfer entropy between interrelated stock embeddings, MTDGraph recursively updates historical relationship strength at each time step. Similarly, adaptive models like DeltaLag utilize sparsified cross-attention mechanisms to allow the neural network itself to dynamically discover and weight the most relevant lead-lag relationships on a daily basis, discarding pre-computed statistical matrices entirely 26. This shifts the burden of graph construction from human-engineered statistics directly into the latent space of the neural network.
Architectural Innovations in Financial Graph Neural Networks
With the graph structure defined, the neural network architecture must be optimized to aggregate information across this topology effectively. Financial data is notoriously non-stationary, characterized by a low signal-to-noise ratio, and structurally complex, rendering standard Graph Convolutional Networks (GCNs) largely insufficient.
Attribute-Driven Relational Mechanisms
Traditional GCNs aggregate features from neighboring nodes uniformly or based solely on static edge weights, completely disregarding the current "state" of the nodes involved in the transaction 2. In dynamic stock markets, a relationship is rarely uniform; the momentum spillover from a large-cap stock to a small-cap supplier is vastly different than the reverse.
To address this structural flaw, researchers developed the Attribute-Driven Graph Attention Network (AD-GAT). This architecture element-wisely multiplies the nonlinear transformations of the connected firms' attributes, effectively creating an attribute-sensitive propagation mechanism 2. If a leading stock's price drops, but its trading volume is negligible or the macro environment is risk-on, AD-GAT will algorithmically attenuate the message passed to neighboring nodes. This mechanism prevents the network from over-reacting to low-conviction price movements and accurately simulates the conditional nature of momentum spillover 19.
Accelerating Shock Propagation via Global Nodes
When a macroeconomic shock hits the market, information propagates rapidly across all sectors. Deep, multi-hop GNNs attempt to model this widespread diffusion by stacking numerous convolutional layers. However, this approach often leads to over-smoothing, a mathematical degradation where all node embeddings become indistinguishable after excessive message passing 2728.
Recent architectures bypass this limitation by introducing global intermediary nodes. The OmniGNN model, for instance, introduces a "Global Sector Node" connected to all stocks within an industry 29. Rather than waiting for a shock to diffuse slowly across sequential stock-to-stock edges, the shock immediately updates the state of the Global Sector Node. This node then simultaneously broadcasts the updated context to all constituent equities in the next computational layer. Furthermore, models like OmniGNN apply Attention with Linear Biases (ALiBi) to introduce positional bias directly into attention scores, prioritizing recent temporal observations without the computational overhead of learning absolute positional embeddings 29.
Spectral Filtering and Wavelet Architectures
Alternative architectures analyze market anomalies through a spectral lens. Anomalous market shocks cause a "right-shift" in the graph's spectral energy distribution, meaning the energy concentrates in high frequencies as volatile, uncorrelated price movements spike 20.
Standard GNN filters, which operate primarily as low-pass filters to smooth node representations, fail to isolate this shift. Wavelet-based architectures, such as the Beta Wavelet Graph Neural Network (BWGNN), explicitly localize these high-frequency perturbations. By utilizing heat kernels to generate wavelet transforms, BWGNN can accurately pinpoint the structural anomalies that precede market crashes, drastically improving the detection of systemic risk and volatility forecasting 20.
Hybrid Architectures for Spatial-Temporal Dynamics
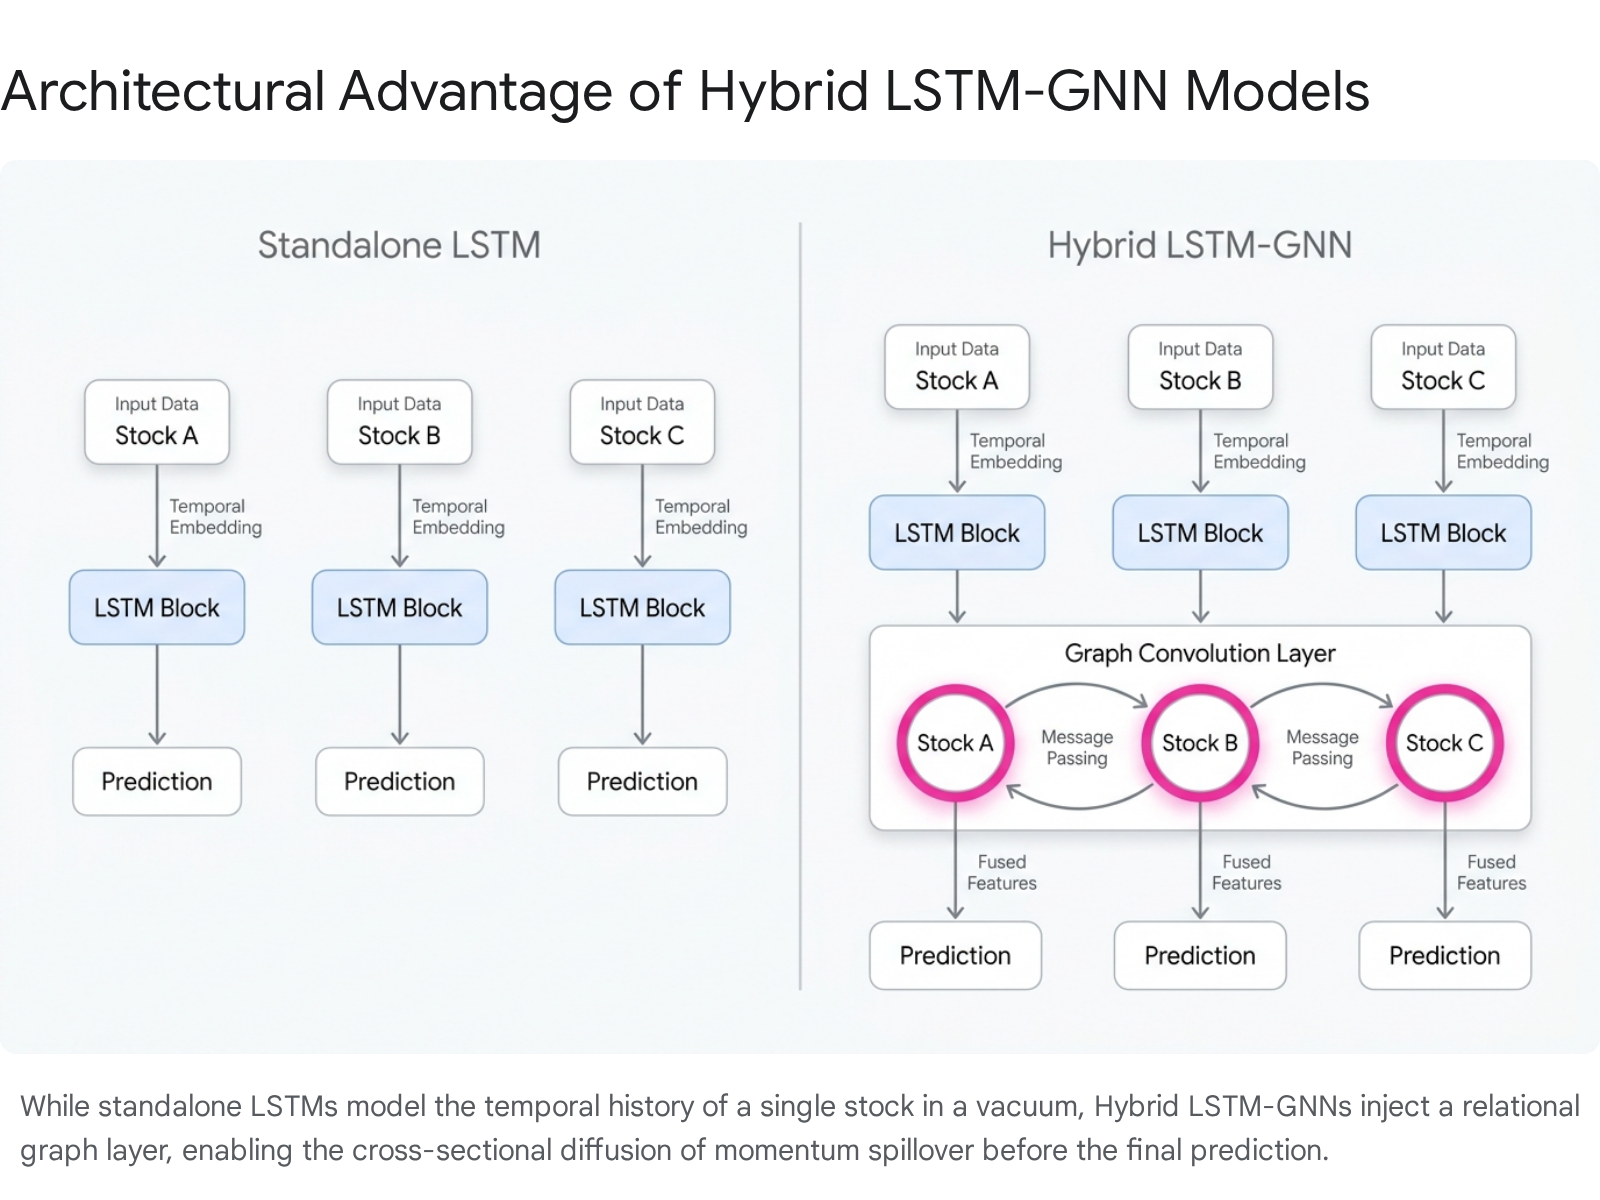
While GNNs excel at spatial aggregation - mapping the cross-sectional market relationships at a specific point in time - they possess limited native capacity to model temporal sequences. To capture longitudinal momentum, GNNs must be paired with temporal sequence models, resulting in the current industry standard: the hybrid LSTM-GNN architecture 2321.
Sequential Processing and Graph Integration
In hybrid pipelines, Long Short-Term Memory (LSTM) networks, Gated Recurrent Units (GRU), or Temporal Convolutional Networks (TCN) first process the raw time-series of individual stocks. This initial step isolates local, sequential patterns, effectively capturing a stock's independent momentum 3536.
These independent temporal embeddings are subsequently passed to the GNN layers. The GNN updates the individual embeddings by passing messages across the defined financial graph, injecting the momentum spillover from related equities into the feature space. The final, context-aware embeddings are then fed into fully connected multi-layer perceptrons (MLP) to output next-day return predictions, volatility forecasts, or ranked portfolio lists 3722.
Application in Derivatives and Options Pricing
The utility of spatial-temporal modeling extends beyond standard equities into derivative markets. Traditional options pricing heavily relies on the volatility of the underlying asset and deterministic contract properties. However, asset volatility is also governed by momentum spillover effects among correlated options.
Recent research introduces deep graph neural network models (e.g., GNN-MS) specifically tailored for options pricing. In these models, the options market is mapped as a graph where individual options are nodes, and edges connect nodes that share the same maturity date 623. By combining cross-sectional maturity information with temporal price fluctuations, these models capture lead-lag effects between correlated options, demonstrating significant reductions in root-mean-square error compared to classical pricing frameworks 23.
Quantitative Performance and Benchmarking
Empirical validation across numerous academic studies confirms that integrating relational dependencies via GNNs provides a measurable, statistically significant edge over both traditional econometric models and standalone deep learning networks.
Econometric Limitations: VAR and ARIMA
Vector Autoregression (VAR) and Autoregressive Integrated Moving Average (ARIMA) models have historically been utilized to capture linear interdependencies and trends among multiple time series 244142. While these models successfully explain variance in highly stable, linear macroeconomic environments, they falter in the non-stationary environment of equity markets.
The core limitation of VAR is its reliance on static parameters; the calculated coefficient defining the relationship between Stock A and Stock B remains fixed over the training period, rendering the model blind to sudden regime shifts or evolving supply chain dynamics 25. In rigorous backtesting utilizing expanding-window cross-validation, machine learning pipelines that incorporate structural graph features easily outperform regularized linear models, as they successfully capture the complex nonlinear polyadic dependencies that classical econometrics ignores 2344.
Superiority Over Standalone Deep Learning Baselines
The precise value-add of the graph convolution component is most clearly demonstrated when benchmarking hybrid models against standalone sequential networks. By failing to account for the spatial relationships among stocks, a standalone LSTM effectively treats the broader market context and sector-wide shocks as unobservable noise 4245.
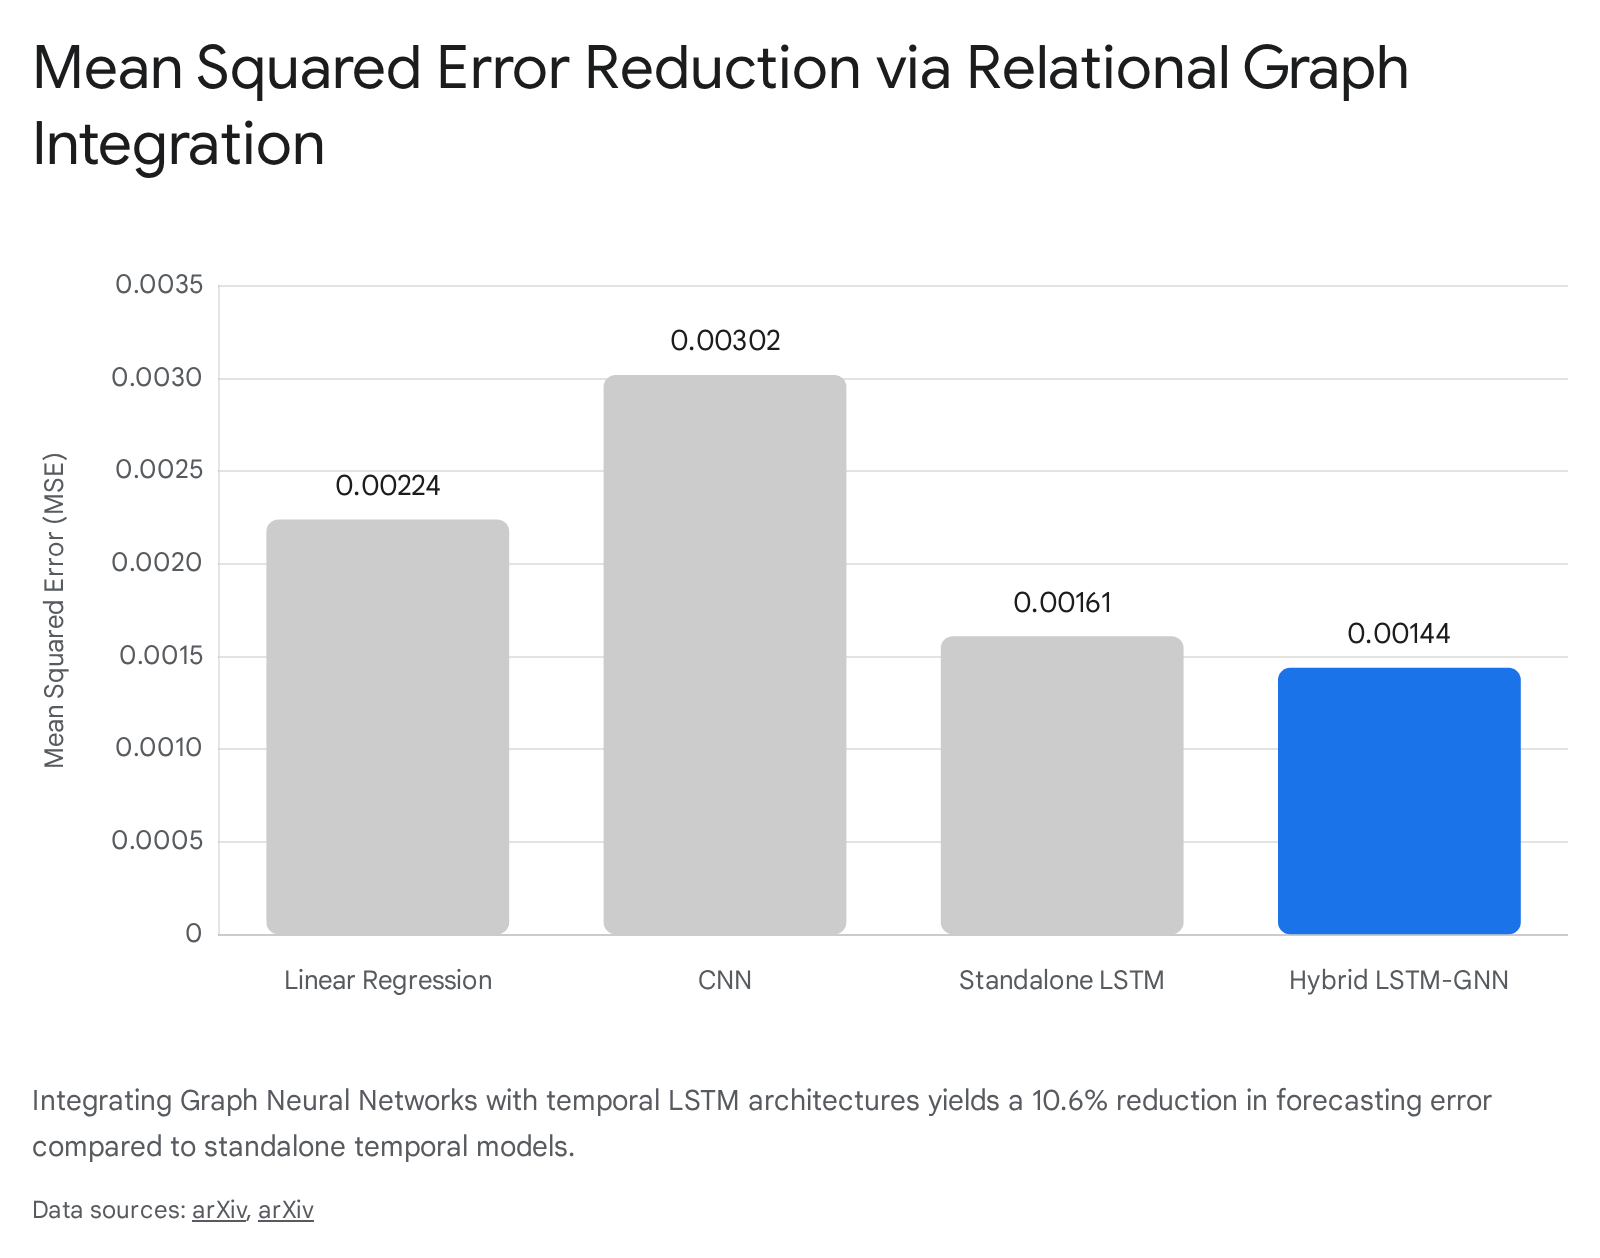
Recent extensive evaluations on historical stock datasets highlight a stark performance gap. A novel hybrid LSTM-GNN model achieved a Mean Squared Error (MSE) of 0.00144, representing a substantial 10.6% reduction in error compared to the standalone LSTM model's MSE of 0.00161 232426.
Furthermore, the incorporation of GNNs allows models to output superior ranking metrics (such as Mean Reciprocal Rank) and absolute investment revenues in simulated portfolio trading tasks, proving that the theoretical alpha generated by modeling momentum spillover translates to economically significant returns 3. Network Momentum strategies leveraging graph learning have exhibited robust out-of-sample Sharpe ratios approaching 1.5 and annual returns exceeding 20% in long-term backtests 1.
Table 2: Comparative Performance Metrics of Forecasting Architectures (Note: Values represent aggregated performance benchmarks based on continuous expanding-window validation on US and Asian equity datasets. Absolute figures vary by dataset.)
| Model Architecture | Ability to Model Time | Ability to Model Relations | Mean Squared Error (MSE) | Root Mean Squared Error (RMSE) |
|---|---|---|---|---|
| ARIMA | High (Linear) | None | ~ 0.0440 - 0.1739 42 | ~ 0.210 - 0.417 42 |
| Standalone CNN | Low (Spatial only) | None | ~ 0.00302 23 | N/A |
| Standalone LSTM | High (Nonlinear) | None | ~ 0.00161 2324 | ~ 0.58 - 0.72 45 |
| Standalone GNN | None | High (Nonlinear) | N/A | ~ 0.11 - 0.92 45 |
| Hybrid LSTM-GNN | High (Nonlinear) | High (Nonlinear) | 0.00144 2324 | 0.03 45 |
Computational Trade-Offs and Edge Overfitting
Despite their superior predictive capacity, Graph Neural Networks introduce severe computational overhead and unique regularization challenges. The transition from isolated modeling to graph-based relational modeling exponentially increases the parameter space and the risk of over-parameterization.
Feature Sparsity and Network Degradation
In financial forecasting settings, datasets are inherently constrained by the arrow of time; there is only a single daily closing price or earnings report per stock. This results in a scarcity of independent training samples relative to the vast, combinatorial number of potential inter-firm relationships 4748.
This scarcity frequently leads to "edge overfitting," an architectural failure state where the GNN memorizes the specific, noisy topology of the training graph rather than learning the generalizable mechanics of momentum spillover 28. This problem is critically exacerbated when the initial node features are sparse - such as bag-of-words text representations extracted from financial news. Sparse initial vectors fail to map the full continuous range of learnable parameters, causing certain dimensions of the GNN's projection matrices to remain unoptimized. Consequently, the network fails to recognize variations of these features in live trading environments, heavily degrading performance on out-of-sample validation data 47.
Furthermore, as GNNs aggregate features from neighboring nodes over multiple layers, they suffer from the over-smoothing problem. With each successive layer, a node's representation becomes an increasingly blended mixture of its neighbors. After extensive message passing, the distinct financial profiles of individual stocks are diluted into a generic market average, effectively destroying the idiosyncratic signals required for alpha generation 2728.
Regularization Strategies and Synthetic Data Augmentation
To counteract edge overfitting, feature sparsity, and the over-smoothing phenomenon, machine learning engineers have adopted several rigorous, finance-specific regularization techniques:
- DropEdge and Stochastic Routing: Just as standard deep learning utilizes Dropout to randomly zero out specific node features to force robust representation learning, the GNN-specific DropEdge technique randomly removes a fraction of the edges from the graph's adjacency matrix during each training epoch 28. By continually fracturing the network topology, DropEdge prevents the model from relying too heavily on any single economic linkage (e.g., a dominant supply chain route) and mitigates the onset of over-smoothing.
- Feature and Hyperplane Perturbation: Advanced models mitigate initial sparsity by introducing controlled mathematical variability to both the input features and the first projection hyperplane simultaneously. By applying random shifts to the input magnitude during the training phase, the network is forced to learn shift-invariant properties, significantly improving generalization and node classification accuracy in data-scarce financial scenarios 4748.
- Adversarial Synthetic Scenario Generation: To bypass the fundamental limitation of scarce historical data entirely, quantitative researchers have begun employing Generative Adversarial Networks (GANs), specifically Wasserstein GANs with Gradient Penalty (WGAN-GP), to generate synthetic, highly realistic market time-series. By training the hybrid GNN model on an artificially expanded dataset containing both real and GAN-generated synthetic scenarios (a methodology termed "Train on Synthetic and Test on Real"), the network is forced to compromise its weights to accommodate a vastly larger state-space 27. This effectively neutralizes edge overfitting and eliminates the sudden performance degradation typically observed when deploying models on unseen out-of-sample data.
Conclusion
The integration of Graph Neural Networks into financial modeling represents a fundamental paradigm shift. It mandates a transition from viewing equities as isolated price sequences to treating the broader market as a living, densely interconnected ecosystem. Empirical data and deep learning diagnostics clearly establish that momentum spillover is not a uniform diffusion of price; it is a highly conditional, attribute-sensitive phenomenon propagated through a multiplex web of supply chain dependencies, shared media exposure, and overlapping institutional analyst coverage.
By dynamically updating adjacency matrices to reflect shifting economic realities, and by leveraging sophisticated spatial-temporal architectures like the Hybrid LSTM-GNN or OmniGNN, quantitative researchers can capture the nuanced lead-lag effects that traditional econometric models inherently miss. While the transition to graph-based learning introduces significant computational hurdles - namely feature sparsity, over-smoothing, and edge overfitting - modern regularization techniques such as DropEdge and GAN-driven synthetic data augmentation ensure these models remain robust in out-of-sample environments. Ultimately, as global financial markets grow increasingly intertwined and reactionary to exogenous shocks, the ability to rapidly model shock propagation via Graph Neural Networks will transition from an experimental alpha-generation strategy to a foundational necessity in advanced quantitative asset management.