How Startups Go From Idea to Series A
The journey from a raw concept to a Series A funding round now demands multi-year endurance, rigorous market validation, and exceptional capital efficiency. Founders today typically wait over two years between their seed and Series A rounds, with only about 15 percent successfully securing this crucial growth capital. To cross this chasm, startups must bootstrap early traction, achieve undeniable product-market fit, and hit stringent revenue metrics of at least one million dollars in annual recurring revenue before institutional investors will write a check.
The Evolving Startup Landscape in 2025
The venture capital landscape has undergone a tectonic shift since the zero-interest-rate policy (ZIRP) era of 2020 and 2021. The period defined by rapid funding, massive valuation step-ups, and a "growth-at-all-costs" mentality has been replaced by a rigorous filtration market 12. Investors have not abandoned the asset class; global startup funding reached $91 billion in the second quarter of 2025 alone, up 11% year-over-year 3. However, the bar for securing that capital has been elevated dramatically.
Today's venture market demands milestones over vision, and proven traction over theoretical total addressable market (TAM) slides 1. The broader global economic recalibration has forced the ecosystem to prioritize strong unit economics, operational efficiency, and a clear path to profitability 45. As a result, the failure rate for startups remains daunting, with approximately 90% of all new ventures eventually shutting down 67.
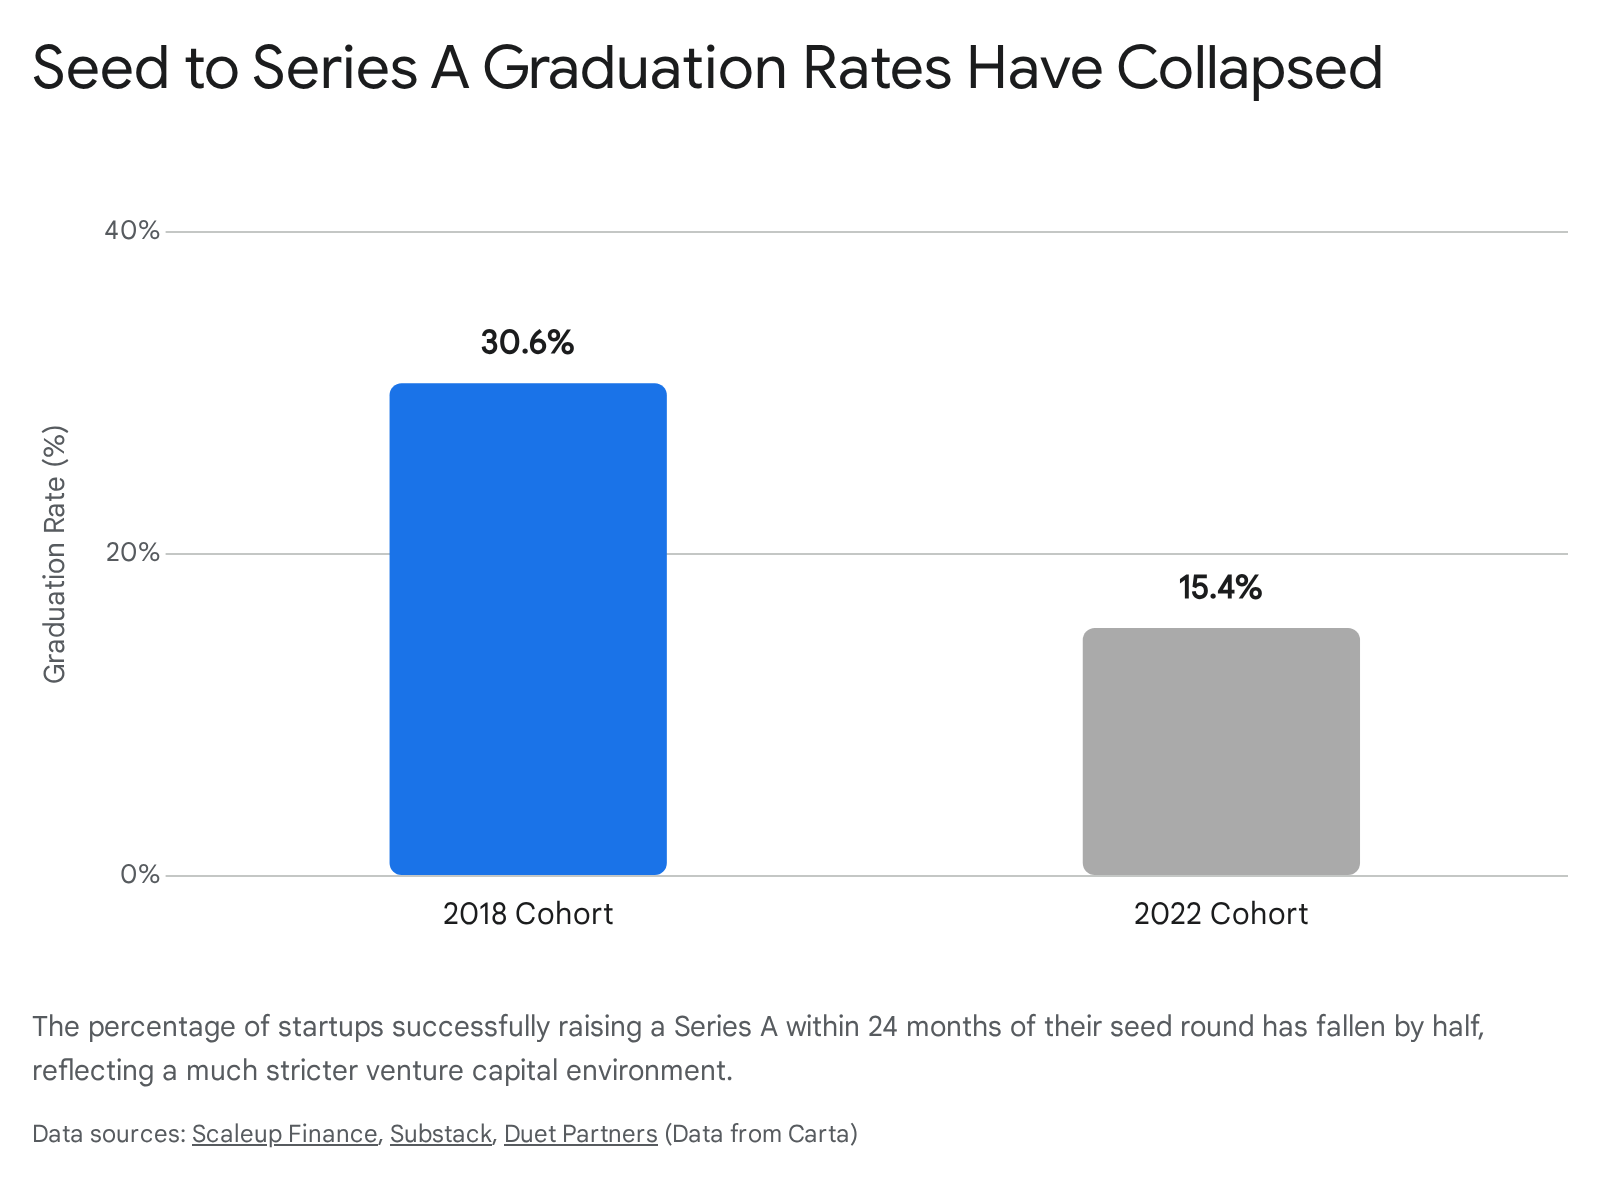
One of the most striking changes is the collapsing graduation rate between funding stages. During the height of the market in 2020, nearly 40% of startups that raised a seed round made it to Series A within two years 8. Through 2018 and 2019, that figure hovered around a healthy 31% 8.
By the time the 2022 cohort was evaluated two years later, graduation rates had collapsed to just 15.4% 89.
This phenomenon is widely referred to as the return of the "Series A Crunch," creating an environment where thousands of seed-funded companies are competing for a stagnant pool of Series A dollars 10. To navigate this perilous environment, founders must adopt a highly structured, evidence-based approach to building their companies from the very beginning.
Stage 1: Ideation and Market Validation
The most common reason startups fail is not a lack of technical capability or insufficient capital; rather, 34% of startups fail because they build a product that the market does not strongly need or is unwilling to pay for 711. This failure to achieve product-market fit (PMF) often stems from founders creating a "solution in search of a problem" rather than addressing a painful, existing market inefficiency 12.
Finding the Right Problem
The most reliable source of a profitable startup idea is a personal problem experienced directly by the founder 13. When a founder experiences a workflow bottleneck, an industry inefficiency, or a consumer pain point firsthand, they possess an asymmetric understanding of the problem that external observers lack.
This concept is deeply tied to "founder-market fit," a critical metric evaluated by early-stage investors 1214. Investors look for teams that possess the specific domain expertise, technical skills, and industry network required to solve the exact problem they are targeting 15. Startups founded by individuals with prior business experience have 30% higher success rates, and the presence of a strong technical co-founder significantly correlates with long-term survival 615.
Founders are advised to avoid picking abstract, macroscopic problems purely because they sound impactful. Instead, they should focus on highly specific, deeply painful issues that force target customers to actively seek workarounds 1214. A highly engaged niche audience of early adopters is vastly superior to a broad but apathetic market, especially when overcoming the initial "cold start" problem 14.
The Validation Framework
Validation is the process of acquiring empirical evidence that people will pay for a solution before writing a single line of code 1115. Founders who skip this step and rush directly into product development frequently exhaust their initial capital building features that customers ignore 17.
A robust validation process typically follows a structured sequence:
- Customer Interviews: Founders must speak directly with 10 to 30 potential users who fit the Ideal Customer Profile (ICP) 15. Crucially, the objective of these interviews is to listen, not to pitch 15. The goal is to uncover how the prospect currently attempts to solve the problem, how much time or money the problem costs them, and whether they view the issue as a top priority.
- Competitor and Alternative Analysis: Founders must map out direct competitors, indirect competitors, and manual workarounds (such as complex spreadsheets) 15. If prospects are not currently spending time or money trying to solve the problem, the pain point is likely not severe enough to support a venture-scale business.
- "Fake Door" Testing: To measure actual purchase intent, founders can create simple, one-page landing pages that outline the value proposition and include a call-to-action, such as "Pre-order" or "Join Waitlist" 15. Directing targeted traffic to this page via cold outreach, LinkedIn, or small test ad campaigns on Google or Facebook provides quantifiable data on conversion rates 1115.
- Willingness to Pay: Stated interest is cheap; monetary commitment is the only true validation. Securing letters of intent (LOIs), pre-sales, or paid pilot agreements before the product exists acts as the ultimate proof of demand 1516.
Stage 2: The Bootstrapping Phase
In the current macroeconomic climate, bootstrapping - funding the business using personal savings and early customer revenues - has become increasingly common and highly recommended before seeking venture capital 1720. Venture capitalists are demanding more evidence of traction before investing, which pushes founders to remain self-funded for longer periods 17.
Bootstrapping enforces intense financial discipline. Without a cushion of venture capital, founders are forced to focus on unit economics, lean operations, and immediate revenue generation 1718. By prioritizing paying customers from day one, bootstrapped founders ensure tight feedback loops and avoid building theoretical features 17.
Historically, approximately 58% of small companies in the United States launch with less than $25,000 in initial capital 6. Software and service-based startups can often launch with as little as $5,000, utilizing open-source software, cloud infrastructure, and low-code tools to minimize fixed costs 620.
Bootstrapping Growth Tactics
To scale without external capital, founders rely on high-leverage, low-cost growth hacks 22. Tactics that work at the sub-$1 million revenue stage are distinctly different from those used by established enterprises:
- Viral Loops and "Powered By" Mechanics: Embedding branding directly into the product (e.g., a "Powered by" badge on a shared form) turns every user into a passive distributor 22.
- Founder Brand Building: Founders who build public personas on platforms like LinkedIn or X generate inbound interest and trust far faster than paid advertising 22.
- Webinars and Free Tools: Hosting niche, high-value webinars or releasing free data reports acts as an aggressive lead generation engine without the overhead of an enterprise sales team 22.
- Cold Outreach: Highly personalized, laser-targeted cold emails or Loom videos sent directly by the founder frequently result in the first $10,000 in monthly recurring revenue 22.
Delaying outside investment not only proves the business model but also prevents excessive early equity dilution, ensuring the founders retain maximum control over the company's strategic direction 17.
Stage 3: The Pre-Seed Round
Once a startup has validated the problem, assembled a founding team (typically 2 to 5 people), and built an early prototype or minimum viable product (MVP), they may seek external capital to accelerate development 2324. This is the pre-seed stage.
Pre-Seed Capital and Mechanics
The pre-seed round represents the first institutional or semi-institutional capital injected into the business. At this stage, startups generally lack meaningful revenue, and investors are underwriting the capability of the team, the size of the market opportunity, and the early signals of customer demand 1624.
In 2025 and 2026, the median pre-seed round size ranges between $750,000 and $1.5 million 16. For this injection of capital, founders typically give up 15% to 20% of the company's equity 1624.
Because pricing a company with no revenue is highly speculative, pre-seed rounds are almost exclusively executed using convertible instruments rather than priced equity 19. The Simple Agreement for Future Equity (SAFE), pioneered by Y Combinator, has become the industry standard. Data from 2025 shows that SAFEs accounted for a record 90% of all pre-seed rounds on the Carta platform, with convertible notes making up the remaining 10% 1920.
A post-money SAFE with a valuation cap dictates the maximum valuation at which the investor's money will convert into equity during the next priced round 1920. In 2025, median valuation caps for pre-seed SAFEs hovered around $10 million for smaller rounds (under $1 million) and stretched to $15 million for rounds up to $2.5 million 20. Exceptional repeat founders in prime markets like San Francisco occasionally secure $2 million to $3 million pre-seed rounds at $8 million to $10 million post-money caps before writing a single line of code, though this remains an exception to the rule 16.
Investors at this stage include friends and family, angel investors, specialized micro-VC funds (with fund sizes of $25 million to $75 million), and startup accelerators 1624. Interestingly, research indicates that startups combining angel funding with venture capital ultimately achieve higher success probabilities and attract more significant follow-on investments 21.
The Accelerator Path
For many early-stage founders, gaining acceptance into a top-tier accelerator serves as a critical springboard. Accelerators provide immediate capital, intensive mentorship, and access to a vast network of subsequent investors in exchange for a standardized equity stake. The two most prominent global accelerators are Y Combinator (YC) and Techstars.
| Feature | Y Combinator (YC) | Techstars |
|---|---|---|
| Standard Deal Terms | $500,000 total. $125k for 7% equity + $375k on an uncapped SAFE with an MFN clause 22. | $20,000 for 6% equity + optional $200k uncapped SAFE (mirroring YC structure) 22. |
| Format & Location | Remote/Independent work primarily, based around the San Francisco Bay Area 23. | Highly localized, immersive programs in specific cities worldwide (12 startups per session) 2223. |
| Acceptance Rate | Extremely low (roughly 0.8% for the Spring 2025 batch) 24. | Highly selective (typically under 1%) 2331. |
| Demo Day Reach | Massive global audience of 1,000+ investors, often sparking immediate fundraising momentum 22. | Localized events targeting strategic regional angels and venture capitalists 22. |
The expectations for startups entering these programs have escalated. For example, analysis of the Y Combinator Spring 2025 batch reveals that startups are entering the program with significant maturity; roughly 70% of companies reported meaningful revenue, averaging approximately $66,000 across the cohort, with a dozen exceeding $500,000 in revenue 24. Furthermore, the technological baseline has shifted. Building with Artificial Intelligence is no longer a unique differentiator - it is baseline infrastructure. In recent cohorts, nearly 100% of the participating startups featured AI at the core of their products 2425.
Stage 4: The Seed Round
If the pre-seed round funds the creation of the product, the seed round funds the early commercialization and validation of the business model. By the time a startup approaches the seed market, investors expect to see more than just a prototype. They look for a growing user base, early retention data, and initial revenue - often ranging from $25,000 to $200,000 in monthly recurring revenue depending on the industry 26. The startup team typically grows to between 4 and 10 employees during this phase 232426.
Seed Deal Mechanics
Seed rounds have ballooned in size over the past decade. The median U.S. seed round in 2024 and 2025 settled between $2.5 million and $3.5 million 1627. These rounds are generally priced at a $12 million to $15 million post-money valuation, meaning founders can expect to face another 20% to 25% equity dilution 16.
Unlike pre-seed rounds, which are dominated by SAFEs, seed rounds frequently utilize priced equity (though SAFEs still represent roughly 64% of seed deals) 19. Institutional seed funds prefer to take a lead role, write checks ranging from $500,000 to $2 million, and secure a board seat 16. Startups that secure a strong lead investor generally close their rounds faster and on better terms than those attempting to cobble together a "party round" of disparate angel investors 16.
Global Seed Funding Variations
While the U.S. dominates global venture volume, the seed stage dynamics vary significantly across different regions:
- Europe: European pre-seed and seed valuations saw a robust recovery through late 2024. Median pre-seed valuations surged to €4.1 million, and median seed valuations rose to €5.4 million, signaling a strong bounce back from 2023 lows 28.
- Latin America (LatAm): The LatAm ecosystem has shown resilience in the early stages. Early-stage investment in Q4 2025 surged to $690 million, a 112% increase from the prior year, predominantly driven by fintech innovations 29.
- Southeast Asia: The region has seen a sharp maturation. In the first half of 2025, late-stage deals surged 140%, while seed-stage funding collapsed by 50% as investors pivoted toward proven, capital-efficient winners, primarily concentrated in Singapore 30.
- Africa: The African tech ecosystem remains heavily weighted toward early-stage deals. In 2025, over 69% of all disclosed funding rounds were pre-Series A or earlier 31. The average deal size across the continent rose significantly to $9.1 million, though total funding remains constrained compared to historical peaks 31.
The "Valley of Death": Navigating the Series A Crunch
Securing seed funding is a significant milestone, but it merely buys a ticket to the most dangerous phase of the startup lifecycle. The transition from Seed to Series A is characterized by an alarming attrition rate.
The median time between a seed round and a Series A has stretched to 774 days (2.1 years) 3233.
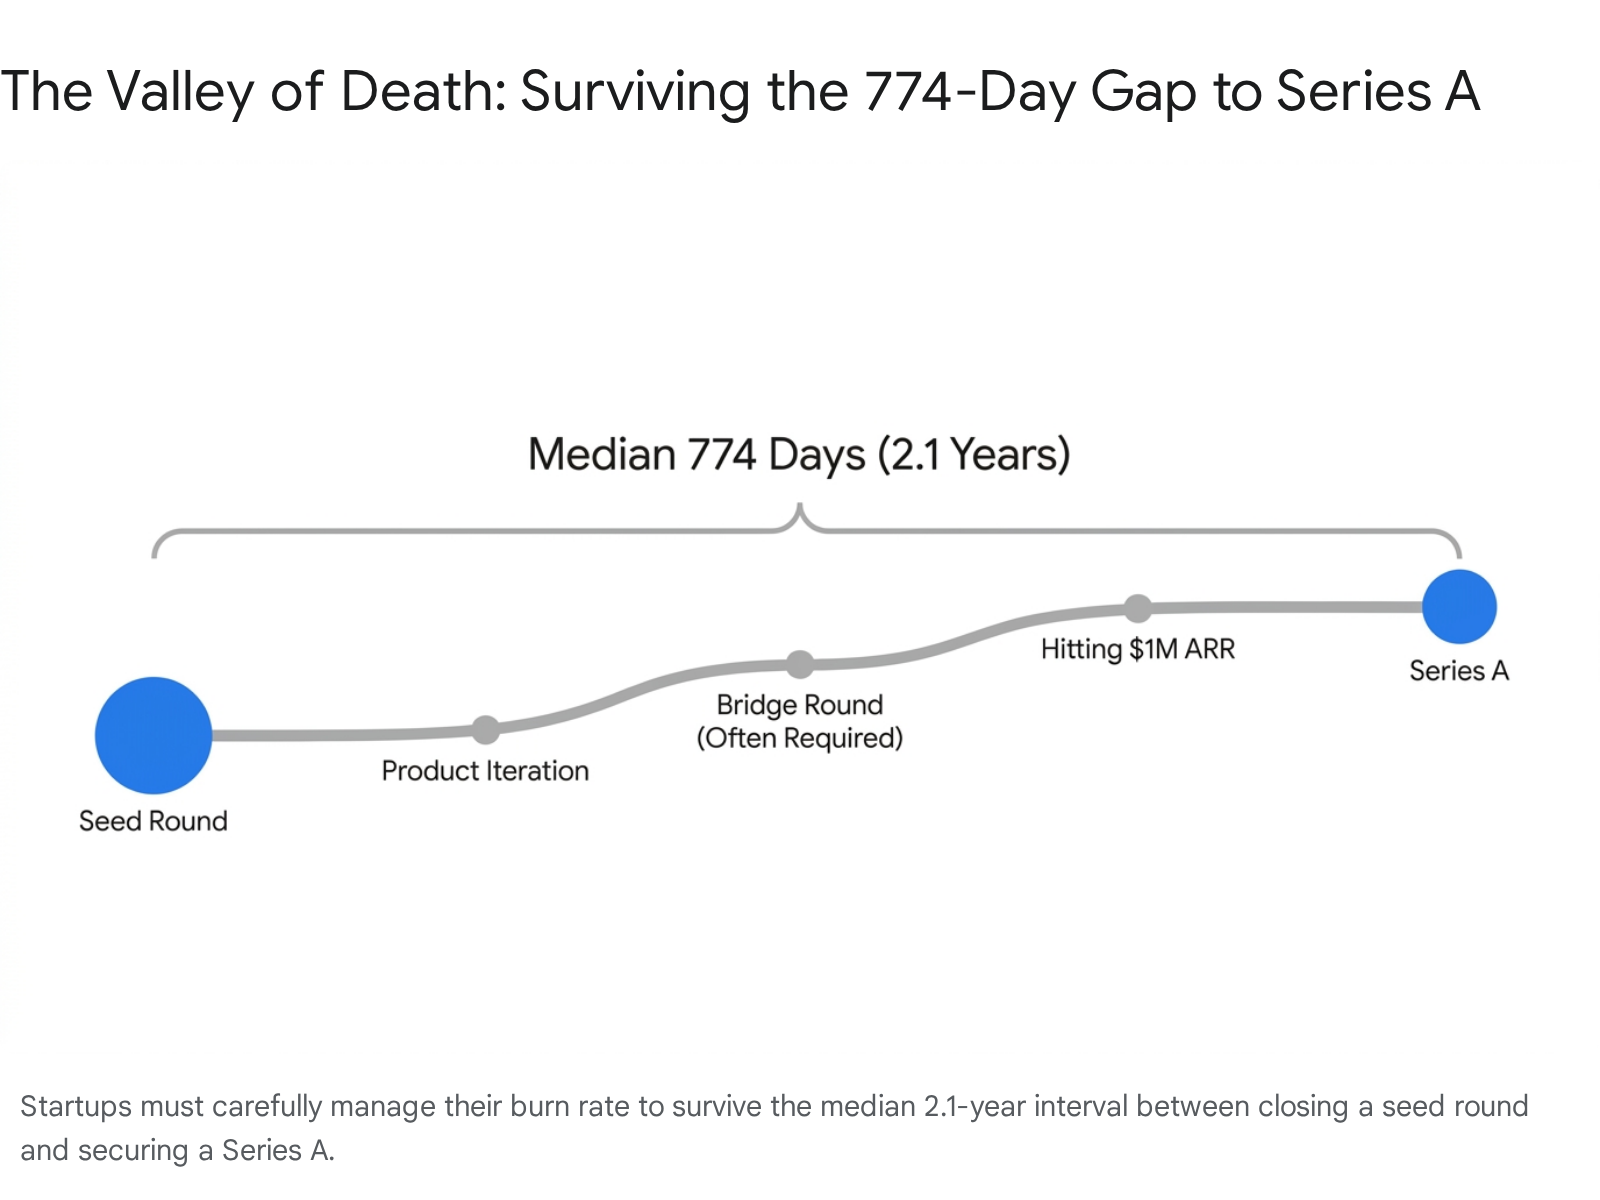
Certain sectors face even longer delays; fintech startups, for example, wait a median of 971 days (2.7 years) due to heavy regulatory scrutiny and complex due diligence requirements 3233.
Because founders historically budgeted for an 18-month runway, this extended timeline has created a severe liquidity crisis for many seed-stage companies 33. To survive, a massive proportion of startups have been forced to raise "bridge rounds" or extension rounds - interim financing provided primarily by existing investors to extend the company's runway. By 2024, nearly 40% of all seed and Series A transactions were categorized as insider bridge rounds, a near-historic high 3435.
Why Startups Die in the Valley
The primary cause of attrition in this phase is the shift in investor psychology. Early-stage seed investors back potential and vision, looking for a strong team and a promising MVP. Series A investors, however, underwrite historical performance and predictability. A startup fails to graduate to Series A when it cannot transition from a scrappy, founder-led sales motion to a repeatable, scalable business engine 17.
Research into startup post-mortems indicates that technical failure is rarely the culprit; only 38% of failures are attributed to technical shortcomings 17. Instead, the vast majority of companies die due to strategic deficits. The top reasons for failure include a lack of market demand (29% to 34%), running out of capital, building the wrong team (23%), being outcompeted (19%), and poor pricing strategies (18%) 636. Founders who focus exclusively on product development while neglecting distribution, go-to-market strategy, and customer feedback rarely survive this phase 17.
Interestingly, companies that utilize alternative financing paths like Regulation Crowdfunding (RegCF) have shown surprising resilience. Data on over 4,300 RegCF offerings reveals an 85% survival rate, suggesting that companies capable of mobilizing grassroots community investment have often pre-validated their product-market fit more effectively than those relying solely on insular venture networks 37.
The Artificial Intelligence Distortion
Any discussion of modern seed and Series A metrics must address the massive distortion created by Artificial Intelligence startups. AI companies operate in a fundamentally different valuation universe compared to traditional software-as-a-service (SaaS) businesses.
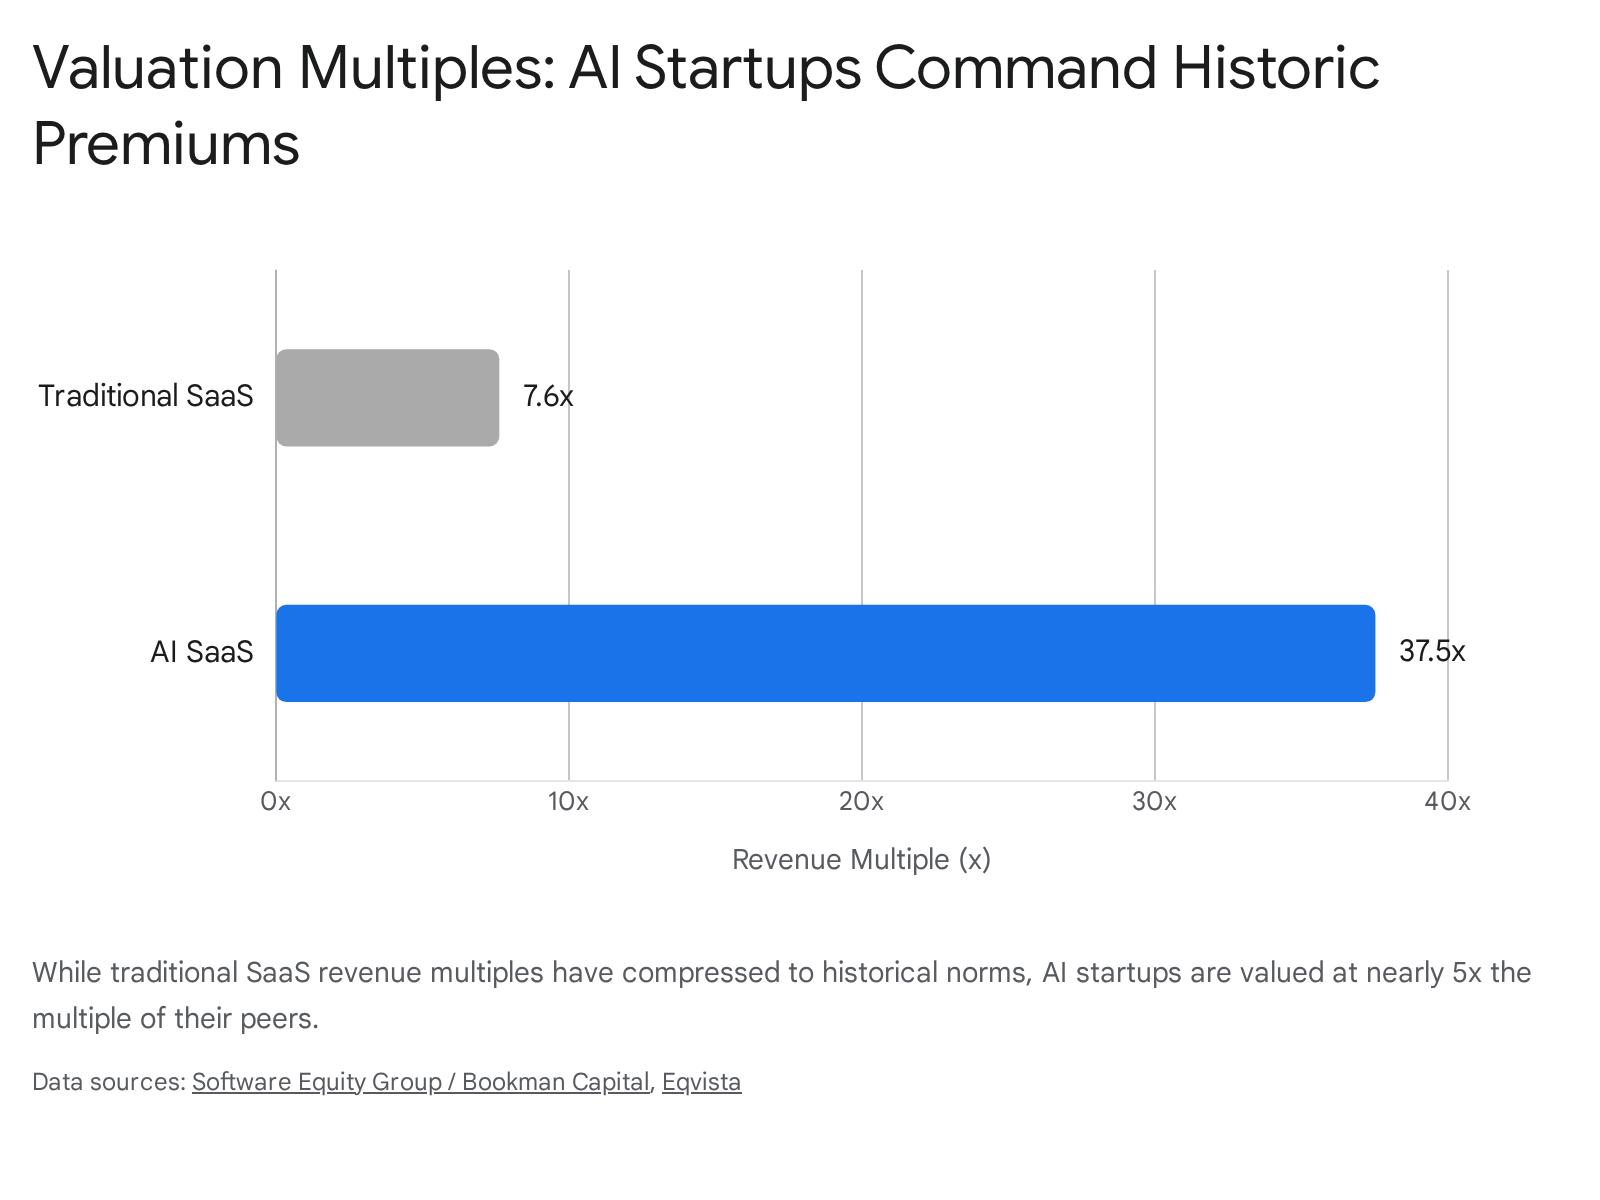
In public and late-stage private markets, traditional SaaS revenue multiples have compressed significantly since 2021. Median revenue multiples for venture-backed traditional SaaS companies stabilized around 10x ARR in 2024, while public SaaS companies hover between 6x and 7.5x 4538.
In stark contrast, AI startups command massive premiums. The median revenue multiple for AI companies sits at roughly 25.8x, with average multiples for top-tier private AI startups reaching an astonishing 37.5x 474849.
Some highly speculative foundational model companies achieve multiples exceeding 100x.
This dynamic trickles down to the earliest stages. AI companies account for nearly 50% of all deals valued over $500 million, and they routinely raise larger seed rounds at higher valuations 39. The median pre-money valuation for an AI Series A round in 2025 surged to approximately $84 million, with post-money valuations breaking the $105 million mark 49. Consequently, founders of non-AI companies must be careful not to benchmark their own fundraising expectations against blended averages that are heavily skewed by AI mega-rounds 2649.
Stage 5: Achieving Escape Velocity with a Series A
If a startup survives the valley of death, builds a repeatable sales motion, and proves its unit economics, it becomes ready to raise a Series A. The purpose of this round is to pour fuel on a fire that is already burning brightly.
Series A Metrics and Benchmarks
The 2021 fundraising era, where a startup could occasionally raise a Series A with $500,000 in Annual Recurring Revenue (ARR) and a compelling narrative, is definitively over 16. Today's Series A investors deploy capital with intense scrutiny, looking for businesses that resemble a de-risked machine: put a dollar in, and generate three dollars out 40.
In 2025 and 2026, Series A venture capitalists generally require the following traction benchmarks:
- Annual Recurring Revenue (ARR): The floor for a competitive Series A raise is now between $1 million and $2 million in ARR 16. Top-tier companies often hit the market with $2 million to $3 million in ARR 16.
- Revenue Growth: Investors demand proof of velocity. A growth rate of 150% to 200% Year-over-Year (YoY) is the standard expectation to attract a lead investor, though top quartile SaaS companies hit 50% growth 1641.
- Net Revenue Retention (NRR): NRR measures how much revenue a company retains from its existing customer base after accounting for upgrades, downgrades, and churn. Series A investors look for NRR above 101% to 110%, indicating that the product is so sticky that the existing customer base grows in value over time even if no new customers are added 164142.
- Capital Efficiency (CAC Payback): Startups must prove they can acquire customers efficiently. A Customer Acquisition Cost (CAC) payback period of under 18 months serves as a critical filter for discerning investors 16.
When these metrics are met, the rewards are substantial. The median Series A round size ranges from $10 million to $15 million 16. For traditional B2B SaaS companies, these rounds are typically negotiated at a pre-money valuation of $40 million to $55 million, resulting in an 18% to 22% equity dilution 16.
A Summary of Funding Milestones
The following table summarizes the general trajectory and benchmarks for traditional (non-AI) tech startups navigating from Pre-Seed to Series A 162426:
| Funding Stage | Median Raise | Pre/Post-Money Valuation | Typical Dilution | Target Metrics | Team Size |
|---|---|---|---|---|---|
| Pre-Seed | $750K - $1.5M | $4M - $6M (Post-money cap) | 15% - 20% | Early prototypes, pilot interest, $1K-$25K MoM Revenue. | 1 - 5 |
| Seed | $2.5M - $3.5M | $12M - $15M (Post-money) | 20% - 25% | Robust MVP, early product-market fit, $25K-$200K MoM Revenue. | 4 - 10 |
| Series A | $10M - $15M | $40M - $55M (Pre-money) | 18% - 22% | $1M-$2M+ ARR, 150%+ YoY growth, repeatable sales motion. | 10 - 50 |
Operational Shifts Post-Series A
Closing a Series A initiates a profound operational transformation within the startup. The influx of $10 million to $15 million transitions the company from a scrappy, survival-oriented team into a structured organization.
Headcount rapidly expands, typically growing to between 30 and 75 employees within the first year post-funding 2324. The nature of hiring also changes. During the pre-seed and seed stages, startups hire generalists who can wear multiple hats and pivot quickly 43. Post-Series A, the mandate shifts to hiring specialists - experienced vice presidents of sales, dedicated marketing teams, and specialized engineering pods 43.
The founder's role must evolve simultaneously. They transition from executing the daily groundwork to managing the people who do the work, establishing corporate governance, and preparing the foundation for an eventual Series B, private acquisition, or public offering 544.
Bottom line
The path from an unproven idea to a Series A funding round has become an arduous, multi-year test of operational excellence and capital efficiency. With graduation rates plummeting and the median time between rounds extending to over two years, founders can no longer rely on compelling narratives or sheer market exuberance to secure venture capital. Survival in the modern ecosystem requires rigorous early-stage validation, a willingness to bootstrap initial traction, and the ability to build a highly efficient, scalable business engine capable of generating $1 million to $2 million in ARR before attempting to raise Series A capital.