How Long a Runway Typical Seed Startups Actually Have
In today's venture capital market, typical seed-stage startups must secure 18 to 24 months of cash runway, representing a sharp increase from the 12 to 18 months that served as the standard just a few years ago. To survive this extended gap between funding rounds, median seed startups burn roughly $80,000 per month, though this figure fluctuates drastically between lean software companies and capital-intensive hardware or biotech firms. The venture capital landscape has shifted permanently; investors now demand rigorous capital efficiency, rewarding companies that optimize their burn multiples rather than pursuing unsustainable growth at all costs.
The Macroeconomic Shift: Why the 12-Month Runway is Dead
For over a decade, conventional wisdom in the global startup ecosystem dictated that a seed round should buy a founding team 12 to 18 months of financial runway 123. During the zero-interest-rate policy (ZIRP) era that peaked in 2021, venture capital was uniquely abundant. Founders were actively encouraged by their boards to spend aggressively to capture market share, operating under a "growth at all costs" mandate 451. In that macroeconomic environment, a 12-month runway was often entirely sufficient because the median time elapsed between a Seed round and a Series A transaction was merely 12 to 14 months 7.
The market reality for startups operating in 2025 and 2026 looks fundamentally different. The venture capital funding funnel has narrowed considerably, and the timelines required to prove a business model to institutional investors have stretched dramatically. The median time between a Seed round and a Series A has now extended well past two years, frequently cited at 24 to 30 months, or over 600 days 78910.
This structural shift is driven entirely by heightened investor expectations and an overall contraction in liquidity. Following the severe market corrections of 2022 and 2023, venture capitalists completely rewrote their underwriting standards. In 2021, an Annual Recurring Revenue (ARR) of $500,000 paired with a high user growth rate was often more than enough to secure a strong Series A lead investor 7. Today, the absolute floor for a Series A check in the software and SaaS sectors is typically $1 million to $2 million in ARR, accompanied by 150% or more year-over-year growth and net revenue retention sitting above 110% 7.
To hit these elevated commercial milestones without running out of cash mid-stride, startups simply require more time. As a result, the standard advice from top-tier venture capital firms, financial advisors, and equity management platforms is to raise enough capital to secure a minimum buffer of 18 to 24 months. For capital-intensive companies operating in deep tech or hardware, founders are actively pushed to target 24 to 30 months of runway 311112.
Deconstructing the Mechanics of Burn Rate and Runway
Understanding the nuances of runway requires a precise dissection of how a startup actually spends its money. According to post-mortem data on venture-backed companies, nearly 30% of startups fail simply because they run out of cash, making burn rate management the foundational operational skill of any founding team 51213.
Burn rate represents the velocity at which a company depletes its cash reserves, typically calculated and reviewed on a monthly basis. However, tracking this effectively requires a firm understanding of the distinction between two entirely different metrics: Gross Burn and Net Burn.
The Realities of Gross Burn Rate
Gross Burn is the total, unadjusted amount of cash going out the door each month. It encompasses every single operational expense incurred by the business: payroll, software subscriptions such as cloud hosting and customer relationship management tools, office rent, legal and compliance fees, marketing spend, and contractor invoices 51214.
For example, if a startup spends $90,000 on employee salaries, $15,000 on server architecture, and $10,000 on office space, its gross burn is exactly $115,000. Gross burn is a critical metric for understanding the baseline fixed costs required to keep the company operational, independent of how well its product is actually selling in the market. For early-stage technology companies, particularly those in the software sector, the largest driver of gross burn is almost always headcount - specifically, the highly competitive cost of engineering and technical talent 4.
Understanding Net Burn Rate
Net Burn, conversely, is the true measure of a company's financial loss. It is calculated by taking the Gross Burn and subtracting any incoming cash receipts, which might include monthly recurring revenue, interest income, or government grant disbursements 1214.
Using the previous scenario, if the startup has a Gross Burn of $115,000 but manages to generate $35,000 in monthly revenue, its Net Burn sits at $80,000. When venture capitalists, board members, or potential acquirers ask a founder about their "burn rate," they are almost exclusively referring to the Net Burn, as this is the figure that actively depletes the capital raised during a funding round 14.
The Danger of Mathematical vs. Operational Runway
Runway is the amount of time - measured strictly in months - a company can survive at its current burn rate before its cash balance hits zero. The formula is seemingly straightforward: total cash in the bank divided by the current monthly net burn 13142.
If a startup successfully raises a $3.2 million seed round and maintains a monthly net burn of $160,000, it mathematically possesses exactly 20 months of runway. However, experienced founders and seasoned financial analysts know that a pure spreadsheet calculation rarely reflects operational reality. Startups cannot safely operate their bank accounts down to the absolute zero mark.
Fundraising itself is a highly resource-intensive process that routinely takes three to six months of active pitching, due diligence, partner meetings, and legal paperwork negotiation 3. Therefore, a company with 20 months of mathematical runway truly only has about 14 months of actual execution runway. Once that 14-month mark is hit, the chief executive officer must shift their focus almost entirely away from product development and back toward raising capital 3. If a company fails to plan for this six-month fundraising window, they risk entering negotiations from a position of profound weakness, leading to highly dilutive down-rounds or outright bankruptcy.
The Seed Stage Metamorphosis: 2021 vs. 2026
As the time required to reach a Series A benchmark has doubled, the size and scope of the seed round itself have ballooned to compensate for the longer journey. Seed rounds in the contemporary market are no longer the small, highly experimental checks they were a decade ago.
Historical data illustrates this dramatic evolution. In 2018, the median United States seed round hovered at approximately $1 million. By 2025 and progressing into 2026, the median seed round had tripled, landing between $3 million and $3.5 million 793. The upper quartile of seed rounds now routinely reaches $5.6 million, a figure that would have been considered a robust Series A check in previous eras 9.
Concurrently, the valuations attached to these early-stage companies have surged. The median pre-money valuation for seed startups reached a record high of $15 million to $16 million in late 2024 and maintained that level through 2025 8345. Despite this massive influx of capital per company, overall deal volume at the seed stage has dropped significantly. This divergence indicates a structural shift in investor psychology: venture capitalists are increasingly risk-averse, opting to write much larger checks to a smaller, concentrated pool of high-conviction companies rather than spreading small bets across a wide array of unproven founders 36.
To fully grasp how the environment has evolved, a direct comparison of the shifting benchmarks is required.
| Market Metric | The 2021 ZIRP Era | The 2025/2026 Market Reality |
|---|---|---|
| Target Runway Recommendation | 12 to 18 months | 18 to 24+ months |
| Median Time from Seed to Series A | 12 to 14 months | 24 to 30 months |
| Median Seed Round Size (US) | ~$1.5 Million | $3.0 Million to $3.5 Million |
| Median Seed Valuation | ~$9 Million to $10 Million | $15 Million to $16 Million |
| Series A ARR Requirement | ~$500,000 | $1 Million to $2 Million |
| Primary Investor Focus | Revenue velocity and user growth | Capital efficiency and unit economics |
Sector-by-Sector Burn Rate Benchmarks
There is no universal "normal" when it comes to startup burn rates. A software company building a straightforward workflow application requires a fundamentally different cost structure and capital allocation strategy than a deep-tech robotics firm prototyping complex hardware. Across the current data landscape, a startup's chosen industry dictates its expected baseline burn rate and the amount of patience investors will exhibit.
Software as a Service (SaaS) and Enterprise Software
Software-as-a-Service (SaaS) companies are generally the most capital-efficient startups in the modern economy. In the pre-seed phase, SaaS companies typically burn between $40,000 and $70,000 per month 20. This relatively modest budget generally covers the salaries of the technical co-founders, essential cloud infrastructure, and early design or product management resources 20.
By the time a SaaS company successfully closes an institutional Seed round, the median burn rate typically escalates to roughly $80,000 to $100,000 per month. As the company approaches Series A and begins aggressively scaling its sales and marketing teams to capture market share, that figure can scale up to $350,000 per month 520. Because their gross margins are exceptionally high - often reaching 80% to 90% once the core platform is built - every new dollar of recurring revenue quickly and meaningfully offsets the gross burn.
Consumer Applications and Marketplaces
Consumer technology startups generally burn cash at a noticeably faster rate than B2B SaaS companies at the early stages, with typical burn rates ranging from $50,000 to $90,000 per month even at the pre-seed level 20. The primary driver of this elevated expenditure is the relentless pressure of Customer Acquisition Cost (CAC).
To validate unit economics and prove to subsequent investors that genuine market demand exists, consumer founders are forced to allocate substantial monthly budgets - often $5,000 to $15,000 or more - to paid advertising channels to validate their growth models 20. Marketplaces face an even steeper and more complex challenge. Because they rely on network effects, they must subsidize a "two-sided" acquisition strategy, spending aggressively to attract both buyers and sellers simultaneously before organic momentum takes over.
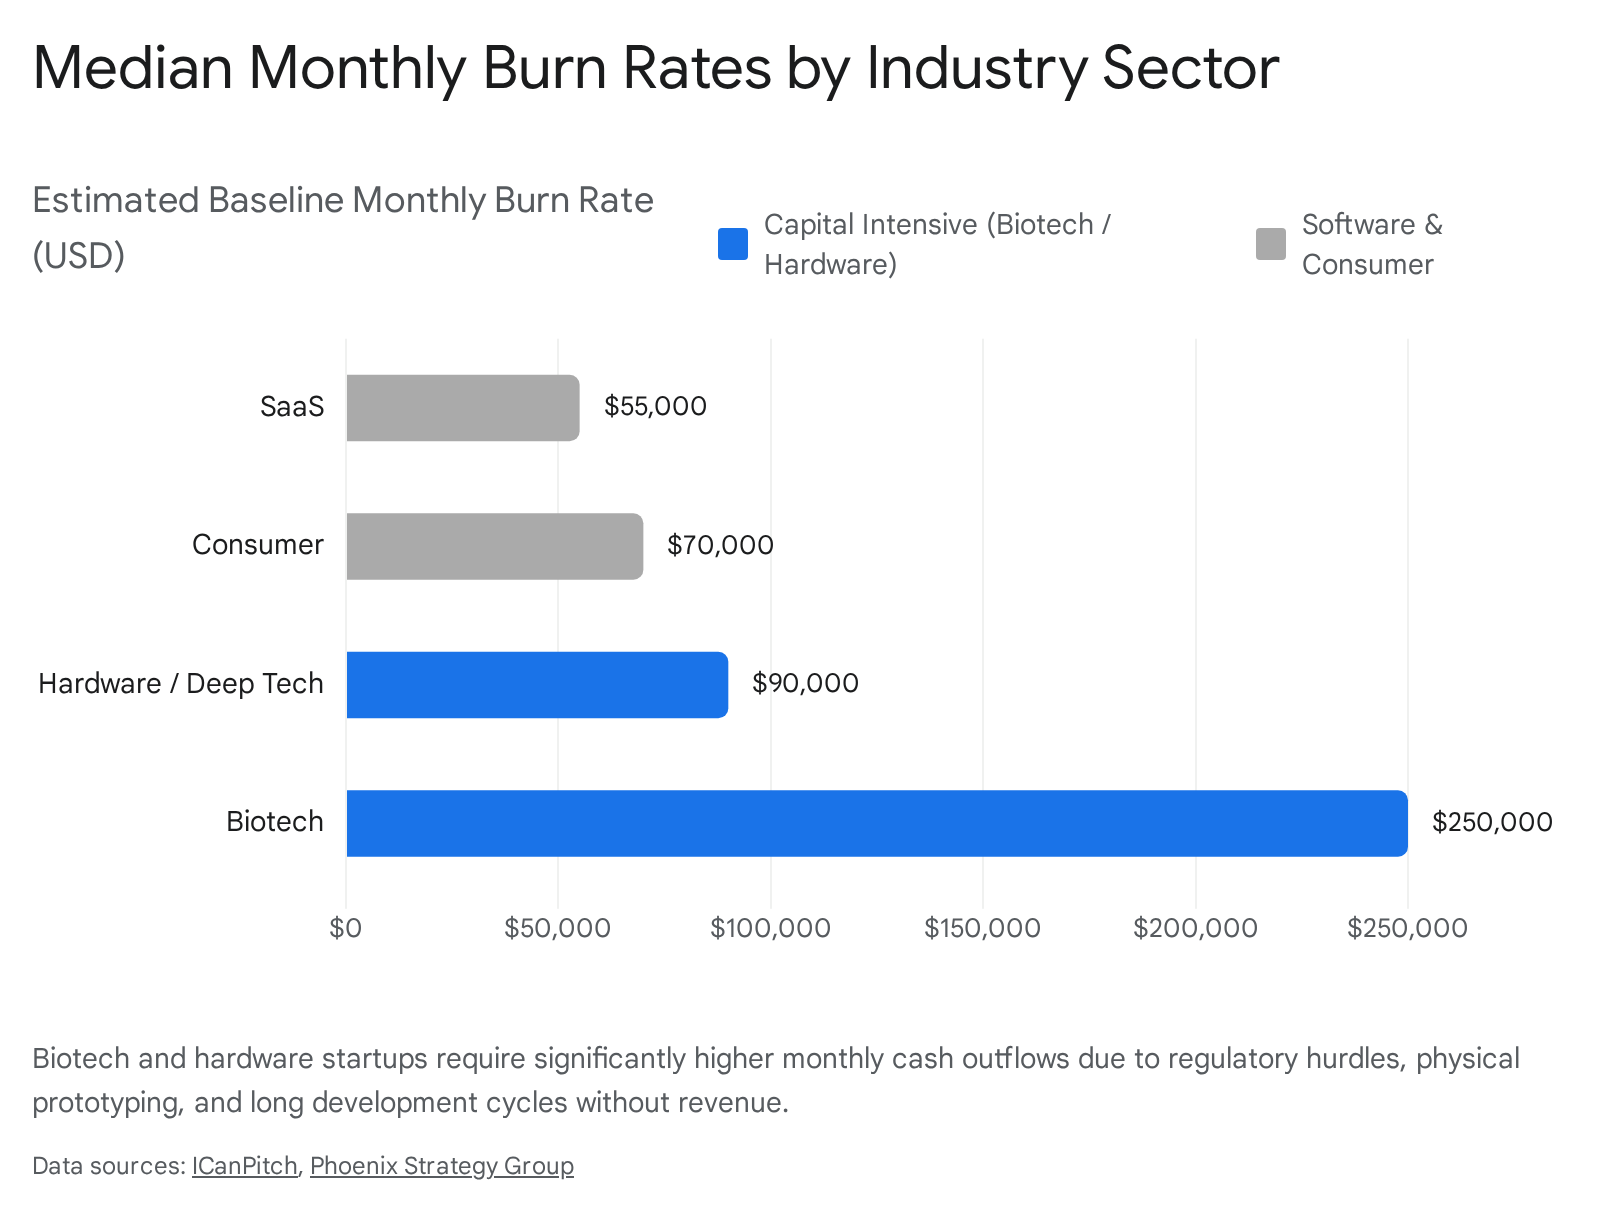
Hardware and Deep Tech Manufacturing
Physical products require physical capital, and software metrics simply do not apply to hardware development. Hardware startups consistently post some of the highest pre-seed and seed burn rates in the ecosystem, ranging heavily from $60,000 to $120,000 or more per month at the absolute earliest stages 20.
This massive premium is driven by the immutable costs associated with physical engineering. Hardware teams must pay for expensive physical prototyping, specialized manufacturing tooling, securing early supply chain commitments, and navigating complex regulatory compliance 20. Furthermore, because hardware development cycles are inherently slower and more rigid than pushing iterative software updates, industry analysts advise hardware founders to secure a minimum of 18 to 24 months of runway just to reach a functional prototype phase, insulating them from inevitable manufacturing delays 20. Despite these challenges, data indicates that successful hardware startups can deliver exceptionally high internal rates of return, occasionally outperforming software peers by establishing deep physical moats 7.
Biotechnology and Life Sciences
Pre-revenue biotechnology and healthcare companies exist in a financial reality that few other businesses share. Their clinical development cycles can span anywhere from five to fifteen years without generating a single dollar of commercial product revenue 22. As a direct result, biotech burn rates dwarf traditional technology metrics, frequently ranging from $250,000 to well over $2,000,000 per month during pre-revenue and active clinical stages 23.
Crucially, biotech spending is almost never linear. Instead of predictable monthly payroll expansions, biotechs face massive, lumpy capital outflows driven by clinical milestones. Payments to Contract Research Organizations (CROs) for securing trial sites, patient enrollment, and data management represent massive, irregular capital outlays 22. Furthermore, regulatory uncertainty plays an outsized role in runway management. If the FDA requests additional preclinical data, it can instantly stall a trial. This forces the biotech firm to absorb high baseline carrying costs for laboratory space and specialized personnel for an extra year or more, all without hitting the clinical milestones required to trigger their next tranche of venture funding 22.
The Artificial Intelligence Anomaly
Startups building core Artificial Intelligence (AI) models and Machine Learning infrastructure have effectively created a highly bifurcated funding market. On one hand, foundational AI startups face extreme gross burn rates due to the exorbitant, unavoidable costs of compute power, massive cloud storage for model training, and the intense bidding wars required to secure scarce AI engineering talent. Monthly burn rates for these highly specialized companies frequently range from $100,000 to well over $500,000 even at the seed stage 23.
However, venture capitalists are uniquely willing to fund this aggressive spending profile due to the perceived transformative nature of the technology and the massive total addressable markets at stake. In 2025, AI startups captured a staggering 65% of all venture capital deployed 38. The market assigns these companies an aggressive "AI premium." At the Series A level, the median valuation for an AI-focused startup was recorded at 38% higher than its non-AI counterpart, and by late-stage funding rounds, that premium stretched to nearly 200% 99.
The "Burn Multiple": The New Gold Standard for Investors
Perhaps the most significant and permanent shift in venture finance between the boom of 2021 and the reality of 2026 is the specific metric investors use to evaluate a company's fundamental health. Venture capitalists are no longer satisfied simply tracking a startup's raw revenue growth or monitoring its absolute monthly burn rate. Instead, Series A boards have crystallized their focus around a highly specific metric designed to measure capital efficiency: the Burn Multiple 10.
The Burn Multiple measures exactly how much cash a company must incinerate to generate a single new dollar of Annual Recurring Revenue. The formula is ruthless in its simplicity: Net Cash Burn divided by Net New ARR 10.
If a startup burns $2 million in a quarter to add exactly $1 million in new recurring revenue, its burn multiple is 2.0x. This metric serves as a powerful equalizer across the industry because it captures both growth velocity and capital discipline simultaneously 10. A company growing its top-line revenue incredibly fast might look wildly successful on a standard profit and loss statement, but if its burn multiple is 4.0x, it is buying that growth at an entirely unsustainable loss.
Interpreting Efficiency Benchmarks
In 2025 and 2026, the benchmarks for what constitutes "good" efficiency have tightened dramatically, forcing founders to rethink their go-to-market strategies.
If a company operates with a burn multiple over 2.0x, it is viewed as highly inefficient by modern standards. This indicates that the startup is either spending massive amounts of capital on sales and marketing campaigns that yield low conversion rates, or it is carrying an excessively bloated engineering team relative to its actual commercial output.
A burn multiple between 1.5x and 2.0x is generally considered the survival zone. The median Series A SaaS company in 2025 struggled to achieve a burn multiple hovering around 1.6x, meaning they spent $1.60 for every new dollar of recurring revenue gained 2310.
A multiple between 1.0x and 1.5x is viewed as highly positive, demonstrating strong product-market fit. In this scenario, customers are actively acquiring the product without the company needing to heavily subsidize the sales motion with expensive enterprise sales teams or massive ad budgets.
The absolute elite tier consists of startups operating with a burn multiple under 1.0x. These companies are generating more new revenue than they are burning in cash. Interestingly, while foundational AI companies face high absolute costs, a new breed of lean, "AI-native" software startups are completely rewriting efficiency playbooks. By utilizing autonomous agents for first-line customer support, automated lead generation, and AI-assisted coding tools, these ultra-lean startups are achieving sub-1.0x burn multiples 2310. Institutional investors are aggressively hunting for exactly this profile: a company possessing the technological moat of advanced AI, combined with the extreme capital efficiency of a bootstrapped business 2310.
The Graduation Crisis: The Chasm Between Seed and Series A
Startup founders are currently navigating a historic bottleneck in the venture capital funnel. While early-stage seed funding has remained relatively resilient compared to later stages, the leap required to progress from a Seed round to a Series A has become an existential chasm for most companies.
Extensive industry data points to a total collapse in "graduation rates" - the percentage of seed-funded startups that successfully raise an institutional Series A round. The pathway has transformed from a relatively predictable progression into an extreme filter. Historical cap table data demonstrates this starkly: whereas roughly 30.6% of startups that raised a seed round in the first quarter of 2018 successfully secured a Series A within two years, that figure plummeted to just 15.4% for the 2022 cohort 911. For companies raising substantial $1 million-plus seed rounds in 2024, early data projects the graduation figure remaining stalled at an abysmal 16% 9.
This data indicates that today, fewer than one in five seed-funded startups will successfully raise institutional Series A capital. The system has shifted aggressively from "progression by default," where achieving decent, steady growth was enough to secure the next check, to "progression by exception," where only elite outlier companies with perfect metrics survive the diligence process 3.
The Explosion of the "Bridge" Round
Because the bar for a successful Series A has been raised to $1 million to $2 million in ARR, and because achieving that level of commercial traction usually takes far longer than the traditional 18-month runway affords, founders are routinely running out of cash before they are ready to pitch Series A firms.
The venture market's functional solution to this timeline gap has been the massive proliferation of "bridge" or extension rounds. Rather than launching a formal, priced Series A roadshow, founders return to their existing seed investors to raise smaller, interim rounds - often executed via Simple Agreements for Future Equity (SAFE notes) or convertible debt instruments - simply to buy another 6 to 12 months of survival time 11.
By 2025 and moving into 2026, an estimated 40% to 46% of all seed-stage venture rounds were actually categorized as bridge or extension rounds 104. For venture funds, this trend causes immense portfolio gridlock; capital reserves that would typically have been deployed into new, innovative pre-seed companies are instead continually diverted to keep existing portfolio companies afloat 12.
For founders, relying heavily on bridge rounds causes severe cap table dilution. If a founding team must raise a pre-seed round, a traditional seed, a seed-extension, and a final bridge round just to survive until Series A, they may find their personal equity ownership compressed to a fraction of its original value before the company even begins to scale in earnest 9.
Geographic Divergence: Global Runway Realities
The statistics surrounding runway duration, baseline burn rates, and graduation probabilities are heavily influenced by a startup's geography. The global venture market is not a monolith, and the operating norms and expectations vary wildly across borders.
The United States: High Capital, High Burn
The United States remains the undisputed heavyweight of venture capital, representing a tightly concentrated and highly capitalized ecosystem. In 2025, the San Francisco Bay Area alone hosted over 11% of all U.S. startups, maintaining its status as the densest innovation cluster on the globe 13.
U.S. startups benefit enormously from a massive, unified domestic market and deep institutional capital pools, including pension funds and university endowments, backing domestic VC firms 3014. As a result, the average funding per company in the U.S. is nearly five times higher than its European equivalents 14. This sheer volume of capital allows American founders to raise substantially larger rounds, sustain much higher monthly burn rates, and prioritize rapid scaling over immediate, short-term profitability 14. Consequently, U.S. startups historically graduate from Seed to Series A at higher rates than their international peers, as they simply have more capital to fuel their experimentation 11.
Europe: Capital Constraints and Purposeful Growth
The European startup ecosystem operates on an entirely different rhythm. While European technology hubs like London, Paris, and Berlin are growing rapidly - with the broader European ecosystem expanding at a rate of 27% in 2025, effectively double the U.S. growth rate - total late-stage capital deployment remains heavily constrained 133015.
European startups face immediate, complex structural headwinds. Instead of deploying into a single 50-state market with one language and currency, they must navigate 27 distinct national markets, each with different regulatory bodies, tax codes, and compliance regimes, drastically increasing the friction and cost of early cross-border growth 3014. Furthermore, Europe continues to suffer from a severe lack of late-stage growth capital, forcing companies to look to the U.S. if they wish to become global unicorns 1415.
Because growth capital is relatively scarce, European founders simply cannot adopt the classic Silicon Valley "fail fast" mentality of high-burn hypergrowth. European startups are forced by their investors to run much leaner operations, focusing heavily on early revenue generation and sustainable profitability 30. This risk-averse environment reflects in the macro data: the graduation rate from Seed to Series A in Europe sits painfully low, estimated between 11% and 19%, significantly trailing the U.S. average 1133. However, the European companies that do survive this gauntlet tend to be highly capital-efficient, durable businesses, and the continent is heavily focused on purpose-driven, long-term sectors like climate tech and energy sustainability 1230.
Latin America and Southeast Asia: Maturation and Selectivity
Emerging technology hubs clearly reflect the global tightening of early-stage risk capital. In Latin America, following a massive funding peak in 2021, the market stabilized into a distinct "fewer rounds, more capital" dynamic 16. While late-stage funding for proven winners surged, seed-stage funding became highly selective, with investors demanding stringent proof of capital efficiency. Interestingly, 2025 saw highly dynamic regional shifts, such as Mexico briefly overtaking Brazil in total VC funding volume for the first time in 15 years, driven by massive momentum in the local fintech sector 161718.
Similarly, in Southeast Asia, the data highlights a stark pivot toward ecosystem maturity. In the first half of 2025, late-stage funding deals surged by 140%, while early seed-stage funding collapsed by 50% as investors retreated to safety 37. Across the globe, investors have uniformly retreated from early-stage, high-burn experimentation in favor of backing proven, scalable business models with clear, mathematically sound paths to profitability 37.
Operational Strategies for Preserving Runway
Whether evaluating a company from the perspective of a founder steering the ship, or a prospective employee deciding whether to join, understanding the mechanics of runway is quite literally a matter of professional survival.
For Founders: Extending the Timeline
Startups that successfully survive the brutal 24-month gap between Seed and Series A do not rely on market luck; they employ rigorous financial discipline. When a company realizes it cannot magically raise more capital in a tight market, it must artificially "buy time" by optimizing its operations. Highly effective tactics include focusing relentlessly on the burn multiple. Founders must track their Net Burn against Net New ARR on a strict monthly basis. If the multiple exceeds 2.0x, it serves as a glaring alarm that marketing spend or aggressive sales headcount must be paused until conversion rates improve 1223.
Furthermore, successful founders shift heavy fixed expenses into variable cost structures. Avoiding long-term commercial office leases in favor of flexible arrangements preserves critical cash flexibility when unforeseen pivots are required 12. Finally, mature startups abandon static, rigid annual budgets in favor of rolling 18-month cash forecasts, updating their runway projections constantly based on real-time revenue receipts and expense data to avoid any end-of-year surprises 14.
For Prospective Employees: Assessing Employment Risk
Joining a seed-stage startup inherently involves accepting a high degree of financial risk and job insecurity in exchange for the potential of significant equity upside. During the interview process, candidates should never be afraid to treat the startup's financial health as a primary, non-negotiable point of diligence 19.
Critical questions a candidate should ask a founder before accepting an offer include inquiring directly about the company's current cash runway. If the stated runway is under 12 months, it should prompt serious, probing questions about immediate job security and the viability of the business model 1939. Candidates must also ask when the leadership team plans to raise the next round of funding, and precisely what commercial milestones are required to unlock that capital 4041.
When evaluating compensation, asking what percentage of the company's total fully-diluted equity an options grant represents is mandatory, as raw share counts are entirely meaningless without knowing the total denominator 42. Finally, clarifying the exact vesting schedule and determining if there are complex performance conditions tied to the grant protects the employee's long-term interests 3942. Founders who are transparent and confident in answering these highly specific financial questions demonstrate mature, trustworthy leadership. Conversely, any evasiveness regarding burn rate, runway, or equity structures should be viewed as a massive red flag by top talent 39.
Bottom line
The era of raising a seed round strictly on the promise of a disruptive idea to fund 12 months of high-burn experimentation is definitively over. Today, hard data clearly dictates that seed-stage startups must optimize for long-term survival, maintaining 18 to 24 months of runway with median burn rates hovering around $80,000 per month for typical software companies. While artificial intelligence innovations command massive valuations, and capital-intensive sectors like hardware and biotech operate on completely different milestone structures, the universal truth for all founders is that investors now heavily prioritize capital efficiency. Survival in the modern venture ecosystem requires proving a sustainable business model, measured relentlessly by the burn multiple, rather than pursuing unchecked growth at any cost.