Startup growth patterns to $1 million in annual recurring revenue
Achieving one million dollars in annual recurring revenue (ARR) represents a fundamental structural transition for early-stage software companies. It marks the evolution from an experimental project seeking product-market fit into a revenue-generating enterprise capable of scaling its commercial operations. Historically, reaching this milestone was primarily a function of aggressive capital deployment and a "growth at all costs" mentality favored by venture capital. However, the macroeconomic conditions of 2024, 2025, and into 2026 - heavily defined by analysts as a "Great Recalibration" - have inverted these assumptions 1. Today, successful early-stage scaling requires a rigid adherence to capital efficiency, optimal unit economics, and the deep integration of artificial intelligence into core workflows 12.
The median Software as a Service (SaaS) startup requires approximately two years and nine months from the acquisition of its first customer to reach the $1M ARR threshold 34. Best-in-class organizations achieve this milestone in under twelve months, while market laggards often require more than four years 34. Understanding how these top-performing entities separate themselves requires a detailed analysis of their go-to-market strategies, operational spending constraints, customer retention mechanics, geographic scaling advantages, and capital structures.
Market Context and the First Revenue Milestone
The journey to $1M ARR acts as a critical filtering mechanism in the software ecosystem. Data from industry analysts reveals that nearly half of software startups eventually reach $1M ARR within a ten-year timeframe, but the velocity at which they do so predicts their long-term viability 3. The one-million-dollar mark is widely considered the threshold where a company proves it can acquire and retain customers predictably, thus qualifying for institutional Series A funding 5.
For companies targeting venture-scale returns, reaching $1M ARR is merely the starting line for the "T2D3" framework. The T2D3 path - which stands for triple, triple, double, double, double - charts an aggressive trajectory from $1M ARR to a $100M ARR unicorn valuation over roughly six to seven years 67. To maintain this pace, companies must transition from sporadic, founder-led sales into systematic revenue generation.
However, the expectations for what constitutes a "successful" ramp to $1M ARR have shifted significantly with the advent of mature artificial intelligence platforms. Pre-AI, generating $1M ARR in the first twelve months was considered the gold standard for enterprise startups 6. Based on data analyzing hundreds of AI-native companies over the last 18 months, those historic benchmarks are now on the lower end of the growth spectrum 6. The median enterprise AI company in recent sample sets reached more than $2M in ARR within its first year, successfully raising a Series A round just nine months post-monetization 6. Consumer AI applications demonstrated even faster velocity, with the median reaching $4.2M in ARR and raising institutional rounds within eight months of their launch 6. Consequently, startups scaling in the modern era must contend with compressed competitive windows and elevated investor expectations.
Early-Stage Go-To-Market Strategies
The initial path to $1M ARR is rarely achieved through the highly automated, scalable systems utilized by mature enterprises. Instead, it is initially driven by highly manual, targeted efforts led directly by the founding team. Founders must establish strict market parameters and personally validate the commercial viability of their software before institutionalizing and delegating the sales process.
Ideal Customer Profile and Market Segmentation
A pervasive pattern among startups that successfully reach $1M ARR is their initial constraint of the total addressable market. Rather than targeting a broad, horizontal audience, early-stage companies must define an "uncomfortably narrow" ideal customer profile (ICP) 5. This hyper-segmentation allows the company to focus its limited engineering and marketing resources on solving a specific, high-value problem for a homogenous group of buyers.
An effective ICP at the pre-$1M stage specifies not just the industry vertical, but exact company size ranges (e.g., 50 - 200 employees), revenue bands, geographic focus, and the precise title of the economic buyer 7. Furthermore, it identifies specific trigger events - such as recent funding rounds or the implementation of a complementary technology stack - that indicate immediate buying intent 7. This level of precision directly impacts conversion economics. At average B2B conversion rates, a startup needs 2,000 to 5,000 qualified leads to secure its first 100 customers 7. By tightening the ICP and investing in data quality, companies can push conversion rates from a baseline of 2% up to 7%, dropping the required lead volume to between 1,400 and 2,000 prospects 7.
This focused approach is particularly effective in vertical SaaS markets. Vertical software targets industry-specific workflows (such as healthcare tech or construction) rather than generic business functions. The vertical SaaS market is projected to grow two to three times faster than horizontal solutions, heavily driven by the presence of dense business networks, industry associations, and specialized conferences that make customer acquisition dramatically cheaper 1011. In a vertical market comprising 10,000 businesses, a startup charging just $75 per month requires an adoption rate of roughly 10% (1,100 customers) to achieve $1M ARR 11.
The Mechanics of Founder-Led Sales
The earliest stages of revenue generation are almost universally dependent on founder-led sales. Benchmarks suggest that founders should personally close the first twenty to thirty customers before delegating the revenue function to a dedicated sales hire 57. This phase is not merely about generating initial cash flow; it is an irreplaceable discovery mechanism for validating the product's core value proposition, understanding the friction points in the buyer's journey, and establishing pricing elasticity.
Founders are advised to rely heavily on outbound cold outreach during this phase, rather than resting entirely on warm network introductions. Cold outreach rigorously tests genuine market demand and proves that the value proposition resonates with independent buyers who have no prior relationship with the founding team 5. Common benchmarks indicate that outbound cold email campaigns at this stage typically yield a customer acquisition cost of approximately $400 and a time-to-first-customer of two to four weeks, making it a highly scalable initial channel compared to slower content marketing or SEO efforts 7.
A common misstep is viewing founder-led sales as an unpleasant phase to graduate from as quickly as possible. Successful founders recognize that early sales efforts must build a repeatable system that can eventually be transferred 12. If a founder cannot repeatedly acquire customers, the company has not achieved go-to-market fit, making any subsequent sales hires destined for failure 12.
Timing and Expectations for the First Sales Hire
Transitioning from founder-led sales to a formalized sales team is a perilous juncture for early-stage companies. A catastrophic and frequently observed mistake is the premature hiring of a senior sales executive - such as a Vice President of Sales or Chief Revenue Officer - before crossing the $1M ARR mark. Startups without established, repeatable revenue motions cannot utilize a VP of Sales effectively, as these executives are trained to scale existing playbooks rather than invent new ones 5. Furthermore, their high compensation packages can consume a disproportionate share of the operating budget, creating an unsustainable cash burn 5.
The first sales hire should ideally be a mid-level account executive who acts as a closer rather than an explorer 7. Founders must hand this individual a proven playbook, verified lead lists, and a defined ICP, rather than a blank customer relationship management (CRM) software 7. If a startup hires a sales representative before establishing product-market fit, they end up paying a premium salary for an employee to figure out basic market dynamics that the founders should have resolved themselves 7.
Acquisition Models and Revenue Frameworks
As a startup approaches and surpasses $1M ARR, the mechanics of customer acquisition must transition into a systemic go-to-market motion. The choice of strategy is rarely a philosophical preference; it is dictated mathematically by the product's inherent complexity, the average contract value (ACV), and the purchasing behavior of the target buyer.
Product-Led Growth for Low Contract Values
Product-Led Growth (PLG) relies on the software itself to drive user acquisition, activation, and conversion, typically through freemium tiers or self-serve free trials. This motion is structurally required when the ACV is below $10,000 to $15,000 per year 89. If a product generates only $5,000 in annual revenue, the unit economics simply cannot support the fully loaded cost of a human sales representative, which would result in an unsustainable customer acquisition cost (CAC) payback period of 24 months or more 8.
By removing the sales team from the initial conversion event, PLG allows the product to sell itself. This efficiency drops the CAC to between $200 and $2,000, bringing payback periods down to an optimal 3 to 12 months 8. Furthermore, PLG companies tend to grow roughly 30% faster at the same revenue level compared to their sales-led counterparts 8. However, this rapid distribution comes at the cost of higher upfront cash burn allocated to product development and engineering, as the user interface must be flawless to ensure seamless self-service onboarding 8. A key trend emerging in B2C and low-ACV B2B SaaS is the shift away from ungated freemium models toward hard paywalls and credit-card-required trials; market data indicates that hard paywalls produce a median 10.7% trial-to-paid conversion rate, compared to a mere 2.1% for traditional freemium models 15.
Sales-Led Growth for Enterprise Complexity
Conversely, Sales-Led Growth (SLG) is mandatory when the software handles complex enterprise workflows, requires integration with legacy systems, or operates at an ACV above $25,000 9. At these premium price points, purchases involve multi-stakeholder buying committees, extensive security reviews, and custom contract negotiations that a self-service checkout portal cannot accommodate 89.
While sales cycles in the SLG model are inherently longer - often extending from 60 to 120 days - the high revenue per deal yields highly efficient unit economics once the customer signs a multi-year contract 716. Top-tier sales-led companies reaching $1M ARR establish strict qualification criteria for their sales funnel, ensuring account executives spend their time exclusively on prospects that match the established ICP rather than chasing poorly fitting leads 717.
The Hybrid Revenue Model Transition
While companies typically lean heavily on one distinct motion to secure their first $1M ARR, the most successful scaling organizations eventually adopt a hybrid model. Often termed "Product-Led Sales," this framework utilizes the PLG motion as a highly efficient, top-of-funnel lead generation engine at the bottom of the market 8. As self-serve users engage deeply with the product, they generate behavioral data.
High product usage, growing team sizes, or attempts to access gated enterprise features automatically trigger Product-Qualified Leads (PQLs) 89.
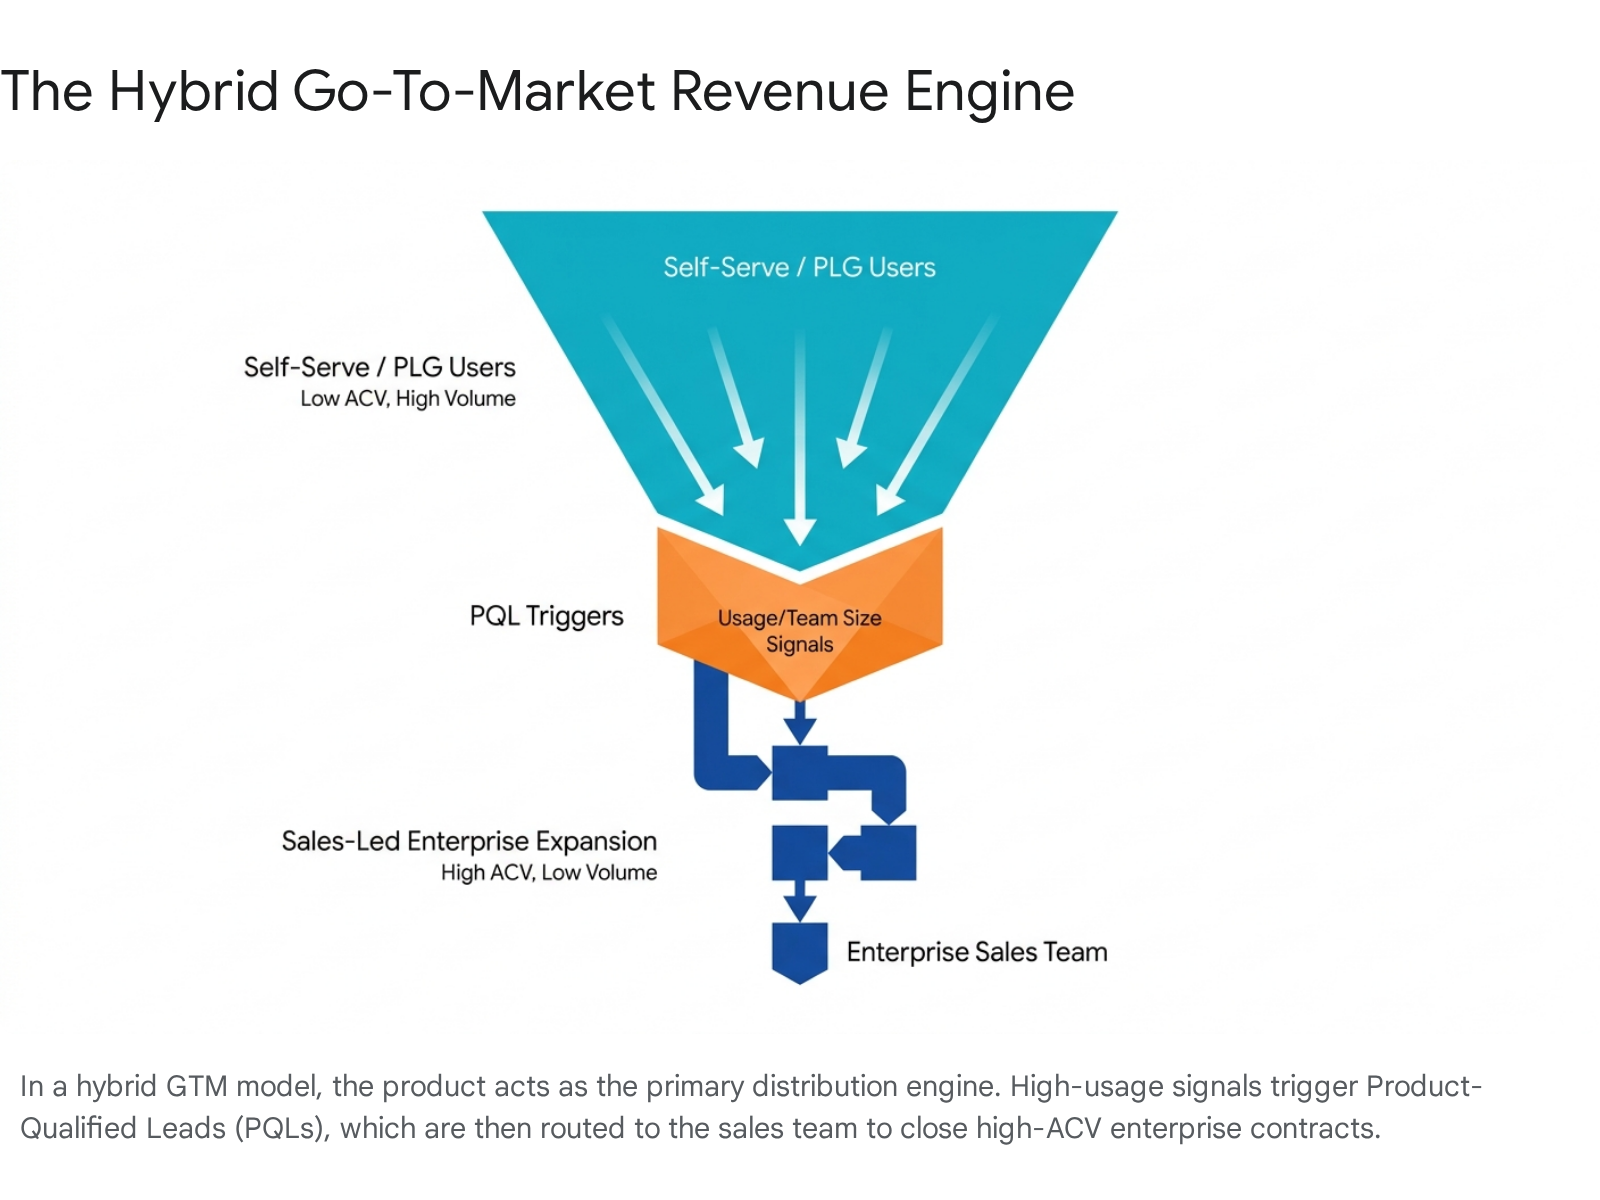
These PQLs are then routed to an internal sales team for expansion, upselling, and enterprise contract negotiation. Data from SaaS benchmarks reveals that PQLs convert to paid enterprise contracts at two to three times the rate of traditional marketing-qualified leads (MQLs) 8. Implementing a hybrid model requires strict organizational discipline; companies must establish clear rules of engagement to prevent direct sales teams from cannibalizing the self-serve revenue channel 9. When executed correctly, the synergistic approach yields extraordinary results; operational data from leading SaaS platforms indicates that migrating a customer from a self-serve PLG tier to a sales-assisted enterprise tier can yield up to an 11x lift in customer lifetime value (LTV) 18.
Capital Structures and Financial Efficiency
The timeline, methodology, and ultimate probability of reaching $1M ARR are heavily influenced by the company's capital structure. The fundamental divide in the software industry exists between venture-backed companies operating on external equity and bootstrapped companies reliant on organic cash flow and debt.
Venture Capital Funding Dynamics
The traditional venture capital (VC) playbook demands aggressive early spending to capture market share rapidly, operating under the assumption that recurring software revenue will eventually yield massive profit margins at scale 11. Consequently, equity-backed SaaS companies operate with high structural burn rates. Benchmarking data from 2025 indicates that the median equity-backed company spends 107% of its ARR on operational costs, meaning it operates continuously at a net loss 10. Specifically, only 46% of equity-backed SaaS businesses manage to operate at or near breakeven 10.
Venture-backed entities spend significantly more across all departmental categories compared to their independently funded peers. Operational data reveals that equity-backed companies spend 100% more on marketing, 89% more on sales, 80% more on general and administrative (G&A) costs, and 71% more on research and development 10. This high capital consumption is intended to fuel the aforementioned T2D3 trajectory 6. When these companies hit $1M ARR and seek to raise a Series A round, they face intense scrutiny; investors expect to see an annualized growth rate of at least 200% to 300% (2x to 3x) alongside clear proof of a scalable sales engine 17. The average Series A round in the US commands $15M to $20M in capital, though AI-native companies are frequently raising over $40M at this stage due to intense capital concentration in the sector 211.
Bootstrapped Software Development and Micro-SaaS
In stark contrast, bootstrapped startups optimize for immediate sustainability, profitability, and extreme capital efficiency. The underlying cost structure of software development has plummeted due to scalable cloud infrastructure and, more recently, artificial intelligence coding assistants 11. A small team of two to three individuals can now build, launch, and scale a niche vertical SaaS product using a fraction of the capital required a decade ago, sometimes launching with as little as $15,000 to $30,000 in upfront investment 11.
Bootstrapped companies generally achieve $1M ARR at a slightly slower pace - reporting a median growth rate of 23% in recent years compared to 25% for equity-backed peers - but they do so with vastly superior unit economics 12. The total median spend across all departments for a bootstrapped company is 95% of ARR, and an impressive 85% of these companies operate within two percentage points of breakeven or are fully profitable 10. By retaining full equity ownership and avoiding the aggressive growth mandates of venture capital, bootstrapped founders can target smaller, highly specialized addressable markets that venture funds would routinely reject as insufficiently large to yield billion-dollar outcomes 11.
| Operational Spending Category | Bootstrapped Median Spend | Equity-Backed Median Spend | Market Difference |
|---|---|---|---|
| Total Operational Spend | 95% of ARR | 107% of ARR | VC-backed spend 12% more of total ARR |
| Sales Expenses | Baseline | 89% higher than bootstrapped | High |
| Marketing Expenses | Baseline | 100% higher than bootstrapped | Very High |
| R&D Expenses | Baseline | 71% higher than bootstrapped | High |
| G&A Expenses | Baseline | 80% higher than bootstrapped | High |
| Profitability Ratio | 85% operate at/near breakeven | 46% operate at/near breakeven | Bootstrapped significantly more profitable |
Data Source: SaaS Capital 2025 Private B2B SaaS Company Benchmarks 10. Exact percentage breakdowns by department vary based on scale, but the relative premium paid by equity-backed firms remains historically consistent.
Revenue-Based Financing and Alternative Capital
As capital markets tightened post-2022, early-stage companies reaching $10,000 to $50,000 in monthly recurring revenue (MRR) increasingly turned to alternative funding mechanisms. Revenue-Based Financing (RBF) allows startups to access non-dilutive capital by pledging a fixed percentage of future monthly revenues until a predetermined multiple is repaid 13. Because SaaS subscription revenues are highly predictable, underwriting processes are increasingly automated through direct integrations with billing platforms like Stripe or Chargebee, allowing lenders to deploy capital in days based on real-time metrics 13.
This serves as a vital financial bridge for companies navigating the final stretch to the $1M ARR threshold. It allows founders to fund targeted marketing initiatives and initial sales hires without surrendering founder equity or accepting punitive, down-round valuations in a hostile venture environment 13. The global RBF market for SaaS startups alone was valued at $4.12 billion in 2025, underscoring the rapid adoption of this capital mechanism among founders seeking to preserve operational control 13.
Standardized Metrics and Performance Benchmarks
Reaching $1M ARR is less about the absolute revenue dollar figure and more about the underlying quality and durability of that revenue. Institutional investors and sophisticated operators evaluate the health of an early-stage company through a rigorous framework of standardized SaaS metrics.
Revenue Growth Rate Deceleration
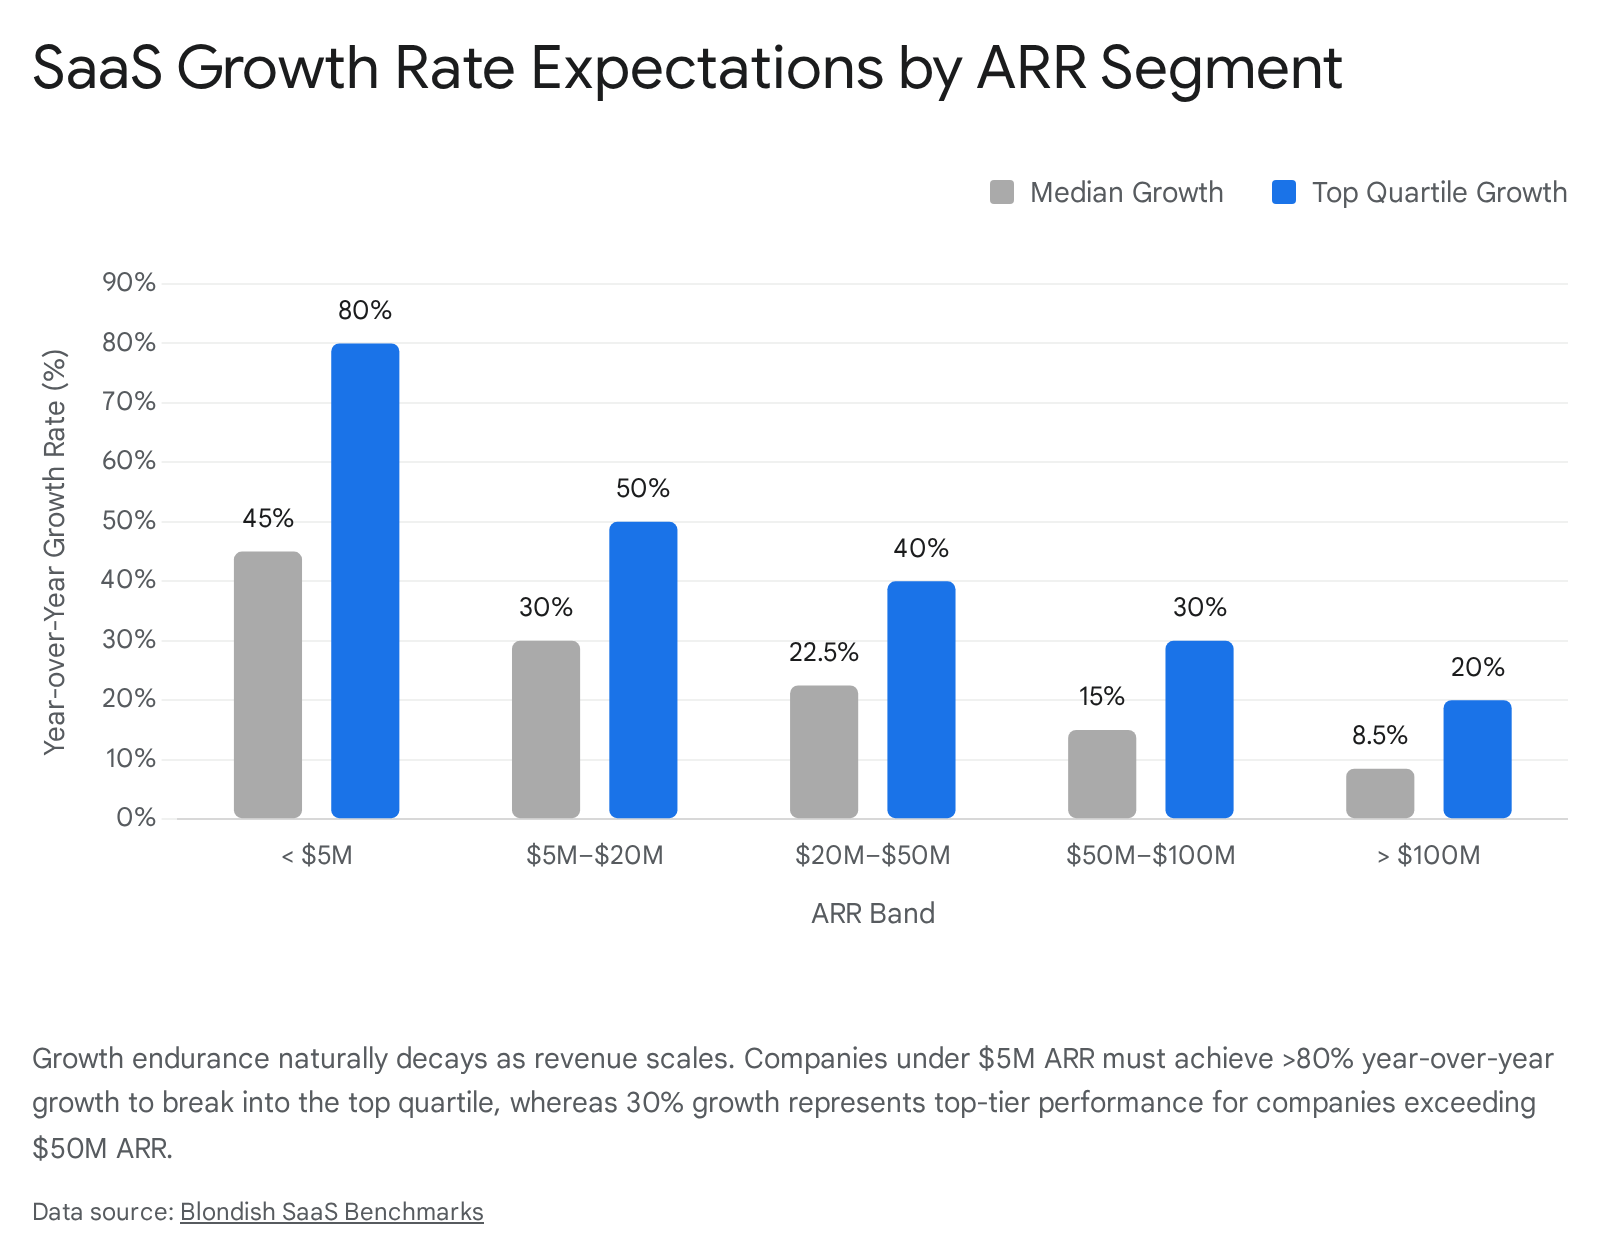
Growth rate expectations are entirely dependent on the scale of the company, and they naturally decay as the revenue base expands. A 25% year-over-year growth rate might be viewed as exceptional for a company with $50M ARR, but it is considered a severe warning sign of stagnation for a company crossing the $1M threshold 6.
For the broader population of private B2B SaaS companies across all sizes, the median growth rate settled at approximately 25% to 26% entering 2025, a noticeable deceleration from the 30% median observed in 2023 161424. Furthermore, 6.9% of surveyed software companies reported flat or negative growth 14. However, for early-stage companies navigating the <$5M ARR band, the baseline expectations are vastly different. In this cohort, the median growth rate sits between 40% and 50%, while top-quartile performers consistently exceed 80% to 100% YoY growth 16.
To triple ARR in a single year - a standard venture requirement at the early stage - a company must achieve compounded month-over-month (MoM) growth of roughly 11.6% 6.
Customer Acquisition Cost and Payback Periods
Customer Acquisition Cost (CAC) and the CAC Payback Period determine the capital efficiency and sustainability of a startup's growth. In 2024 and 2025, rising channel competition and massive talent inflation drove the median B2B SaaS company to spend $2.00 in sales and marketing to acquire just $1.00 of new ARR - a 14% efficiency decrease from previous years 11615. Structural factors, such as the fully loaded cost of executive marketing talent rising 54% since 2019, heavily contributed to this margin compression 1.
The CAC Payback Period - the number of months required to recover acquisition costs through the gross profit generated by a new customer - is the ultimate barometer of sustainable unit economics. Venture benchmarks set strict targets based on customer segments: payback should occur in under 12 months for small-to-medium business (SMB) customers, under 18 months for mid-market clients, and under 24 months for complex enterprise deals 26. While the industry median across all growth stages stretched to roughly 18 months, early-stage companies (those under $1M ARR) typically enjoy vastly shorter payback periods. Median payback for sub-$1M companies is often around two to eight months, largely because they rely heavily on organic channels, word-of-mouth, and founder-led networks before transitioning to expensive paid acquisition channels 261617.
Lifetime Value and Churn Mechanics
Customer retention is the foundational bedrock of software success; without it, high acquisition velocity merely fills a leaking bucket. High Gross Revenue Retention (GRR), which measures retained revenue without factoring in upsells or cross-sells, establishes a baseline of product stickiness. A healthy enterprise SaaS GRR benchmark sits at approximately 85% to 90%, with median companies hovering around 86% 11819. Companies falling below this threshold generally experience growth rates far below the population median, regardless of top-of-funnel sales efficiency 20.
However, Net Revenue Retention (NRR) - which factors in revenue expansion from upgrades minus downgrades and churn - is the primary engine for compounding growth. The median NRR for private SaaS companies has compressed to roughly 101% to 102%, indicating that expansion revenue is barely covering revenue lost to churn for the average software vendor 12418.
Achieving and scaling beyond $1M ARR is significantly easier when existing customers purchase more software over time. Industry data highlights that increasing NRR from the 90% range up to the 100-110% range improves a company's overall growth rate by five full percentage points 1220. Organizations boasting top-tier NRR rates (above 115%) report median growth rates that are 83% higher than the broader population, and they command substantially higher valuation multiples 122021. As companies mature, existing customers account for a massive proportion of revenue generation; expansion ARR represents roughly 40% of all new ARR across the industry, and over 50% for mature businesses exceeding $50M in scale 2415. Furthermore, investors require a ratio of Customer Lifetime Value to Customer Acquisition Cost (LTV:CAC) of at least 3:1 to fund growth confidently, ensuring the gross profit generated far outweighs the marketing expense 26.
Operational Spend and Headcount Ratios
The "Rule of 40" - a financial heuristic stating that a company's growth rate plus its profit margin should equal or exceed 40% - was historically applied only to mature, publicly traded SaaS companies. However, in the current capital-constrained market, early-stage investors are applying this rigorous heuristic to private startups as small as $1M to $5M ARR 11733. Analysis of over 800 SaaS companies revealed a stark divide: companies with high NRR and strong CAC payback achieve average Rule of 40 scores of 47%, while those with poor retention metrics score a mere 5% 17. In response, premium investors have evolved this metric into the "Rule of X," which places a heavier weighting multiplier on top-line growth while still demanding baseline profitability 121.
To hit these efficiency targets, startups must closely monitor headcount, which represents the single largest operating expense in any software business. ARR per full-time employee (FTE) is a critical gauge of operational leanness. While larger scaleups and public companies aim for $200,000 to $300,000 in ARR per employee, an early-stage startup crossing $1M ARR is expected to maintain highly optimized headcount distributions 162434. B2B software companies typically require 5 to 15 engineers plus a handful of early sales and marketing hires to reach the $1M mark 35. Conversely, consumer-facing (B2C) subscription apps lean heavily toward continuous product iteration, with engineering and design often comprising 50% of the total staff at the $1M milestone 35.
Artificial Intelligence and Structural Cost Compression
Perhaps the most significant structural shift in the modern software scaling playbook is the advent and mass integration of native artificial intelligence capabilities. In the 2024 - 2026 era, termed by analysts as the "Operation AI" cycle, artificial intelligence is no longer a marketing differentiator but foundational product infrastructure 222.
Integration as Baseline Infrastructure
Every single software company founded in 2025 that participated in major benchmark surveys reported using AI as core to its product architecture 222. Startups that deeply integrate AI into the core of their workflows are dramatically outperforming their peers. Benchmarking reports confirm that AI-native SaaS companies grow roughly twice as fast as companies offering legacy solutions or those that merely bolt superficial AI features onto existing legacy architectures 216. This performance gap is most pronounced in the exact cohort navigating the $0 to $5M ARR range, where deep AI differentiation drives 70% faster top-line growth 2.
This rapid growth is altering historical revenue generation benchmarks. While traditional B2B SaaS companies celebrate reaching $1M ARR in 12 months, the median enterprise AI company currently reaches over $2M in ARR within its first year 6. Consumer AI companies are scaling even faster, frequently reaching over $4M ARR within eight months of turning on monetization 6. However, this explosive growth requires managing complex new infrastructure constraints, such as token processing volumes, which for massive platforms can exceed quadrillions of tokens monthly 23.
Headcount Reductions and Solo Developer Operations
Beyond product features, AI is fundamentally altering the internal cost of execution. Tools that automate complex coding architectures, marketing content generation, and customer support triage allow one-person operations or microscopic teams to generate the output of a dozen traditional employees 38. The industry is witnessing a surge in highly profitable "micro-SaaS" businesses and solo developers utilizing AI agents to build, launch, and scale products to $1M+ ARR without hiring a single full-time employee 3839.
While solopreneur unicorns generating millions remain statistical outliers - representing roughly 2% to 3% of the solo founder population - the broader macroeconomic trend is undeniable 38. The average seed-stage startup team size has shrunk dramatically, falling from an average of 7 employees in 2020 down to just 3.5 employees in 2025 38. Furthermore, prominent startup accelerators report that up to 20% of their recent cohorts consisted of solo founders, a massive increase from historical norms 38. Over half of surveyed SaaS companies explicitly confirm that AI integration has directly spurred headcount reduction or permanently slowed their hiring velocity, allowing them to scale revenue without scaling human capital expenses 22.
Legal and Infrastructure Risk Profiles
The aggressive deployment of AI to reach $1M ARR introduces unique risk profiles that early-stage companies must mitigate. AI models that process personal user data or train on proprietary datasets without explicit consent create severe privacy risks under frameworks like GDPR, CCPA, and HIPAA 40. Furthermore, "hallucination liability" - where an AI generates false or damaging outputs that a business client relies upon - flows directly into a startup's Errors and Omissions (E&O) exposure 40. Claims do not require the model to have been negligently built; they only require that the customer suffered a financial loss 40. Consequently, AI-native startups face highly variable cyber liability and E&O insurance premiums, heavily dependent on their headcount and the exact scope of their autonomous agents 40.
Pricing Models and Revenue Capture
The speed at which a startup achieves $1M ARR is intrinsically linked to its pricing architecture. Pricing is widely considered the most underutilized lever for growth, often yielding far higher margin returns than customer acquisition efforts.
Subscription Billing Complexity
Early-stage startups must select from several distinct pricing models, each carrying different operational complexities. The simplest model is "Flat-Rate Pricing," characterized by a single fixed price for the entire software platform, regardless of usage 41. This abstracts complexity, lowers CAC by accelerating the sales cycle, and provides absolute revenue predictability, but it fails to capture upside from heavy users 41.
Alternatively, "Per-User" (or seat-based) billing ties revenue directly to the customer's headcount, facilitating predictable land-and-expand strategies that drive Net Revenue Retention 41. "Usage-Based" billing models charge customers strictly based on consumption metrics (e.g., gigabytes stored, API calls made), which lowers the barrier to entry but makes revenue forecasting highly volatile 42.
B2B organizations generally enjoy a structural advantage in achieving $1M ARR due to sheer pricing magnitude. Data indicates that B2B Average Revenue Per User (ARPU) is typically 10 to 50 times higher than B2C ARPU 35. Consequently, B2B companies typically reach $1M ARR in 18 to 30 months, while B2C companies require 24 to 48 months to accumulate the massive user volume necessary to offset their low price points 35.
The Impact of Pricing on Net Revenue Retention
Optimizing pricing yields disproportionate financial results. Implementing a marginal 5% price increase across a customer base acts as a purely margin-accretive action; the entirety of the newly generated revenue flows directly to gross profit and EBITDA, requiring zero additional sales and marketing spend 41. Consulting data suggests that comprehensive pricing optimization projects yield an average 32% increase in the revenue growth rate 41.
In the consumer and low-ACV SaaS space, monetization strategies are shifting away from rigid paywalls toward the "gamification" of pricing. Instead of forcing an immediate transaction, modern applications build continuous "play loops" where usage delivers value, habits form, and upgrades happen naturally at organic friction points 15. Despite this trend toward gamified value delivery, empirical data shows that enforcing "hard paywalls" early in the user journey remains vastly superior for direct revenue capture, converting at 10.7% compared to freemium's 2.1% 15.
Geographic Variations in Scaling Software
While Silicon Valley historically dominated software benchmarking, the globalization of engineering talent and remote-first work cultures has decentralized SaaS growth. Analyzing the path to $1M ARR requires an understanding of geographic nuances, capital availability, and regional pricing power.
North American and European Markets
North America continues to control approximately 45% to 46% of the global SaaS revenue share and dominates venture capital deployment across all stages 1011. Seed rounds in the US routinely average $2M to $3M, providing startups with significant operational runway to experiment, fail, and iterate before hitting the $1M ARR milestone 11. Conversely, European markets prioritize capital efficiency far earlier in the company lifecycle. European seed rounds skew smaller - averaging $1M to $2M - and local investors demand clearer margin structures, tighter unit economics, and faster paths to profitability from day one 11.
Market Expansion in Asia-Pacific and India
The Asia-Pacific (APAC) region, specifically India and Southeast Asia, is experiencing explosive SaaS growth, driven largely by the massive digitization of millions of micro, small, and medium enterprises (MSMEs) 24. Indian SaaS revenues, for example, have surged dramatically, crossing $15 billion in actual realized revenue by FY24 and growing at a 24% compound annual growth rate (CAGR) 2144.
Indian and Southeast Asian SaaS founders operate with a distinct structural advantage regarding capital efficiency. Lower domestic infrastructure costs and access to high-quality, highly cost-effective engineering talent allow these firms to price their software aggressively in global markets while maintaining robust gross margins - often in the 70% to 85% range 2144. Consequently, the Indian SaaS cohort is, as a collective ecosystem, already profitable, boasting average EBITDA margins of 6.5% 21.
Because early-stage risk capital is comparatively scarce in the region - with local pre-seed and seed rounds clustering tightly around $500K to $1.5M - startups are forced to optimize cash flow immediately 11. They cannot rely on multiple bridge rounds to figure out product-market fit. To scale to $1M ARR rapidly under these constraints, Indian and Southeast Asian startups build global-first distribution models from inception. They frequently target US, UK, or European enterprise customers to drive up their ARPU, while keeping their operational cost centers firmly anchored in local, lower-cost economies 1144. Major venture funds, such as Peak XV Partners (formerly Sequoia Capital India & SEA), have deployed billions in specialized regional funds to capitalize on this unique dynamic, backing AI, fintech, and enterprise software startups capable of penetrating Western markets with localized cost advantages 2526.
| Geographic Region | Average Seed Round Size | Primary GTM Characteristics to reach $1M ARR | Market Focus |
|---|---|---|---|
| North America | $2M - $3M | Higher early cash burn allowed, rapid scaling, high CAC. | Domestic & Global |
| Europe | $1M - $2M | Capital efficient, margin-focused early execution. | Regional & Global |
| India / APAC | $500K - $1.5M | Extreme capital efficiency, global-first sales, structural cost advantages. | Cross-border (US/EU) & MSME |
Data Source: Startup funding statistics and regional venture capital deployment averages, 2025-2026 1144.
Conclusion
Navigating a software startup from inception to one million dollars in annual recurring revenue is a multifaceted operational challenge that requires founders to continuously evolve their strategies. The broader market no longer rewards unconstrained, inefficient hypergrowth fueled by heavily dilutive venture capital. Instead, the modern blueprint for reaching $1M ARR demands disciplined capital efficiency, defined by strong unit economics, rapid customer acquisition cost payback periods, and high net revenue retention.
Successful early-stage companies systematically define an uncomfortably narrow ideal customer profile and leverage relentless, founder-led outbound sales motions to secure initial market traction. As revenue approaches the $1M threshold, operations must necessarily pivot toward repeatable, scalable go-to-market strategies - either through low-friction product-led growth for low-ACV tools, targeted enterprise sales for complex implementations, or a synergistic hybrid of both.
Furthermore, the mandatory integration of artificial intelligence is fundamentally rewriting the timeline to success. AI enables significantly leaner teams to build more sophisticated products, automate back-office operations, and scale revenues faster than at any point in the history of the software industry. Coupled with a diverse array of funding options - from traditional venture capital to non-dilutive revenue-based financing - founders possess more leverage than ever to dictate their growth trajectory. By mastering these core mechanics of customer acquisition, pricing psychology, and operational leanness, founders can build resilient, highly valued businesses perfectly equipped to scale well beyond their first million dollars in revenue.