How to Read Prediction Markets Without Being Fooled
Prediction markets offer real-time, financially backed probabilities that frequently outpace traditional opinion polls and punditry, but they are not infallible crystal balls. To read a prediction market accurately, observers must treat implied odds as dynamic, crowd-sourced signals while accounting for structural biases, low-liquidity distortions, and the fundamental difference between a probability and a guaranteed outcome.
The Rise of the "Truth Machine"
In January 2026, an anonymous trader on the cryptocurrency-based prediction market Polymarket wagered $34,000 that Venezuelan President Nicolás Maduro would be captured. Days later, U.S. special forces carried out the highly classified operation. The trader netted over $400,000 1. The U.S. Congress and the American public were completely in the dark, yet an individual sitting behind a screen on a betting platform had enough private conviction - and likely access to non-public information - to risk real capital. The market had priced in a reality before the news ever broke 1.
Incidents like this, alongside the massive $3.6 billion in trading volume seen on Polymarket during the 2024 U.S. presidential election, have fueled a narrative that prediction markets act as global "truth machines" 12. The core premise rests on financial incentives: when people have "skin in the game," the financial penalty for being wrong destroys groupthink, ideology, and wishful thinking 12. Any forecasting system that fails to penalize inaccuracy is inevitably captured by career incentives or narrative momentum; prediction markets, however, demand that participants put their money where their mouths are 1.
The mechanism underlying these platforms is relatively straightforward. Prediction markets allow users to buy and sell binary event contracts tied to the outcome of future events. These range from presidential elections and central bank rate hikes to celebrity behavior and geopolitical developments. If an event occurs, the "Yes" contract pays out exactly $1.00; if it does not, the contract becomes worthless, paying $0.00. Therefore, if a "Yes" contract is currently trading at $0.60, the market is collectively assigning a 60% probability to that event occurring 23.
Because these prices update instantly with every new trade, media outlets, political campaigns, and financial institutions have increasingly begun citing these odds as real-time probability signals, presenting them alongside or even instead of traditional opinion polls 126. But these markets are human systems. They are subject to specific structural inefficiencies, psychological biases, and liquidity constraints that can severely distort the numbers 3. Reading a prediction market without being fooled requires an understanding of market microstructure, mathematical calibration, and human behavior.
Demystifying Brier Scores and Calibration
To understand if a prediction market is "right," researchers do not simply look at whether the favored outcome won. They look at calibration over thousands of events using a metric called the Brier score. A Brier score measures the mean squared difference between a predicted probability and the actual outcome, with 0.0 being a perfect score and numbers below 0.1 considered excellent 7.
For example, if a market predicts an event will happen with a 70% probability ($0.70) and the event occurs, the Brier score for that single event is $(0.70 - 1.00)^2 = 0.09$. If the market predicted a 90% probability, the score improves to $0.01$. If the event fails to happen, the score is $(0.70 - 0.00)^2 = 0.49$, heavily penalizing the market 7.
When analysts evaluated over 84,000 questions across major platforms like Polymarket, Kalshi, Manifold, and Metaculus, they found that highly liquid prediction markets exhibit extraordinary calibration. Polymarket's overall historical Brier score sits at an impressive 0.047, placing it on par with the best statistical prediction models in existence 1. In highly liquid markets with over $1 million in trading volume, Brier scores reached an astonishing 0.0159 just a day prior to an event's resolution 7.
If a perfectly calibrated market prices an event at 70%, that exact scenario should occur roughly 70 times out of 100 89. This also means the outcome will not happen 30 times out of 100. When a 30% underdog wins, the market was not necessarily "wrong" or "fooled"; rather, the less likely statistical scenario simply materialized in that specific instance 8.
Evaluating Prediction Markets vs. Opinion Polls
The debate over whether prediction markets are "better" than traditional polls often relies on a faulty premise. As researchers note, comparing the two is like asking whether a thermometer is better than a blood pressure cuff - they are entirely different instruments designed to measure entirely different phenomena 10.
Opinion polls are diagnostic tools. They survey a specific sample of people to capture a static snapshot of current sentiment, answering the question: What do people believe today? 6. Prediction markets, conversely, are forward-looking. They answer the question: What is the probability of a specific outcome occurring in the future? 4.
The Track Record of Market Accuracy
When forecasting the probability of binary outcomes, markets generally hold a measurable edge, particularly when an event is far in the future. A peer-reviewed study analyzing data from the Iowa Electronic Markets (IEM) - a real-money academic forecasting exchange operated since 1988 - found that prediction markets outperformed 74% of contemporaneous opinion polls at forecasting final election vote shares 10. This advantage was most pronounced more than 100 days before Election Day, a period when traditional polls are information-poor and highly volatile 10.
This outperformance was highly visible during the 2024 European parliamentary elections. An analysis of order book data from 2014 to 2024 revealed that markets generally lead polls by incorporating news faster, achieving a mean absolute error (MAE) of 3.2% for market outcomes versus 4.1% for polls 12. The primary edge of the market was speed: prediction markets reacted to geopolitical events almost instantly, reducing forecast errors by 25% in high-volatility periods compared to polling aggregates, which can take days to update 12.
Similarly, during the 2024 UK general election, prediction markets remained highly calibrated despite noisy polling. The Labour party ultimately won a massive majority (412 seats) 56. Throughout the campaign, even when individual polls suggested tighter races or fluctuating sentiment, the continuous order book on Polymarket kept the probability of a Labour majority above 85% 5. On election night, final implied market probabilities matched outcomes within 2.5%, achieving a Brier score of 0.032 compared to the polling average's 0.058 7.
Tool Comparison Summary
To read these metrics effectively, one must understand where each forecasting method excels and where it suffers from inherent blind spots.
| Feature | Opinion Polls | Prediction Markets | Expert Forecasts |
|---|---|---|---|
| Core Measurement | Stated beliefs and behavioral intentions at a specific, frozen moment in time 6. | The crowd's implied probability of a future outcome based on capital allocation 10. | Synthesized models based on historical fundamentals, domain expertise, and heuristics. |
| Update Velocity | Slow. Requires days to field a survey, apply statistical weighting, and publish results 9. | Instantaneous. Reacts in real-time to breaking news, live debates, and unverified rumors 9. | Infrequent. Usually updated daily, weekly, or on an ad-hoc basis 9. |
| Participant Incentives | None. Respondents face no penalty for answering dishonestly or changing their minds 10. | Financial. Traders lose capital for being wrong and extract profit for being properly calibrated 9. | Reputational. Experts may hedge forecasts to protect their careers or align with institutional narratives 18. |
| Primary Blind Spots | "Response bias" (demographic skew) and an inability to accurately model who will actually turn out to vote 610. | Susceptible to low-liquidity manipulation, the favorite-longshot bias, and momentum-driven echo chambers 39. | Prone to "groupthink" and structurally slow to adapt to unprecedented, systemic outlier events 1. |
| Optimal Use Case | Diagnosing why a population is shifting and understanding granular demographic breakdowns 10. | Gauging the live probability of a specific, binary event occurring and reacting to breaking catalysts 10. | Cross-referencing baseline probabilities, providing qualitative context, and structural modeling. |
Despite their strengths, prediction markets cannot replace polls. They are incapable of explaining why public opinion is moving, which demographics are shifting, or what specific policy proposals are driving voter behavior 10. Furthermore, prediction markets do not magically solve the hardest problem in political polling: modeling turnout. Markets simply aggregate whatever the traders believe about turnout models, which may be no better or more scientifically rigorous than the assumptions made by professional pollsters 10.
The Confusion Between Probability and Vote Share
One of the most common ways casual observers are fooled by prediction markets is by conflating the probability of winning with the projected vote share or margin of victory.
If a market prices a political candidate at an 85% chance of winning, a casual news consumer might mistakenly interpret this to mean the candidate will win in an overwhelming 85-to-15 landslide. In reality, the underlying electoral race could be an agonizingly tight 51-to-49 split in the polls, but the market traders are highly confident (85% sure) that the candidate will squeak out that narrow 2-point victory 1011.
This misunderstanding has documented real-world consequences. Academic research analyzing voter behavior has shown that presenting the public with probabilistic forecasts rather than projected vote shares can actively confuse and demobilize the electorate 12. When voters see a 90% probability of victory on a forecasting model or betting market, they often assume the election is a foregone conclusion. Consequently, they may stay home, failing to realize that the underlying race might be decided by a few thousand votes 12.
When analyzing a prediction market number, it is critical to separate the likelihood of an event from the magnitude of the result. A 99% probability of a rate cut by a central bank does not mean rates will be cut by 99 basis points; it simply means the occurrence of a cut is nearly certain.
Structural Inefficiencies: Platform Divergence
It is tempting to view a prediction market price as a unified, objective mathematical truth. However, rigorous academic studies show that even the most high-profile, highly liquid markets are not perfectly efficient 4.
In a comprehensive analysis of the 2024 U.S. presidential election, researchers from Vanderbilt University tracked more than 2,500 political prediction markets across four major platforms: the Iowa Electronic Markets, Kalshi, PredictIt, and Polymarket, capturing over $2 billion in transaction volume 4. The study sought to determine whether these prices truly capture rational expectations and aggregate information efficiently.
The findings challenged the narrative of flawless market efficiency. While the markets generally predicted outcomes better than chance, accuracy varied wildly depending on the platform. PredictIt markets correctly predicted outcomes 93% of the time, while Kalshi hit 78%, and Polymarket lagged at 67% across all active markets analyzed 421.
Crucially, the researchers found that prices for the exact same contract diverged sharply across different exchanges 4. If prediction markets were perfectly efficient information aggregators, the price of "Will Candidate X Win?" should be virtually identical across the internet. Instead, daily price changes were weakly correlated, and massive arbitrage opportunities - where a trader could theoretically guarantee risk-free profit by betting opposing sides on different platforms - persisted for weeks leading up to Election Day 4.
These platform divergences suggest that market prices are heavily influenced by the specific demographics of a platform's user base, local regulatory caps, fee structures, and the behavior of automated trading algorithms 3413.
Comparing Platform Mechanics
Understanding where you are reading a prediction market price is just as important as reading the price itself. Different platforms attract different participants under varying rule sets, which warps the implied probabilities.
- Polymarket: A cryptocurrency-based platform built on blockchain technology. It features immense liquidity (billions in volume for major elections) and operates globally, though it geoblocks U.S. retail users (a rule bypassed by some via VPNs). It utilizes Automated Market Makers (AMMs) and charges relatively low fees (roughly 2%), making it highly attractive to algorithmic traders and "whales" placing massive bets 513.
- Kalshi: A U.S.-regulated platform overseen by the Commodity Futures Trading Commission (CFTC). Because it is fully integrated into the U.S. financial system, it requires standard KYC (Know Your Customer) compliance. It trades in fiat USD and offers event contracts on elections, economic indicators, and cultural events. Its prices often reflect the sentiment of a strictly American, financially vetted user base 823.
- PredictIt: An experimental academic market operated under a "no-action" letter from the CFTC. It enforces strict caps on how much money a single user can wager on a specific contract (traditionally $850). This cap prevents "whales" from manipulating the market but also limits the ability of highly informed traders to correct mispricing, sometimes leading to distorted probabilities that linger 112.
- Betfair Exchange: A traditional peer-to-peer betting exchange popular in the UK. It features a traditional Central Limit Order Book (CLOB). However, Betfair charges a 2% to 5% commission on winnings. This fee structure creates friction, widening bid-ask spreads and mechanically altering the implied probabilities, particularly for longshot bets 713.
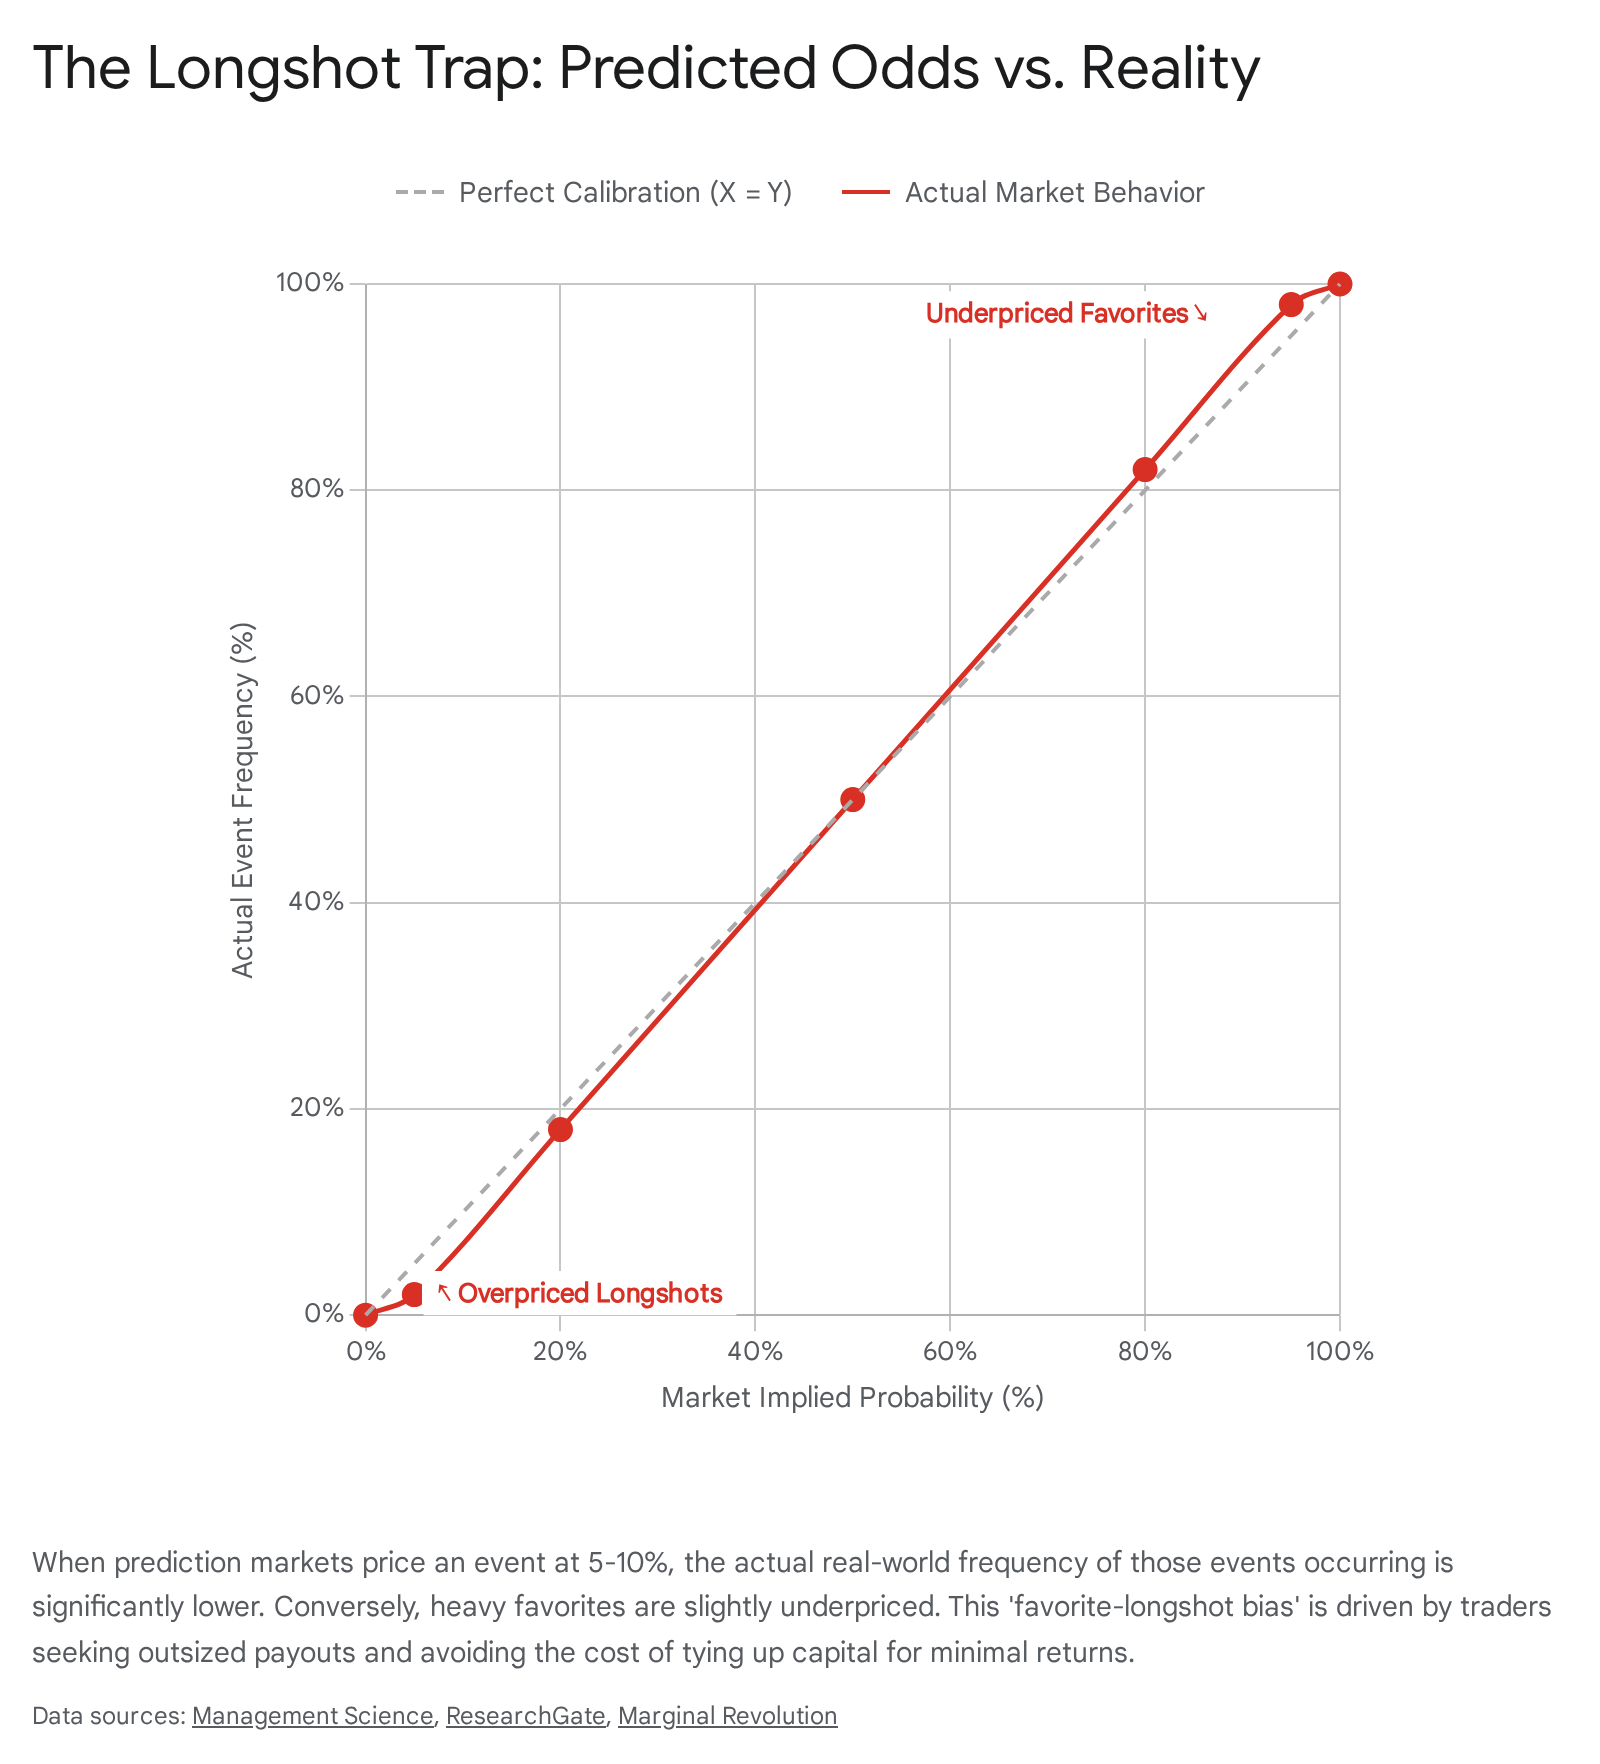
The Favorite-Longshot Bias: Why 5% Doesn't Mean 5%
If a contract on a prediction market is trading at $0.05, it implies a 5% chance of the event happening. In a perfectly efficient market, events priced at 5% should happen exactly 5% of the time. In reality, across almost all betting and prediction markets, they happen far less frequently.
This pervasive phenomenon is known as the favorite-longshot bias. It is a structural inefficiency originally documented in parimutuel horse racing in 1949, but it is deeply ingrained in modern financial and prediction markets 141516. In short, gamblers and traders consistently overvalue highly unlikely events (longshots) and slightly undervalue highly probable events (favorites) 16.
If you see a fringe outcome trading at 3%, 4%, or 5%, do not automatically assume there is a legitimate chance it happens based on hidden insider information. Most of the time, that price is an artifact of market mechanics and human psychology - it is "dumb money" chasing a lottery ticket 1527.
There are three primary reasons this bias exists:
- The Cost of Capital: Tying up investment capital for months to win a 5% return on a 95% favorite is fundamentally unattractive to most retail traders and even some institutions. To justify the opportunity cost and the risk of a black swan event, traders demand higher required rates of return on safe bets. This suppresses the price of the favorite, which naturally props up the implied probability of the longshot 1428.
- Contrast Effects and Payload Allure: Humans are generally poor at intuitively grasping the difference between a 2% chance and a 5% chance of success. Instead of analyzing the statistical probability, traders focus on the payout dimension. Buying a 2-cent contract that pays out $1.00 looks like an incredible 50-to-1 asymmetric risk-to-reward ratio. This visual contrast in payoffs enhances the attractiveness of longshots, causing traders to bid up the price of "foolish" bets far beyond their actual mathematical likelihood 1527.
- Platform Fees on Winnings: On platforms that charge commission fees specifically on winnings, the mathematics of expected value severely punish high-probability bets. The fee structure effectively caps how low a longshot's price can realistically drop, creating an artificial floor that makes the event look more probable than it actually is 1328.
When reading a market, any contract trading below 10% should be viewed with extreme skepticism. It is highly likely that the "true" probability of that event occurring is closer to 1% or 2%, heavily distorted by retail traders looking for a thrilling payout.
The Liquidity Illusion: Does Volume Equal Truth?
If prediction markets rely on the "wisdom of the crowd," what happens to the truth when there is no crowd?
Liquidity refers to how easily a participant can buy or sell shares without significantly moving the market price. In a highly liquid market - such as the U.S. presidential election where billions of dollars converge on a single question - the price is remarkably stable. It takes massive capital deployment to shift the probability by even a single percentage point 19.
In a "thin" or low-liquidity market - such as predicting a minor regional election, a niche legislative bill, or an obscure pop-culture event - the mechanics break down. In these environments, the bid-ask spread (the gap between the highest price a buyer is willing to pay and the lowest price a seller will accept) widens drastically 2930. A single user executing a $500 market order could instantly swing the implied probability by 15 to 20 points 929.
When analyzing a prediction market number, checking the liquidity and total open interest is a mandatory first step. A market displaying an 85% probability means absolutely nothing if the total trading volume is only $430 2. In those instances, the price reflects individual guesswork rather than collective wisdom, rendering it highly vulnerable to algorithmic manipulation and false signals 3929.
Information-Driven vs. Attention-Driven Volume
However, high liquidity does not automatically guarantee market truth. It is crucial for observers to distinguish between information-driven volume and attention-driven volume 9.
- Information-driven volume: A market asking whether a central bank will cut interest rates experiences a massive spike in trading volume immediately following the release of a hotter-than-expected inflation report. In this scenario, market participants are rapidly updating their priors and adjusting prices based on verifiable, real-world data 923.
- Attention-driven volume: A pop-culture market regarding a celebrity baby name, or a market forecasting an unverified political rumor, suddenly goes viral on social media. Thousands of retail traders rush to the platform to buy shares based on the same loud rumor. The price moves rapidly, and trading volume spikes into the millions, but no actual new factual evidence has been introduced 9.
As one market analyst observed regarding highly liquid yet volatile markets: "When the price looks stable, people stop asking basic questions like 'What changed?'... If the price moved because the internet got loud, that's one thing. If it moved because something actually changed in the world, that's another" 9. A busy market often feels like a definitive verdict, but if the volume is powered by synchronized attention rather than verified facts, the crowd can be entirely wrong.
The Role of Automated Market Makers (AMMs)
To solve the chicken-and-egg problem of liquidity - where informed traders will not participate without uninformed traders to profit from - many modern platforms utilize Automated Market Makers (AMMs) 317.
Rather than relying on a traditional order book where buyers must be perfectly matched with sellers, AMMs act as an algorithmic counterparty. Using mathematical formulas, such as the Logarithmic Market Scoring Rule (LMSR), the AMM automatically adjusts the price of a contract based on its current inventory and demand 2917.
While AMMs guarantee that you can always execute a trade, they are controlled by a "liquidity parameter" set by platform administrators. If this parameter is set too low, the market is excessively sensitive, and a $10 bet can swing the odds by 25%. If it is set too high, the market becomes sluggish, failing to update adequately when new information arises 29. Observers must recognize that on AMM-driven platforms, short-term price movements are sometimes dictated more by the algorithm's mathematical curve than by a fundamental shift in real-world probabilities.
Insider Trading, Misinformation, and Oracle Risk
Beyond liquidity constraints, structural inefficiencies plague prediction markets in ways that traditional equity markets generally avoid.
Unlike the U.S. Securities and Exchange Commission (SEC), which strictly enforces prohibitions against insider trading in the stock market, prediction market regulations often operate in a gray area regarding non-public information 3. In many contexts, a corporate executive could legally bet on their own company's upcoming product launch, an athlete could bet on their own undisclosed injury status, or a political staffer could wager on a highly classified operation 13.
While proponents argue that insider trading makes prediction markets the most accurate barometers of truth - because the price fully incorporates hidden knowledge - it also means retail participants are frequently playing a rigged game against opponents who already know the future 3.
Furthermore, low-liquidity niche markets are uniquely susceptible to coordinated misinformation campaigns. During the 2020 U.S. presidential election cycle, persistent and exploitable price anomalies existed in prediction markets due to market participants acting on fabricated social media rumors. When misinformation enters a thin market, it is not always corrected quickly, especially if enough capital backs the false narrative 3.
The Threat of Oracle Risk
Perhaps the most critical, yet overlooked, aspect of reading a prediction market is understanding "Oracle risk" - the mechanism by which a market is ultimately resolved and settled 23.
Every event contract is a legal and operational document bound by a specific "rules page." A contract asking "Will Candidate X Win?" might not be resolved by an election-night concession or television network projections; it may be strictly tied to official government certification occurring weeks later 9.
If observers only look at the headline price and ignore the resolution criteria, they are fundamentally misreading the market. Badly worded contracts create settlement disputes, and if the designated "Oracle" (the data source used to determine the outcome) is ambiguous, the market price will reflect the legal uncertainty of the payout rather than the likelihood of the real-world event 823.
Integrating Signals: The Hybrid Approach
Given the respective strengths and weaknesses of opinion polls and prediction markets, the most sophisticated forecasters do not choose one over the other. Instead, they utilize ensemble models that combine both signals to reduce overall forecast error 18.
Research analyzing the 2015-2019 UK elections demonstrated that combining forecasting signals - specifically assigning a 0.6 weight to prediction market prices and a 0.4 weight to high-quality MRP (Multi-level Regression and Poststratification) polling aggregates - reduced the Root Mean Square Error (RMSE) by 15% and Brier scores by 12% compared to using either method as a standalone metric 7.
In practice, artificial intelligence models and quantitative analysts use polling data to establish baseline structural fundamentals, while using prediction markets to track real-time volatility, test emerging signals against real-world expectations, and capture the impact of late-breaking news 8.
5 Rules for Calibrated Market Reading
To separate the true signals from speculative noise, treat prediction market prices not as infallible guarantees, but as unique data points requiring context. Follow these five rules to avoid being fooled:
- Check the volume and liquidity first. If the total trading volume is low (e.g., under $50,000), discard the percentage completely. Thin markets reflect individual guesswork and algorithmic noise, not the wisdom of the crowd 91229.
- Read the exact resolution criteria. Prediction markets settle based on hyper-specific rules, not general media narratives. If you do not understand the rules page and the designated Oracle source, you cannot accurately interpret what the price represents 9923.
- Discount extreme longshots. Due to the mathematically proven favorite-longshot bias, an event priced at 3% or 5% is overwhelmingly likely to be an artifact of platform fees or lottery-ticket psychology. It rarely indicates a hidden "smart money" signal 1527.
- Beware of sudden, catalyst-free price movements. If a market swings wildly but there is no corresponding real-world news or data release, a "whale" deploying massive capital or a coordinated social media rumor may be artificially pushing the price. Treat sharp moves without obvious catalysts as suspect until confirmed by broader reporting 92318.
- Remember that 80% is not 100%. A perfectly calibrated prediction market that prices an event at 80% means that the event will happen 8 times out of 10. Crucially, it also means the event will not happen 2 times out of 10. If an 80% favorite loses, the market was not necessarily "wrong" or manipulated - the mathematically expected 20% scenario simply materialized 18.
Bottom line
Prediction markets are incredibly powerful tools for aggregating dispersed information, reacting to volatile news cycles instantly, and putting a precise mathematical price on the future. They punish ideological posturing and wishful thinking by forcing participants to back their beliefs with real capital, frequently outperforming static opinion polls in the process. However, they remain highly susceptible to low-liquidity distortions, the psychological draw of longshot bets, and speculative attention masquerading as data. To read a prediction market effectively, observers must look past the headline percentage, investigate the market's underlying mechanics, and remember that an implied probability is a measure of risk, not a guarantee of destiny.