How the Power Grid Handles a Summer Peak Hour by Hour
During a summer peak, extreme heat simultaneously drives air conditioning demand to its maximum while physically degrading the grid's infrastructure and its ability to generate and transmit power. The most critical, high-risk hours occur in the early evening when solar generation rapidly disappears, forcing operators to deploy fast-ramping batteries, gas peaker plants, and emergency demand response to prevent cascading blackouts.
The Physics of Extreme Heat on the Power Grid
When a prolonged heat dome settles over a region, the electric grid is assaulted from two directions simultaneously: skyrocketing consumer demand and deteriorating infrastructure efficiency. As millions of residents and businesses crank up their air conditioning to combat triple-digit temperatures, overall electricity consumption surges. Air conditioning accounts for approximately 18% of annual household electricity consumption in the United States, but during a summer heat wave, cooling loads utterly dominate the grid's capacity 1. During humid summer months, HVAC systems must work even harder to remove moisture from the air, drawing immense, sustained power 1.
However, the surge in consumer demand is only half the equation. Extreme heat physically throttles the efficiency of power generation, transmission, and distribution. The electric grid operates according to the fundamental laws of thermodynamics and electromagnetism, both of which are severely hindered by high ambient temperatures. Natural gas combustion turbines, for example, rely on pulling in ambient air, compressing it, mixing it with fuel, and igniting it. Because hot air is less dense than cold air, the turbine draws in less oxygen per cycle. Consequently, natural gas turbines can become up to 25% less efficient in hot weather, generating significantly fewer megawatts exactly when they are needed most 1.
Thermal power plants - including traditional coal, natural gas combined-cycle, and nuclear facilities - rely on vast amounts of water for cooling their massive steam cycles. As ambient temperatures rise, the water in nearby rivers, lakes, and cooling ponds also warms 12. Because these thermal plants rely on the temperature differential between the steam and the cooling water to generate power efficiently, hot cooling water drastically reduces their thermodynamic efficiency. Furthermore, many plants are forced to reduce their total power output during heat waves simply to comply with environmental regulations that strictly limit the temperature of the water they are legally allowed to discharge back into natural waterways 2.
The transmission and distribution system suffers equally under extreme heat. The physical act of moving high-voltage electricity creates heat. When the conductive materials in overhead power lines are subjected to the ambient heat of the summer sun combined with the immense internal electrical current flowing through them, their molecules vibrate more intensely 1. This microscopic vibration creates electrical resistance, which disrupts the flow of electrons and results in a higher loss of energy as it travels from the power plant to the city 12.
Furthermore, this intense heat causes the metal transmission cables to physically expand and sag. If power lines sag too close to the ground, underlying vegetation, or other structures, the electricity can arc, triggering catastrophic wildfires or localized short circuits. To prevent this, grid operators calculate thermal limits for every line. On the hottest days, they are routinely forced to deliberately reduce the amount of power flowing through major transmission corridors, creating severe transmission bottlenecks that trap cheap power in remote areas and force cities to rely on expensive local generators 2.
Even solar panels, which are crucial for meeting summer power demands, suffer efficiency drops when surface temperatures soar. Photovoltaic cells operate less efficiently at high temperatures because heat degrades the semiconductor's ability to convert photons into electrical current 12.
The Evolution of the Peak: The Duck Curve Phenomenon
Modern power grids no longer face a simple, uniform swell of afternoon demand. The widespread adoption of utility-scale solar farms and rooftop photovoltaic panels has fundamentally altered the daily load profile, creating an operational challenge that energy economists refer to as the "Duck Curve."
The Duck Curve illustrates the widening, precarious gap between the total electricity demanded by consumers (referred to as "gross load") and the demand that must be met by dispatchable, non-solar power plants (referred to as "net load") 35. Because solar power is essentially free to generate once the panels are installed, grid operators always prioritize it. Whatever demand solar cannot meet becomes the "net load," which must be supplied by natural gas, coal, nuclear, hydro, or battery storage.
As states like California and Texas have added tens of thousands of megawatts of solar capacity, the midday net load has plummeted, creating the deep "belly" of the duck 54. However, as the sun sets, that solar generation vanishes completely in a matter of hours. This vanishing act coincides precisely with the time people return home from work, turn on their televisions, cook dinner, and turn down their thermostats, keeping gross demand incredibly high. The resulting "neck" of the duck represents a massive, sudden spike in net load that must be filled instantly by other resources 5. Managing this steep evening ramp is the single greatest operational challenge of the modern summer grid.
Hour-by-Hour: The Lifecycle of a Summer Peak Day
Understanding the true nature of a grid emergency requires analyzing a summer peak day not as a single event, but as a sequence of distinct operational phases, each with its own risks and mitigation strategies.
Morning (6:00 AM - 12:00 PM): The Ramp Up and Solar Abundance
As the sun rises and the daily temperature begins its climb, businesses open and industrial facilities begin their operations. Gross electricity demand rises steadily. However, this is also when solar panels begin generating power. By 9:00 AM, the rapid increase in solar generation typically outpaces the rise in consumer demand 5.
Grid operators use this morning window to prepare for the afternoon. If a severe heat wave is forecasted, operators like PJM Interconnection (the nation's largest grid operator, covering 13 Eastern and Midwestern states) will have already issued a "Hot Weather Alert" days in advance 6. This alert forces transmission and generation owners to cancel any scheduled maintenance or testing, ensuring that every possible power plant and power line is physically available for dispatch 910. During the morning, operators closely monitor weather patterns, cloud cover, and wind speeds, as any sudden change in cloud cover could abruptly reduce solar output and force them to rely on backup generators earlier than anticipated.
Midday (12:00 PM - 4:00 PM): The Trough and The Recharge
Between noon and 4:00 PM, the sun is at its highest angle, and solar generation reaches its absolute daily maximum. In solar-heavy grids like the California Independent System Operator (CAISO) or the Electric Reliability Council of Texas (ERCOT), massive amounts of cheap, zero-carbon solar energy flood the system 1112.
During these hours, the grid often experiences a glut of power, driving wholesale electricity prices to zero or even into negative territory. In recent years, CAISO has routinely seen periods during sunny days where renewables supply 100% of the state's electricity demand 12.
To prevent the grid from becoming overloaded with excess supply, utility-scale lithium-ion batteries spend these hours eagerly absorbing the solar energy. In 2023, battery charging represented roughly 8.3% of the total load in the CAISO balancing area during peak solar hours 78. This strategic charging is an absolute necessity; it effectively banks millions of kilowatt-hours of midday sunshine for the impending evening crisis. Without batteries acting as a massive sponge, grid operators would be forced to curtail (turn off) thousands of megawatts of clean solar energy simply because there would be nowhere for it to go 8.
Late Afternoon (4:00 PM - 6:00 PM): The Gross Peak
Between 4:00 PM and 6:00 PM, the ambient outdoor temperature generally hits its daily maximum. Buildings, asphalt, and concrete have been soaking up solar radiation all day, forcing commercial chillers and residential HVAC systems to run continuously just to maintain indoor temperatures 1.
This window is typically when the grid experiences its "gross peak" - the absolute highest volume of electricity flowing through the wires. During historic heat waves, the numbers are staggering. In the summer of 2006, PJM recorded an all-time peak of 165,563 MW 910. More recently, during an intense heat wave in June 2025, PJM demand reached 162,401 MW 10. In New England, the ISO-NE grid operator anticipates extreme summer peaks to push toward 26,383 MW 1711.
Despite the immense strain on the system during these hours, grid operators are usually able to manage the gross peak effectively because solar farms are still producing a highly meaningful amount of power, buffering the demand 11.
Early Evening (6:00 PM - 9:00 PM): The Net Peak and the Ramping Crisis
The most dangerous and volatile hours for the modern electric grid occur between 6:00 PM and 9:00 PM. As the sun drops toward the horizon, solar generation rapidly vanishes. Within a span of three hours, a grid like CAISO might lose upwards of 15,000 MW of solar supply. Yet, electricity demand remains stubbornly high. People return home from work, turn on lights, operate electric ovens, plug in electric vehicles, and leave their air conditioners running to combat the lingering heat 5712.
This dynamic creates the steep "neck" of the Duck Curve. Grid operators must rapidly inject massive amounts of power into the system to replace the vanishing solar megawatts, a process known as "ramping" 5. Historically, this massive ramping requirement was handled almost exclusively by activating fleets of flexible natural gas power plants 12.
Today, utility-scale battery storage has emerged as the hero of the evening ramp. By discharging the solar energy they absorbed at noon, batteries act as a direct, instant substitute for fossil fuels.

In CAISO, battery performance over recent summers has been unprecedented. As battery fleets have expanded past 11,200 MW of active capacity, they have fundamentally reshaped grid operations 7. On March 29, 2026, CAISO data revealed battery output exceeding an astonishing 12 GW during peak demand hours, effectively managing the duck curve in real time and dramatically reducing the need to fire up legacy gas plants 5. On average, during the high-stress hours of 5:00 PM to 9:00 PM, batteries now routinely provide over 5.6% of the entire California grid's energy 78.
In ERCOT, a similar dynamic unfolded on August 20, 2024. The Texas grid hit a record peak demand at 6:00 PM, but demand remained dangerously high into the evening. By 8:00 PM, solar generation had essentially hit zero. In years past, this would have triggered immediate conservation alerts and severe grid instability. Instead, ERCOT's 9,300+ MW battery fleet stepped in, discharging a record 9.1 GWh of energy and peaking at 3.4 GW right at 8:00 PM, successfully navigating the state through the net peak without a single emergency alert 1113.
Nighttime (9:00 PM - 6:00 AM): Grid Recovery and Reset
By 10:00 PM, ambient temperatures finally begin to cool, and residential electricity use declines as people go to sleep and turn off appliances. The grid enters a recovery phase. Natural gas and coal plants restock fuel and perform minor operational adjustments. Battery systems slowly begin to recharge, taking advantage of lower off-peak prices. In regions like Texas and the Midwest, the nighttime hours are often accompanied by a surge in wind power, which blows most consistently after dark, providing cheap, clean energy to charge batteries and supply baseload power 21314. Critically, the nighttime hours also allow the physical infrastructure - specifically transformers and overhead transmission lines - to shed the heat they accumulated throughout the day, preventing catastrophic mechanical failures 2.
The Physics of Grid Collapse: Voltage and Frequency
To truly understand why grid operators sweat over a few thousand megawatts during the evening ramp, one must understand the stringent technical limits of alternating current (AC) power grids. Unlike a municipal water system that can store excess product in a water tower, the electric grid has virtually no inherent physical inertia to store electricity. Supply and demand must be matched perfectly, second by second, across millions of miles of wire 1222.
This delicate balance is measured and maintained by two primary electrical metrics: frequency and voltage.
The 60 Hertz Heartbeat
In North America, the entire grid operates at a strict alternating current frequency of 60.00 Hertz (Hz) 2324. Frequency is the ultimate indicator of the balance between supply and demand. If consumer demand exactly matches the output of all power plants, the grid maintains a perfect 60 Hz.
When a summer heat wave causes demand to spike suddenly - or if a large power plant unexpectedly breaks down - demand instantly exceeds supply. Because the grid cannot conjure electricity out of nowhere, it physically pulls kinetic energy from the massive, heavy spinning rotors of traditional power plants to make up the difference. This parasitic drag physically slows the turbines down, causing the system frequency to drop below 60 Hz 15.
Grid operators must correct this imbalance within seconds by dispatching "regulating reserves." If the frequency drops too far - often just to 59.5 Hz or lower - the heavy machinery at power plants is subjected to intense mechanical stress. To protect themselves from vibrating apart or sustaining catastrophic damage, power plants are programmed with automatic relays that will forcefully disconnect the plant from the grid if frequency drops below specific thresholds 241516.
This creates a terrifying domino effect: the loss of one plant drops the frequency further, which trips more plants offline, which drops the frequency further. If operators cannot shed demand fast enough to arrest the fall, the entire interconnection will collapse into a system-wide blackout within seconds.
The Localized Threat of Voltage Collapse
While frequency is a universal metric shared across an entire interconnect, voltage is localized. Voltage is essentially the electrical "pressure" pushing the current through the wires.
During a summer peak, heavy air conditioning loads present a unique problem. Air conditioners rely on induction motors, which require massive amounts of "reactive power" to generate the magnetic fields needed to spin the motor 15. Reactive power sloshes back and forth in the AC circuit but does not perform actual work. When thousands of AC units demand reactive power simultaneously, it causes the local voltage on the grid to sag heavily 15.
If voltage drops too low, electrical equipment overheats, motors stall, and transmission lines can trip offline 27. Unlike real power (megawatts), reactive power cannot be transmitted over long distances; it must be generated locally 15. Grid operators manage this by utilizing local capacitors, transformer tap changers, and increasingly, the advanced power inverters attached to solar arrays and battery systems to artificially inject reactive power and prop up sagging voltages before a local collapse occurs 152717.
The Hardware: Peaker Plants vs. Battery Storage
When demand spikes and grid frequency threatens to dip, grid operators must deploy "operating reserves." However, not all power plants are created equal. The speed at which a generator can increase its output to meet a sudden spike in demand is known as its "ramp rate," usually measured in megawatts per minute 29.
Historically, large coal and nuclear power plants served as the foundation of the grid's baseload. While they produce massive, continuous amounts of energy, they are entirely inflexible. A traditional coal plant can take anywhere from 12 to 24 hours to transition from a cold, offline state to full power 2931. Even when fully operational, a coal plant can typically only adjust its output by a sluggish 2 to 4 MW per minute 2932. Nuclear power plants are similarly inflexible; they require 12 to 24 hours to start up and generally run at 100% capacity around the clock, unaffected by hour-by-hour demand shifts 29.
Because coal and nuclear plants cannot react fast enough to handle the steep evening ramp of the Duck Curve, grid operators have traditionally relied on natural gas "peaker" plants.
The Era of Gas Peakers
Peaker plants are designed specifically to operate for only a few hours a day, springing to life when demand is at its highest. The most common peakers utilize "aeroderivative" gas turbines 18. These are quite literally commercial jet engines (like the GE LM2500 or LM6000) that have been bolted to the ground, attached to a generator coil, and fueled by natural gas pipelines 18.
Because they are derived from aviation technology, they are incredibly responsive. An aeroderivative gas peaker can start from a cold state and reach maximum power in 5 to 20 minutes, boasting aggressive ramp rates of 20 to 50 MW per minute 2918. However, this flexibility comes at a steep cost. Peaker plants are highly inefficient compared to combined-cycle gas plants, expensive to operate, and emit high levels of localized air pollution 181920. Furthermore, they are disproportionately located near urban, low-income, or marginalized communities, raising significant environmental justice concerns regarding their emissions during hot, stagnant summer days 1920.
The Battery Storage Revolution
Today, utility-scale lithium-ion battery energy storage systems (BESS) are rapidly rendering gas peakers obsolete. Because batteries are solid-state electronics with no moving mechanical parts, their ramp rate is effectively instantaneous, measured in milliseconds rather than minutes 363721.
A battery system can swing from fully charging (absorbing excess solar power) to fully discharging (injecting power into the grid) instantly. This provides unparalleled frequency regulation and peak-shaving capabilities. In grid applications, batteries are more accurate and faster to respond to automated dispatch signals than any fossil fuel plant in existence 3637.
The following table summarizes the operational capabilities of the grid's primary hardware during a summer peak:
| Generation Technology | Typical Cold Start Time | Typical Ramp Rate (MW per minute) | Role During Summer Peak Operations |
|---|---|---|---|
| Lithium-Ion Battery | Milliseconds | Instantaneous | Unmatched frequency response; shifting midday solar to evening net-peak. |
| Gas Peaker (Aeroderivative) | 5 - 20 minutes | 20 - 50 MW/min | Rapid response to sudden drops in solar generation or sudden demand spikes. |
| Combined-Cycle Gas | 1 - 2 hours | 10 - 20 MW/min | Efficient, sustained intermediate power required throughout the entire evening. |
| Coal / Steam | 12 - 24 hours | 2 - 4 MW/min | Unchanging baseload; entirely unable to assist with sudden ramping needs. |
| Nuclear | 12+ hours | Near zero (inflexible) | Steady, zero-carbon baseload; unaffected by hour-by-hour demand changes. |
Note: Specific ramp rates and start times vary based on the physical size, age, and specific configuration of the generating unit 29313218.
The Economic Tipping Point of Storage
The transition from gas peakers to battery storage is not merely an environmental initiative; it is now driven by hard economics. The cost of lithium-ion technology has plummeted over the last decade, fundamentally rewriting the economics of grid balancing.
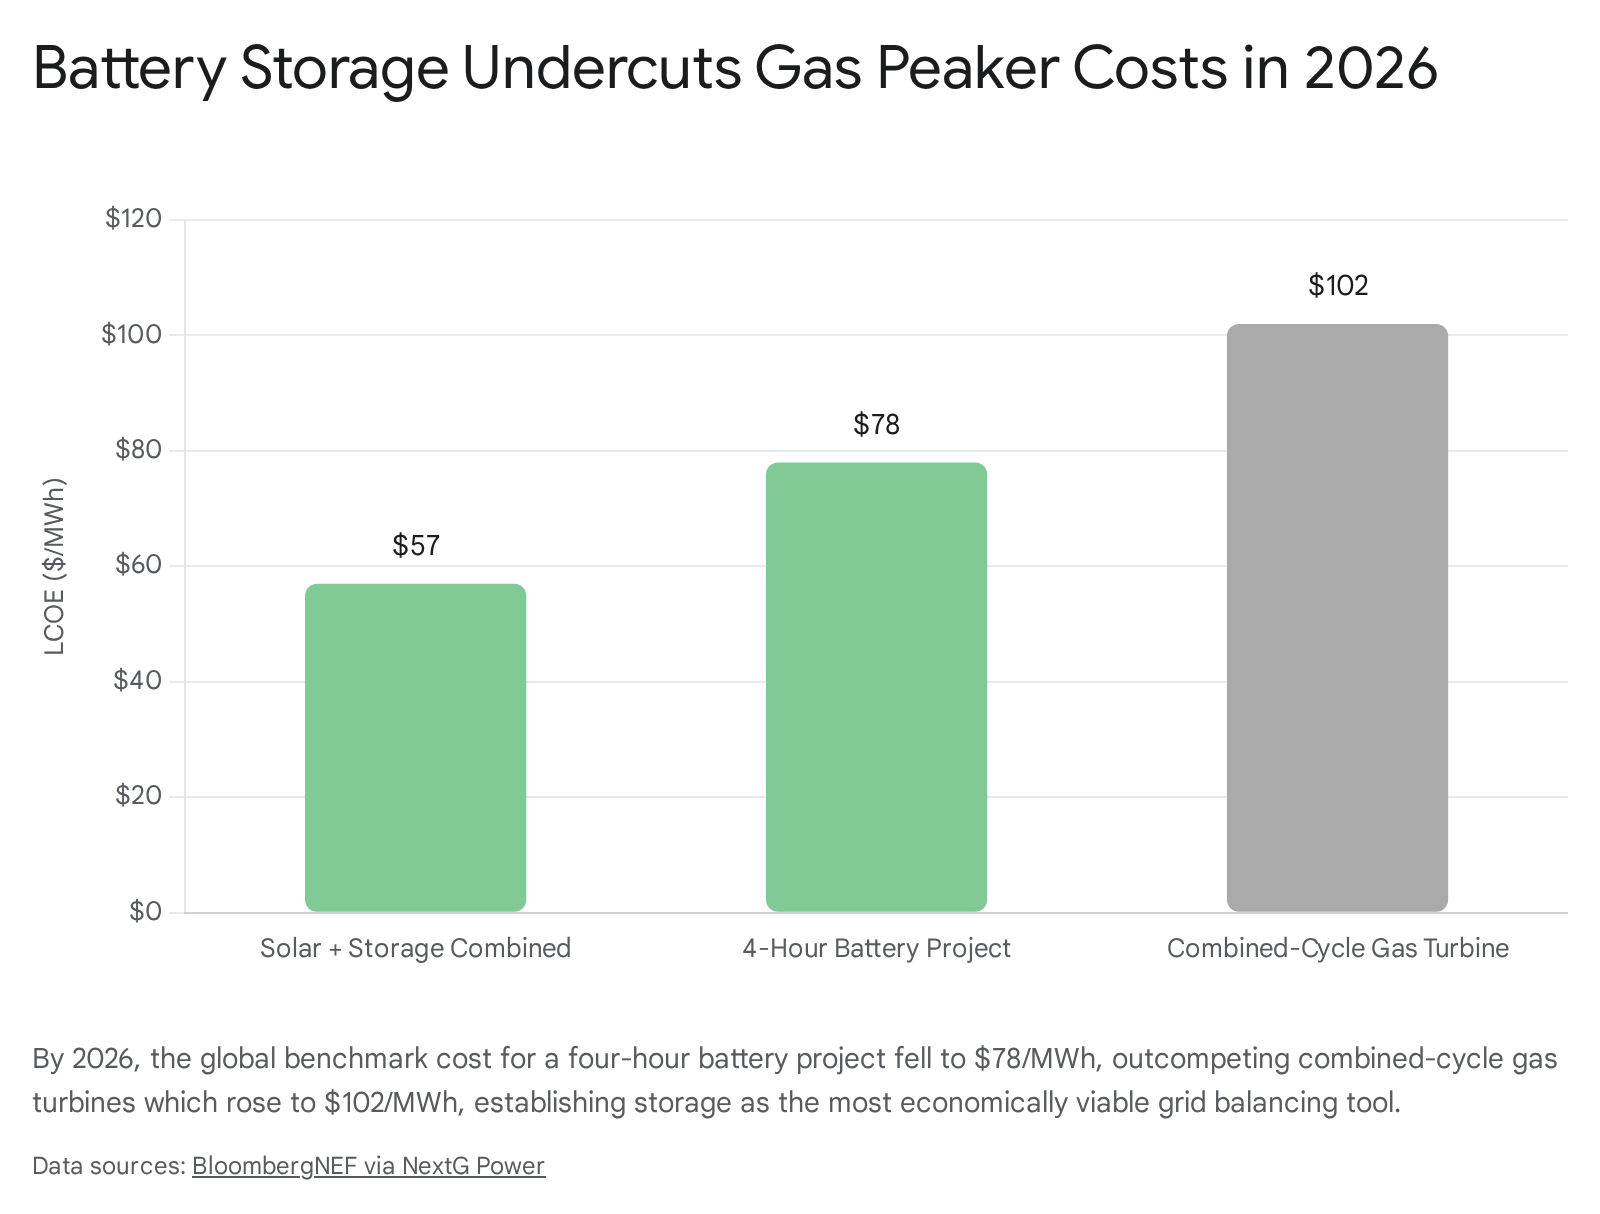
According to data from BloombergNEF, 2026 marked a definitive structural turning point. The global benchmark Levelized Cost of Electricity (LCOE) for a standalone four-hour battery project fell 27% year-over-year to a record low of $78/MWh 21. In stark contrast, the benchmark cost for combined-cycle gas turbines rose 16% to an all-time high of $102/MWh, while low-utilization gas peaker plants saw costs surge between $120 and $220/MWh 21.
This 30% to 50% lifecycle cost advantage, combined with millisecond response times and zero carbon emissions, establishes grid-scale energy storage as the default choice for meeting peak demand. This economic reality explains why regions like CAISO and ERCOT are adding gigawatts of battery storage while halting new gas peaker construction 1172021.
The Operator's Playbook: Managing the Brink of Collapse
Despite the addition of gigawatts of solar and battery storage, extreme heat waves can still exhaust all available resources. Grid operators plan for this by continuously tracking their "Reserve Margin" - the amount of expected unused generating capacity available at the time of peak load 22.
The North American Electric Reliability Corporation (NERC), the regulatory body that oversees grid reliability across the continent, generally targets a reference margin of roughly 15% to ensure a safe buffer against unexpected plant failures 22. However, in its 2024 and 2025 summer assessments, NERC warned that while most regions had adequate supplies for normal summer weather, several major operators faced elevated risks of supply shortfalls during extreme heat events 14222324. Surging demand from data centers and electrification, coupled with the retirement of older fossil-fuel plants, has squeezed reserve margins in MISO, ERCOT, and portions of New England 24.
When reserve margins dip below safe levels, grid operators do not immediately resort to blackouts. Instead, they initiate a highly choreographed, tiered sequence of emergency procedures known as Energy Emergency Alerts (EEAs) 1625. While the exact megawatt thresholds and procedural names differ slightly by region, the operational framework is standardized across North America.
Stage 1: Advisories and Weather Watches
Days before a heat wave strikes, grid operators issue early warnings. In PJM, this is known as a "Hot Weather Alert," issued when temperatures are forecasted to exceed 90°F with high humidity 610. In ERCOT, it is an "ERCOT Weather Watch" 43. During this phase, routine maintenance on power plants and transmission lines is strictly forbidden, ensuring that all available infrastructure remains operational.
Stage 2: Energy Emergency Alert Level 1 (EEA 1)
If the heat wave intensifies and operating reserves drop below a critical threshold (for example, below 2,500 MW in ERCOT), the operator declares an EEA 1 1625. This is the first true stage of emergency operations. The operator orders all available generation, including expensive, rarely used reserve plants, to start up and ramp to maximum output 1625. The grid operator will also attempt to import non-firm emergency power from neighboring interconnects, though during widespread heat waves, neighboring grids rarely have spare power to sell 1626. During EEA 1, operators also issue urgent public appeals, asking residents to voluntarily raise their thermostats and delay using major appliances 2543.
Stage 3: Energy Emergency Alert Level 2 (EEA 2)
If reserves continue to plummet (e.g., dropping below 2,000 MW in ERCOT), the operator declares an EEA 2 16. This is the final step before initiating blackouts. At this stage, operators deploy their most powerful mitigation tools:
- Demand Response: Instead of generating more power, operators pay consumers to use less. In markets like PJM, ISO-NE, and ERCOT, specialized aggregators (such as Enel or Logical Buildings) manage portfolios of large industrial consumers, commercial buildings, and thousands of residential smart thermostats 2746. When an EEA 2 is declared, these aggregators receive a dispatch signal. Industrial manufacturing is temporarily halted, massive cold-storage warehouses turn off their chillers (relying on thermal inertia to keep food cold), and residential AC units are automatically bumped up a few degrees 2746. In the summer of 2024, Enel's demand response resources were dispatched 411 times across North America, proving that the cheapest, fastest megawatt is the one that is never used 27.
- Voltage Reduction (Brownouts): As a desperate measure, operators can order a system-wide voltage reduction. In ISO-New England, this is mandated under Operating Procedure No. 4 (OP 4), which allows the operator to reduce normal operating voltage by 5% 282930. In PJM, a 5% voltage reduction instantly reduces the power flowing through the system by 1,700 to 2,000 MW 6. Because most modern electronics can handle a 5% drop in voltage seamlessly, the effects are virtually unnoticeable to residents, but the reduction in grid strain is massive 6.
Stage 4: Energy Emergency Alert Level 3 (EEA 3)
If all reserves are exhausted and grid frequency drops toward the point of physical collapse, the operator declares an EEA 3. At this stage, the operator has no choice but to order transmission utilities to shed load via "Controlled Outages," commonly known as rolling blackouts 1650. Utilities intentionally disconnect entire neighborhoods and commercial districts from the grid for 15 to 45 minutes at a time, rotating the outages to spread the burden and prevent the entire interconnect from suffering an uncontrolled, days-long blackout 50.
| NERC Emergency Stage | Typical Grid Condition | Primary Operator Actions and Mitigations |
|---|---|---|
| Advisory / Weather Watch | Heat wave forecasted several days in advance. | Issue Hot Weather Alerts. Cancel all planned maintenance on generators and transmission lines to keep all assets available 6943. |
| EEA Level 1 | Operating reserves drop below safe margins. | Force all available generation online. Import emergency power from neighboring grids. Issue public appeals for voluntary conservation 162543. |
| EEA Level 2 | Reserves reach critical lows. Last step before blackouts. | Trigger contracted Demand Response programs (halting industrial loads). Implement 5% Voltage Reductions (brownouts) to artificially shed load 6162829. |
| EEA Level 3 | Reserves completely exhausted. Frequency collapsing. | Order Controlled Outages (rolling blackouts). Utilities deliberately disconnect neighborhoods to save the wider electrical interconnect 164350. |
The Financial Fallout: Wholesale Spikes and Retail Pain
The strain of a summer peak is not merely a technical and engineering challenge; it is a massive financial event. In deregulated wholesale electricity markets, prices are determined dynamically based on supply and demand, and the price is set by the most expensive generator required to meet the final megawatt of demand 52.
During typical off-peak hours, cheap wind, solar, and nuclear power keep wholesale prices low, usually hovering between $25 and $60 per Megawatt-hour (MWh) 31. However, during a summer net peak, when operators must call upon the oldest, least efficient, and most expensive gas and oil peaker plants, prices skyrocket. In regions like ISO-New England and NYISO, summer peak prices routinely surge past $1,100/MWh 3154.
In Texas, the financial extremes are even more volatile. ERCOT relies entirely on an "energy-only" market model that utilizes an Operating Reserve Demand Curve (ORDC). When reserves run dangerously low, the ORDC artificially injects massive price adders to incentivize generators to come online. During late August heat waves in recent years, wholesale prices in ERCOT have frequently hit the market cap of nearly $5,000/MWh 33233. For independent generators and battery storage operators, these few hours of extreme pricing can account for a massive percentage of their annual revenue; in August 2024, some ERCOT batteries earned 30% of their entire monthly revenue in a single day of high volatility 33.
The Shift to Time-of-Use (TOU) Rates
To shield themselves from these crippling wholesale costs and to discourage consumption during the most dangerous hours, utility companies increasingly pass the financial burden to consumers via Time-of-Use (TOU) rates. TOU billing completely abandons the traditional flat-rate model, instead heavily penalizing electricity use during the exact hours the grid is stressed 3458.
Because peak grid hours vary depending on the local climate and the amount of solar on the grid, TOU rates vary significantly by region:
| Region / Utility Area | Typical Summer Peak Window | Pricing Dynamics |
|---|---|---|
| California (CAISO) | 4:00 PM - 9:00 PM | Driven by the Duck Curve. Peak rates can reach up to $0.74/kWh, which is 150% to 300% higher than off-peak rates, heavily penalizing evening AC use 34583560. |
| Texas (ERCOT) | 1:00 PM - 7:00 PM | Highly deregulated market. Retailers offer "Free Nights" (9 PM to 5 AM) to encourage overnight use, offset by steep peak charges in the afternoon 5835. |
| New York / New England | 11:00 AM - 6:00 PM | Varies heavily by utility (e.g., ConEd vs. National Grid). Peak rates can be 25% to 50% higher than off-peak. Tends to align with the hottest part of the traditional workday 583536. |
Under TOU structures, running a dryer or blasting the air conditioning at 6:00 PM costs vastly more than running them at 2:00 AM. This pricing mechanism essentially recruits consumers into becoming passive participants in demand response, incentivizing them to pre-cool their homes during the day or invest in smart thermostats and residential battery systems 313458.
The Cost of Failure: When the Power Goes Out
When the grid ultimately fails to meet demand and rolling blackouts occur, the economic damages to society are catastrophic. The modern economy is entirely dependent on reliable electricity. The U.S. Department of Energy estimates that power outages cost the broader American economy roughly $150 billion annually 3763.
A recent, comprehensive analysis by the Oak Ridge National Laboratory found that the direct cost of major outages to residential and commercial customers averaged $67 billion annually between 2018 and 2024 38. Alarmingly, the total annual burden rose sharply over that period, with the price tag of major outages climbing to a staggering $121 billion in 2024 alone, largely driven by extreme weather, heat waves, and hurricanes 38.
For commercial and industrial facilities, a sudden loss of power is devastating. It halts assembly lines, crashes servers, corrupts data, damages sensitive manufacturing machinery, and ruins temperature-sensitive inventory like pharmaceuticals and food 3763. For large industrial operators, a single hour of downtime during an outage can result in millions of dollars in losses 37.
Bottom line
A summer grid peak is no longer defined simply by the hottest hour of the afternoon, but by the critical transition period in the early evening when consumer demand remains high and solar energy disappears. To survive this daily "net peak" without suffering catastrophic voltage or frequency collapse, grid operators have rapidly shifted away from slow, polluting gas peaker plants, increasingly relying on the instantaneous response of utility-scale battery storage and automated demand response programs. While reserve margins remain tight in many parts of the country due to rising demand and retiring fossil-fuel capacity, the continued deployment of these flexible technologies is proving capable of averting blackouts, though consumers will increasingly bear the financial burden of grid reliability through steeper Time-of-Use rates.