How Many People Actually Meet Exercise Guidelines
Globally, nearly one-third of adults (31.3%) fail to meet the minimum threshold of 150 minutes of moderate-to-vigorous physical activity per week, translating to roughly 1.8 billion individuals worldwide who are putting their long-term health at risk. However, when researchers bypass subjective questionnaires and use objective wearable fitness trackers, the true rate of adherence plummets significantly lower, revealing that human beings drastically overestimate their daily movement. The modern medical community is now aggressively fighting this sedentary epidemic by emphasizing that every single minute of elevated heart rate - from gardening to carrying groceries - biologically counts toward the weekly goal.
Decoding the Global Standard for Human Movement
To accurately analyze how many people meet physical activity guidelines, it is first necessary to understand the precise demands of those benchmarks. Across the globe, major health organizations - including the World Health Organization (WHO), the U.S. Centers for Disease Control and Prevention (CDC), the American Heart Association (AHA), and the National Health Service (NHS) in the UK - have aligned on a remarkably consistent set of evidence-based recommendations for human movement 12345.
For the general adult population (typically defined as ages 18 to 64), the baseline cardiovascular requirement is 150 to 300 minutes of moderate-intensity aerobic physical activity per week 1567. Alternatively, adults can opt for 75 to 150 minutes of vigorous-intensity aerobic physical activity, or an equivalent combination of both moderate and vigorous exertion spread throughout the week 1245. A standard heuristic applied by public health officials is that one minute of vigorous-intensity activity is physiologically equivalent to roughly two minutes of moderate-intensity activity 8.
Crucially, cardiovascular exertion is only half of the equation. The guidelines universally mandate muscle-strengthening activities - often referred to as resistance training - that engage all major muscle groups (legs, hips, back, abdomen, chest, shoulders, and arms) on at least two days per week 12458. These strength-building exercises are required to maintain muscle mass, bone density, and metabolic health, yet they are frequently overlooked by the general public in favor of purely aerobic pursuits 7910.
The guidelines diverge slightly for different age demographics to account for distinct physiological needs. For children and adolescents (ages 6 to 17), the metabolic demands of growth and development necessitate a significantly higher volume of movement. The WHO and national health agencies recommend an average of at least 60 minutes of moderate-to-vigorous physical activity every single day 1511. Within this daily hour, vigorous-intensity aerobic activities, as well as exercises that explicitly strengthen muscle and bone (such as jumping or climbing), must be incorporated on at least three days per week 15.
Conversely, for older adults (ages 65 and older), the aerobic and muscle-strengthening requirements remain the same as for younger adults, provided their physical condition allows it. However, the guidelines for older adults add a critical third pillar: balance training. Older adults are advised to incorporate multicomponent physical activities that emphasize functional balance and strength on three or more days a week to enhance functional capacity and prevent falls 6712. Activities such as Tai Chi, yoga, or specific heel-to-toe walking exercises are highly recommended to fulfill this requirement 12. Furthermore, if older adults cannot perform the recommended amounts of physical activity due to chronic health conditions, the overarching guidance is simply to be as physically active as their abilities and conditions allow, avoiding total inactivity 12.
The Science of Metabolic Equivalents (METs)
To standardize what officially counts as "light," "moderate," or "vigorous" activity, exercise scientists and epidemiologists rely on a metric known as the Metabolic Equivalent of Task (MET). Energy expenditure during physical activity is expressed by multiples of this unit. One MET is defined as the exact ratio of the rate of energy expended during an activity to the rate of energy expended while sitting quietly at rest 111314. Therefore, a 1.0 MET activity is absolute baseline sedentary behavior, burning approximately 60 to 70 calories per hour for an average adult 14.
The classification of physical exertion scales upward from this baseline. Light-intensity activities require an energy expenditure of 1.6 to 2.9 METs. These are activities that burn more calories than sitting but do not significantly elevate the heart rate or breathing rate. Common examples include walking at a slow or leisurely pace (under 2 miles per hour), standing in line at a store, performing light household chores like dusting or preparing food, or washing dishes 7111314. While light-intensity activities do not fulfill the requirements for moderate-to-vigorous physical activity (MVPA), public health guidelines increasingly stress that replacing sedentary time with light-intensity movement offers independent metabolic benefits 157.
Moderate-intensity activities are defined as requiring 3.0 to 5.9 METs. At this level of exertion, a person is working hard enough to breathe heavier, raise their heart rate, and potentially break a sweat 811. A universally applied rule of thumb for relative intensity is the "talk test": an individual engaging in moderate-intensity aerobic activity can comfortably hold a conversation, but they would not have enough breath to sing the words to a song 4811. This category is vast and encompasses many everyday tasks beyond traditional sports. It includes walking briskly (2.5 to 4 miles per hour), recreational cycling on flat terrain, playing doubles tennis, pushing a lawnmower, sweeping floors, and engaging in active forms of yoga or ballroom dancing 14781113.
Vigorous-intensity activities demand 6.0 METs or greater. These activities push the cardiovascular system significantly harder, forcing the body to burn more than six times the energy it uses at rest 711. According to the talk test, an individual performing vigorous activity will be breathing hard and fast, unable to say more than a few words without pausing to draw a breath 4811. Examples of vigorous exertion include jogging or running, swimming continuous laps, cycling faster than 10 miles per hour or up steep hills, playing singles tennis, participating in competitive team sports like soccer or basketball, carrying heavy loads upstairs, or engaging in high-intensity interval training (HIIT) 14781113.
To further clarify the energy demands of routine life, researchers have extensively mapped the MET values of common household and occupational tasks. A comprehensive summary of these scientifically validated intensity levels reveals how seamlessly mandatory daily chores can transition into valid forms of exercise.
| Activity Category | Specific Activity Example | Scientific Intensity Level | Estimated MET Value |
|---|---|---|---|
| Sedentary / Resting | Sitting quietly, using a computer, watching television | Baseline | 1.0 - 1.5 71314 |
| Light Household / Self Care | Dusting, washing dishes, ironing, showering | Light | 1.6 - 2.5 1314 |
| Occupational (Light) | Desk work, light assembly line work, rapid typing | Light | 1.5 - 2.5 131314 |
| Moderate Household / Yard | Mopping, vacuuming, weeding, pushing a power mower | Moderate | 3.0 - 4.5 131314 |
| Active Transportation | Brisk walking (3 - 4 mph), leisurely cycling | Moderate | 3.3 - 5.9 141314 |
| Heavy Home Maintenance | Splitting wood, shoveling snow, carrying heavy boxes | Vigorous | 6.0 - 7.5 11131314 |
| Vigorous Sports / Exercise | Jogging, competitive football, swimming hard laps | Vigorous | 8.0 - 11.0+ 141314 |
The scientific mapping of these activities is highly specific. For example, a 2011 study published in HortScience meticulously tracked the heart rates and oxygen consumption of older adults performing 15 distinct gardening tasks to determine their exact exercise intensity 15. The researchers discovered a wide variance within the single hobby of gardening. Tasks requiring the active use of both the upper and lower body - such as digging (4.5 METs), applying fertilizer (4.0 METs), raking (3.4 METs), and weeding (3.4 METs) - qualified strictly as moderate-intensity physical activity 15. Conversely, tasks performed while standing or squatting with limited lower body movement, such as planting seedlings, mixing soil, or watering with a hose, registered as low-intensity activities (1.7 to 2.9 METs) 15. This level of physiological tracking underscores that the public does not need formal gym equipment to meet health guidelines, provided the everyday tasks they perform are genuinely demanding enough to breach the 3.0 MET threshold.
The Measurement Crisis: Why Self-Reported Data is Flawed
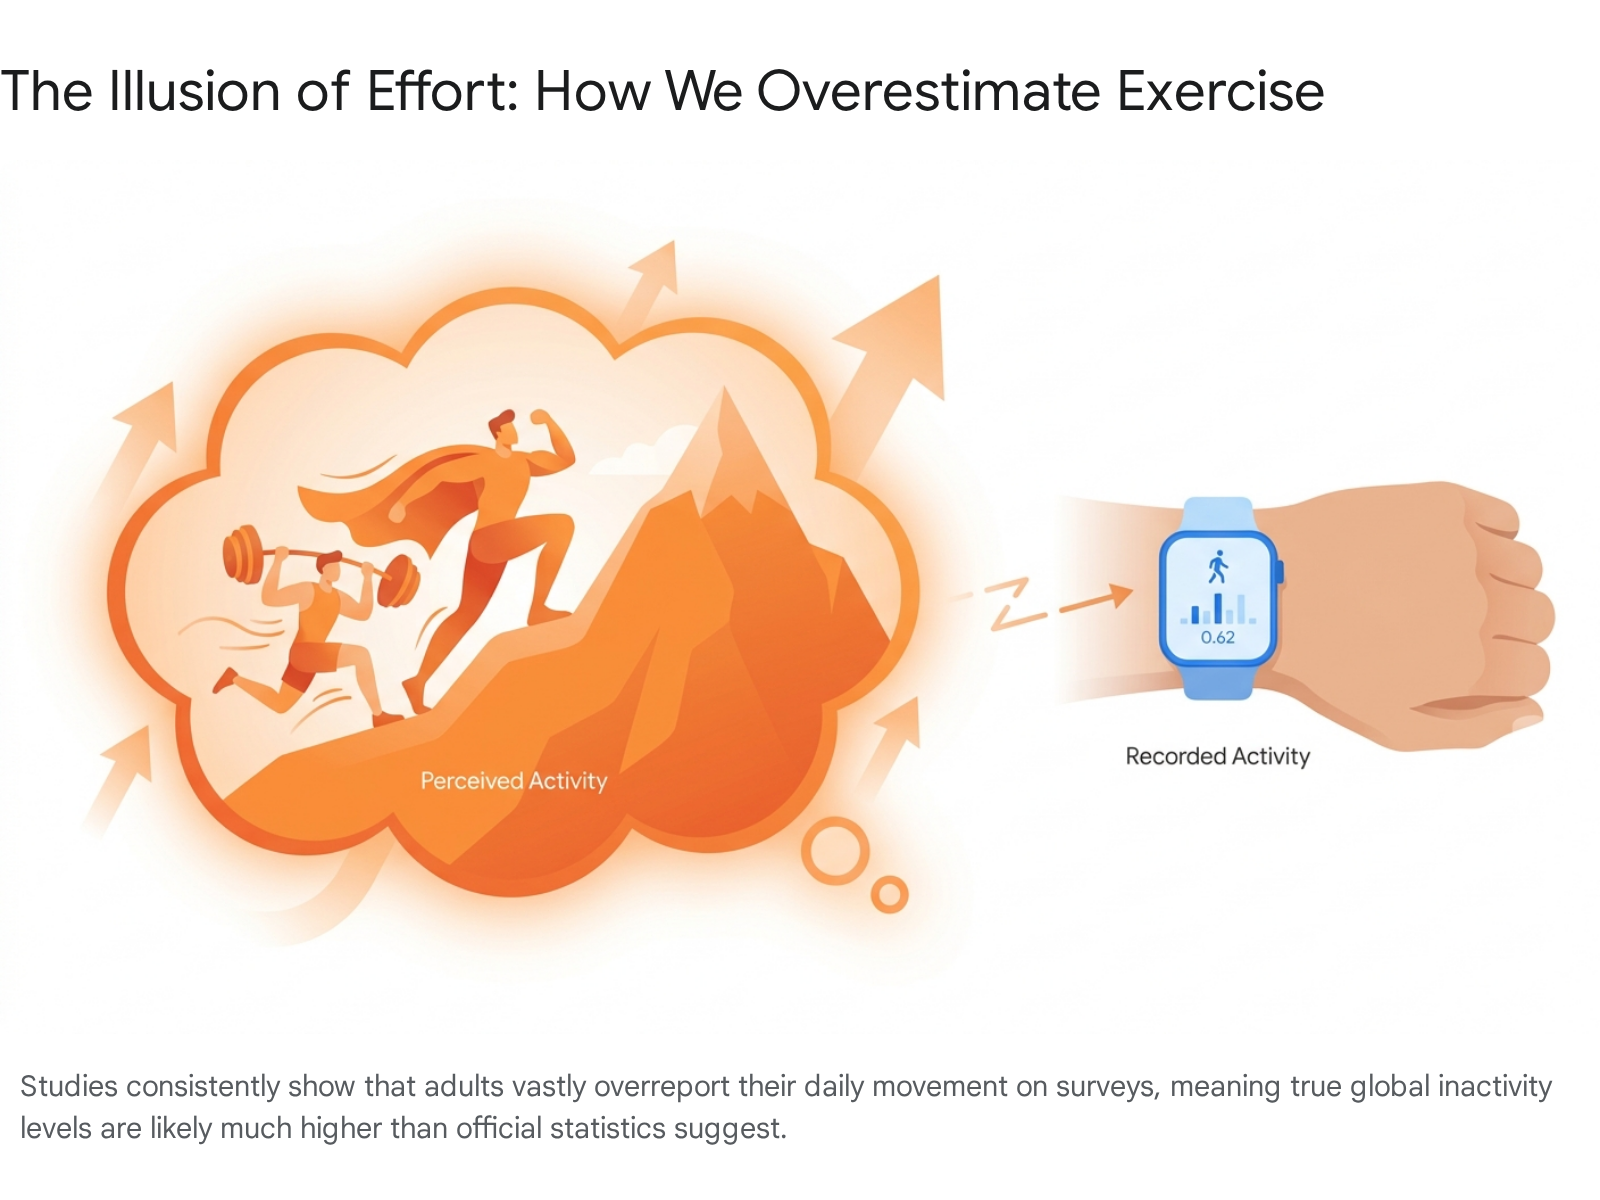
When reviewing statistics claiming that over 60% of adults in a given country meet physical activity guidelines, a profound epistemological caveat must be applied: the vast majority of national surveillance data is derived from self-reported surveys. In the fields of epidemiology and kinesiology, it is a well-documented and heavily researched phenomenon that human beings are remarkably inaccurate at recalling and quantifying their own physical exertion 16171819.
When researchers deploy objective measurement tools - specifically, wearable accelerometers like the ActiGraph or Fibion devices that track multi-axis movement over continuous days - and compare those readouts to the participants' own self-reported questionnaires (such as the International Physical Activity Questionnaire, or IPAQ), a massive measurement gap consistently emerges 16172021. The literature overwhelmingly demonstrates that people drastically overreport the duration and intensity of their physical activity while simultaneously underreporting the hours they spend engaged in sedentary behaviors 16192022.
A compelling 2023 study published in Applied Sciences investigated this discrepancy among healthcare professionals in Poland - a demographic that theoretically possesses a higher baseline understanding of health metrics. The study involved 153 female nurses, medical caregivers, and physiotherapists who first completed an expanded IPAQ survey and then wore an ActiGraph GT3X accelerometer for seven consecutive days 16. Based on their subjective questionnaire responses, an impressive 76% of the healthcare professionals claimed to meet the recommended guidelines for aerobic activity, self-reporting an average of 271 minutes of moderate-to-vigorous physical activity (MVPA) per week 16. However, the objective accelerometer data revealed a starkly different reality: only 44% of the participants actually met the guidelines, with the devices recording an average of just 158 minutes of MVPA per week 16. The researchers noted a "large effect size" in the discrepancy, highlighting that relying on self-reporting would severely distort the understanding of the population's actual cardiovascular health 16.
This illusion of effort is not isolated to specific professions or regions. A study of university students in South Africa revealed that while 83.3% of participants confidently reported high physical activity levels on their questionnaires, objective pedometer data indicated that 61.7% of them accumulated fewer than 1,500 aerobic steps per day, and over half recorded fewer than 5,000 total daily steps, an amount generally classified as a sedentary lifestyle 19. The statistical analysis found absolutely no significant correlation between what the students believed they were doing and what their pedometers recorded 19. Similarly, a 2024 validation study among young adults in the United Arab Emirates found only a weak association between self-reported IPAQ scores and Fibion accelerometer data, with researchers observing a clear proportional bias where the margin of error increased as activity levels fluctuated 21.
The underreporting of sedentary time is equally problematic for public health monitoring. A large-scale national study involving 1,751 adults ranging from 19 to 84 years of age compared IPAQ responses to ActiGraph data 20. The study found that men and women reported, on average, 131 fewer minutes of sedentary time per day than the accelerometers actually detected 20. That represents over two hours of daily sitting that vanishes entirely from survey data due to faulty human recall. Furthermore, while the male participants in the study self-reported engaging in 47% more MVPA than the female participants, the objective accelerometer data revealed no significant difference in actual movement between the sexes 20.
Interestingly, the nature of this reporting bias can shift depending on demographic factors. A comprehensive analysis by the New York City Department of Health and Mental Hygiene found that the direction of the error varied by age and gender 23. In their data set, older adults (aged 65 and older) tended to overreport their physical activity, ranking 6.1 percentage points higher on self-reports than on accelerometer measurements 23. Conversely, young adults (aged 18 to 24) actually underreported their activity, with self-reported minutes ranking 13.7 percentage points lower than the objective data captured 23. Males in this specific sample tended to underreport, while females overreported 23.
Why does this vast discrepancy exist? Kinesiologists attribute it primarily to recall bias and social desirability bias 19. Human memory is famously fallible, and it is incredibly difficult to accurately mentally tally scattered minutes of brisk walking or intermittent stair climbing over a seven-day period. Furthermore, because society heavily stigmatizes laziness and praises fitness, individuals unconsciously inflate their active minutes to align their self-image with the perceived societal ideal 19. They remember the 30-minute jog they took on Tuesday vividly, but they completely filter out the seven uninterrupted hours they spent immobilized in an office chair on Wednesday.
While accelerometers provide a much closer approximation of reality, they are not without their own limitations. Device-based measurements can sometimes fail to accurately capture upper-body movements, the added intensity of carrying heavy loads, or water-based activities like swimming where the devices must be removed 24. Furthermore, standard accelerometers cannot contextualize the domain of the activity - they record movement but cannot distinguish whether the user was engaging in occupational labor, active transportation, or leisure-time sports 24. Despite these minor blind spots, the consensus within the scientific community is clear: whenever possible, adult sedentary and physical activity measurements should be obtained objectively with accelerometers rather than relying on the severely flawed lens of self-reported questionnaires 1921.
Because the majority of global, national, and municipal public health surveillance still relies predominantly on cost-effective, self-reported survey methods, it is highly probable that the true rate of global physical inactivity is significantly worse than the official baseline estimates suggest.
The Global Inactivity Epidemic: Analyzing the WHO Data
To grasp the macro scale of human movement, the most authoritative baseline is the global tracking conducted by the World Health Organization. In June 2024, the WHO published a landmark study in The Lancet Global Health journal, offering the most comprehensive assessment of global inactivity to date 32526. The study, which synthesized data from 507 population-based surveys covering 5.7 million participants across 163 countries and territories, delivered a stark warning: the world is moving less, and the trajectory is worsening 262930.
According to the new data, an estimated 31.3% of the global adult population - approximately 1.8 billion people - were classified as insufficiently physically active in 2022 325262927. This means that nearly a third of all adults worldwide did not meet the baseline 150-minute recommendation of moderate-intensity activity 325. Among adolescents (ages 11 to 17), the crisis is vastly more severe, with a staggering 81% failing to meet the recommended 60 minutes of daily activity 3.
The historical trend line reveals a slow but steady collapse of everyday human exertion. In the year 2000, the global prevalence of adult physical inactivity stood at 23.4% 263028. Over the next decade, as technology advanced and lifestyles shifted, inactivity crept up to 26.4% by 2010 2630. By 2022, the figure had jumped roughly 5 percentage points to reach the current 31.3% 32527. The WHO had previously established a highly publicized global target of reducing physical inactivity by 15% by the year 2030 (using 2010 as a baseline) 325262927. However, the 2024 findings confirm that the world is completely off track from meeting this goal. In fact, if the current downward trend continues unabated, the WHO projects that global levels of physical inactivity will rise to 35% by 2030 32527.
The consequences of this mass sedentary behavior are not merely abstract statistical concerns; they carry a catastrophic economic and medical burden. Physical inactivity is recognized as one of the leading global risk factors for noncommunicable diseases (NCDs) and premature mortality 3. People who are insufficiently active face a 20% to 30% increased risk of death compared to people who consistently meet the guidelines 3629. A lack of movement directly increases the risk of cardiovascular diseases (such as heart attacks and strokes), type 2 diabetes, dementia, and specific cancers including breast, colon, and rectal cancer 32529.
The financial toll on global infrastructure is equally immense. The WHO estimates that the direct cost of physical inactivity to public health care systems worldwide between 2020 and 2030 will reach approximately $300 billion, translating to roughly $27 billion in avoidable healthcare expenditures every single year 3.
Geographic, Economic, and Demographic Divides
The modern sedentary lifestyle is not distributed evenly across the globe. It is heavily influenced by geography, economic development, gender, and age, creating distinct pockets of high and low activity that often defy standard assumptions about wealth and health.
The Income and Regional Paradox
One might assume that the wealthiest nations, with their abundant access to leisure time, green spaces, and high-end fitness facilities, would boast the most active populations. The data, however, reveals a complex paradox. The highest prevalence of physical inactivity is actually observed in the high-income Asia Pacific region, where an alarming 48% of the adult population fails to meet the guidelines 252630. This region includes technologically advanced nations such as South Korea, Japan, and Singapore 30.
South Asia follows closely behind, with an inactivity prevalence of 45% 252630. This region encompasses Afghanistan, Bangladesh, Bhutan, India, Nepal, Pakistan, and Sri Lanka 30. Abrar Mir, co-founder of Quadria Capital, highlighted the severe public health implications of this regional data, noting that while Asia holds roughly 30% of the world's population, it carries almost 50% of the global disease burden, including disproportionately high rates of diabetes, cancer, and cardiovascular disease - all conditions exacerbated by a lack of movement 30.
In stark contrast, Oceania boasts the lowest prevalence of physical inactivity globally, at just 14% 2526. Furthermore, several countries within Oceania have demonstrated remarkable progress, managing to reduce their physical inactivity rates from 23% in 2000 down to 14% in 2022, proving that population-level turnarounds are entirely possible 29. High-income Western countries sit somewhere in the middle, registering a 28% inactivity rate 25.
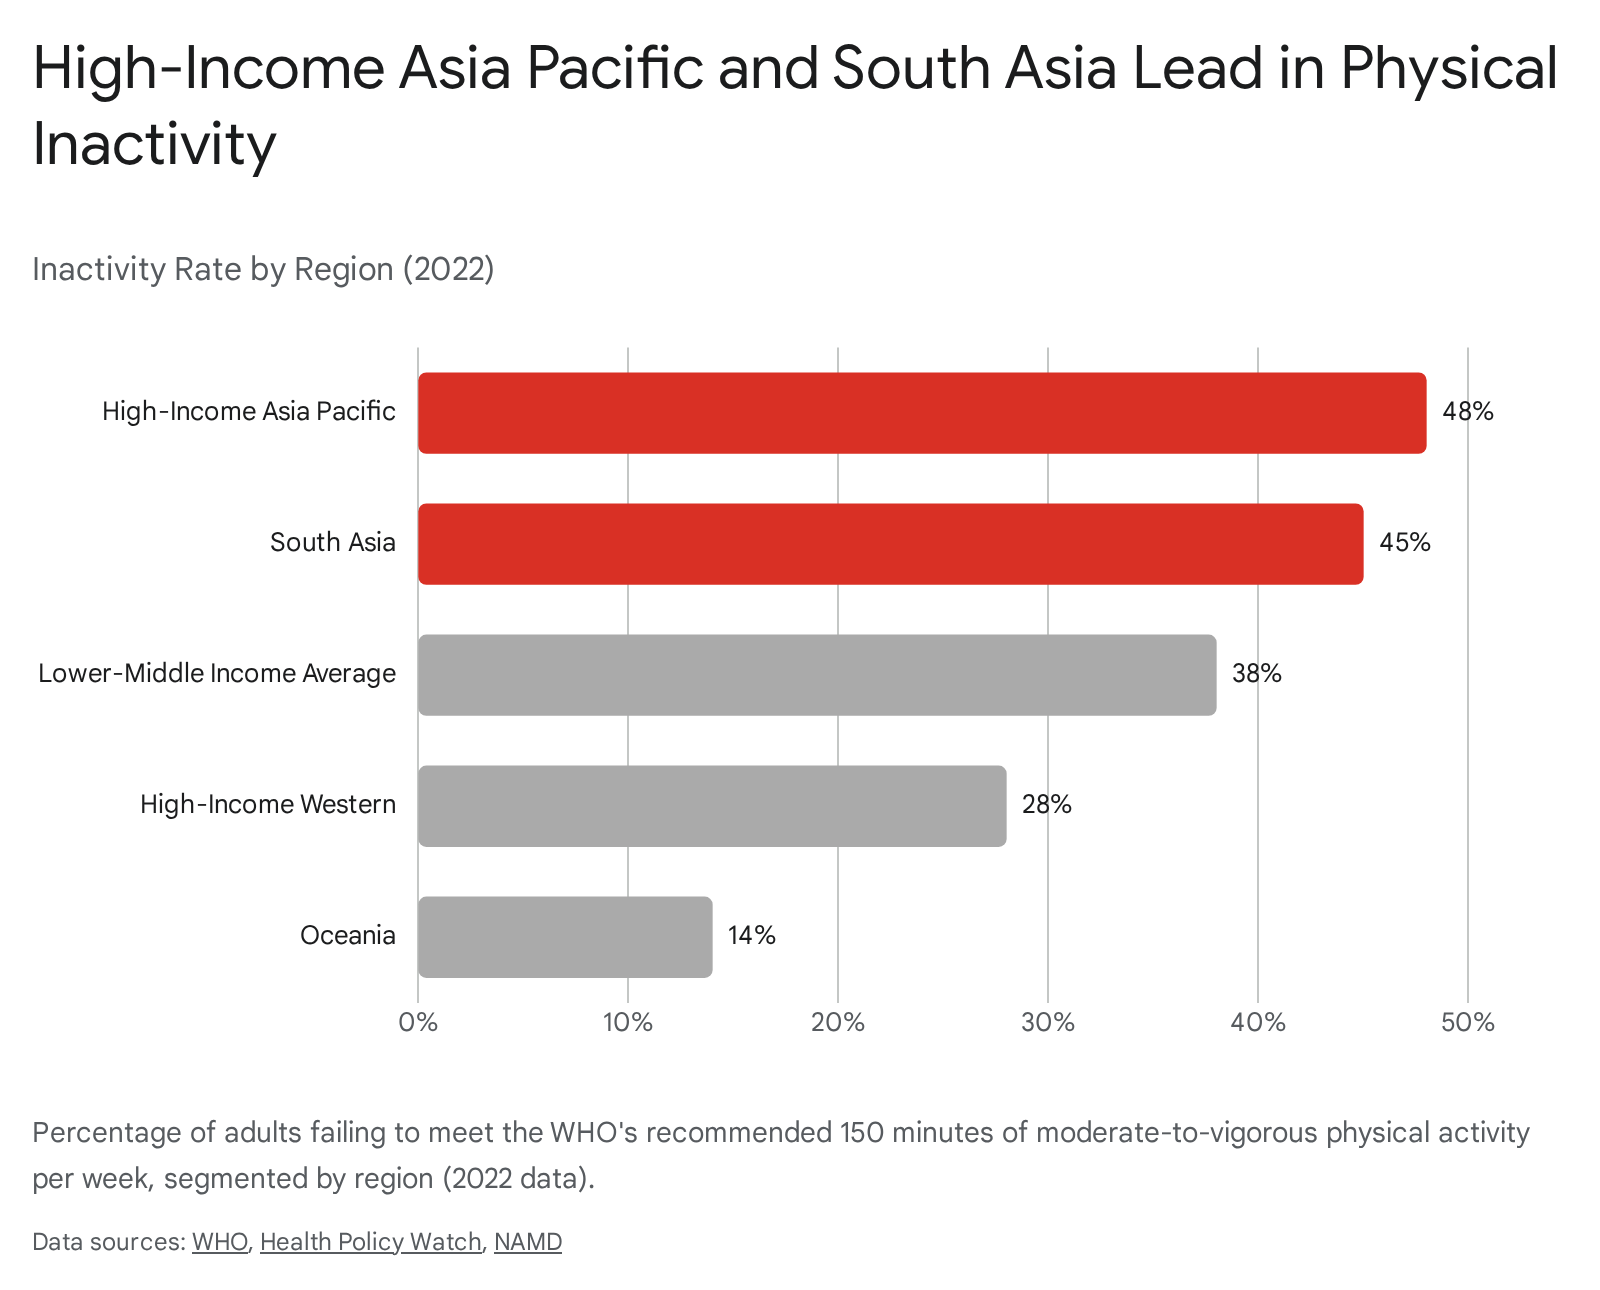
When the data is segmented strictly by national income brackets, a clear narrative emerges regarding economic transitions. The steep rise in physical inactivity globally over the last two decades is heavily driven by data from lower-middle-income countries, which currently face the highest overall levels of inactivity at 38% 262927. By comparison, low-income countries have a much lower inactivity rate of 17%, likely due to a higher reliance on manual occupational labor and active transportation (walking or cycling) out of necessity rather than leisure 2629. Upper-middle-income countries average 27%, and high-income countries average 33% 29. As lower-middle-income countries rapidly develop, urbanize, and transition toward service-sector economies reliant on electronic devices and motorized transport, they are importing the sedentary crisis that previously afflicted only the wealthiest nations 293027.
The Persistent Gender and Age Gaps
Beneath the geographical divides lies a stubborn and persistent demographic gap regarding who gets to move. Globally, women are significantly less physically active than men. According to the 2024 WHO data, the global inactivity rate for women is 34%, compared to 29% for men 252630. This 5-percentage-point gender gap has remained virtually unchanged since the year 2000, indicating a systemic failure in public health outreach and infrastructure 3.
In certain regions, this disparity is vastly magnified. In the South Asia region, physical inactivity among women is a staggering 14 percentage points higher than among males, and in some specific countries, the difference reaches as high as 20 percentage points 253029. The same trend holds true for younger demographics; globally, 85% of adolescent girls fail to meet activity guidelines, compared to 78% of adolescent boys 3.
Public health experts and sociologists attribute this enduring gender gap to a multitude of deeply ingrained societal factors. Fiona Bull, head of the WHO's physical activity unit, points out that levels of physical activity are determined by a complex suite of environmental and cultural variables 30. Globally, women disproportionately bear the burden of family and home care, leaving them with significantly less leisure time to dedicate to structured exercise, especially if they are balancing those duties with employment 30. Furthermore, in many populations, cultural norms, societal values regarding female athletic participation, a lack of safe environments for outdoor recreation, and a lack of access to women-only community sports facilities systematically restrict women's movement 30.
Age acts as another critical drop-off point in the human lifespan. The data shows that after the age of 60, physical inactivity levels spike sharply in almost every population globally, for both men and women 3252729. This underscores the critical importance of developing specialized public health interventions that promote safe, low-impact, and socially engaging physical activities explicitly tailored for older adults, as maintaining movement in late life is heavily correlated with extending healthy life expectancy and delaying cognitive decline.
A Closer Look at National Trends
While global averages provide a vital macro view, examining country-specific data reveals how domestic policies, the built environment, and socioeconomic status shape daily movement. Looking closely at recent data from England and Canada offers contrasting examples of how developed nations are grappling with the activity crisis.
England: An Active Nation Masking Deep Inequalities
On the surface, data from England suggests a highly optimistic picture of population health. According to the Active Lives Adult Survey published by Sport England, covering the period between November 2023 and November 2024, an estimated 64.6% of adults in England (roughly 30.9 million people) met the Chief Medical Officers' guidelines of 150 minutes of moderate activity per week 10. This represents an increase of 859,000 adults compared to the previous 12 months, driving the country's overall activity levels to their highest point since the survey began in 2015 1030. Concurrently, the number of inactive adults doing less than 30 minutes of activity a week fell to 24.7%, a decrease of 0.9% over the past decade 1030.
This surge is largely attributed to a robust post-pandemic recovery in structured fitness activities. The data highlights significant growth in gym attendance (rising to 15.3 million participants), running (7.1 million participants), and a stabilization of swimming and team sports 1030. Notably, the increase was heavily driven by older demographics; activity levels among those aged 55 to 74 rose from 57% in 2015-16 to over 64% in 2024, reflecting a growing awareness of the link between movement and a longer, healthier life 1030.
However, this high national adherence rate obscures profound and widening inequalities. In England, the likelihood of meeting exercise guidelines is heavily dictated by wealth, geography, and physical ability. Data from the Office for Health Improvement and Disparities (OHID) reveals a stark contrast based on neighborhood deprivation 31. Between 2023 and 2024, only 15% of adults living in the least deprived areas of England were physically inactive. In contrast, 35% of adults living in the most deprived areas were inactive 31.
This means the level of physical inactivity for adults in the poorest areas is 2.3 times higher than for those in the wealthiest areas 31. Even more concerning, while activity levels have increased over the past decade in affluent areas, inactivity has actually increased in the most deprived areas, significantly widening the absolute level of health inequality in the country 31. The consequences of this divide are lethal; the gap in healthy life expectancy between those living in the most and least deprived areas of England is approximately 20 years 31.
Furthermore, disability remains a massive barrier to movement. People with a long-term health condition or disability are roughly twice as likely to be inactive as those without 3237. In the latest Active Lives Survey, only 48.5% of people with a long-term condition or disability reported reaching the 150-minute threshold, compared to 68.9% of those without such conditions 37.
Canada: A Youth Crisis and the Costs of Sprawl
Canada faces a different and deeply troubling set of challenges. According to the latest Canadian Health Measures Survey (CHMS) - which relies on highly accurate accelerometer data rather than self-reporting, spanning 2022 to 2024 - only 46% of Canadian adults met the national physical activity guidelines 3334353637. This metric earned Canadian adults a grade of C-minus on the national ParticipACTION report card, a figure that has remained stubbornly stagnant for years 3637.
The lack of cardiovascular exertion is compounded by an epidemic of sitting. Canadian adults are highly sedentary, spending an average of 9.3 hours a day sitting, reclining, or lying down (excluding sleep time) 333438. Only 42% of adults meet the national guideline advising against more than nine hours of sedentary time daily, with men (35%) faring notably worse than women (49%) in this specific metric 333538. The economic fallout is severe; researchers estimate that physical inactivity costs Canada's health-care system $3.9 billion annually in avoidable expenditures, and that even a 15% increase in population activity levels could save roughly $1 billion each year in chronic disease management and employee absenteeism 3637.
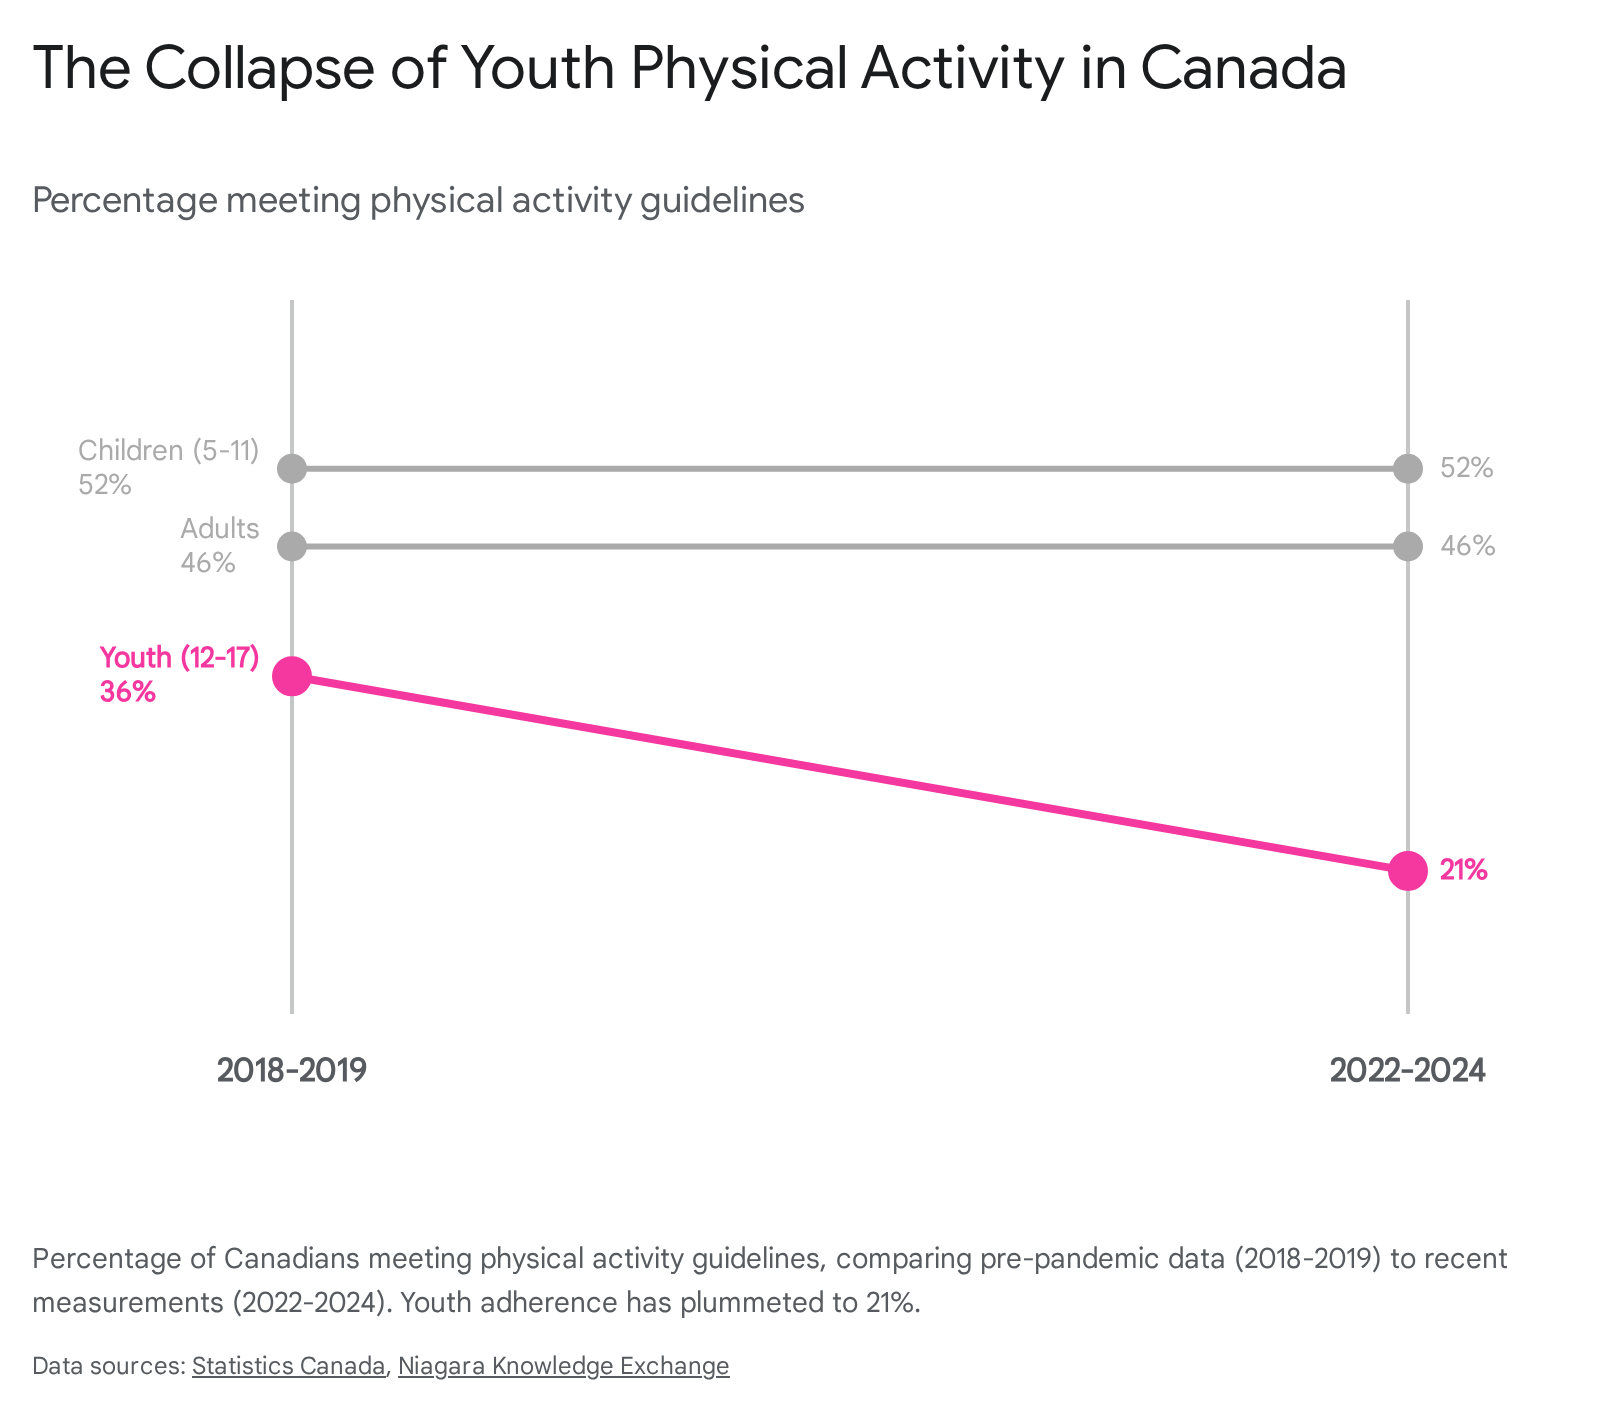
The most alarming metric emerging from Canada, however, is the total collapse of physical activity among adolescents. During the 2018 - 2019 survey period, 36% of Canadian youth (ages 12 to 17) met the recommendation of 60 minutes of daily moderate-to-vigorous physical activity 3339. By the 2022 - 2024 survey period, that figure had plummeted to a mere 21% 333439. Teens were the only age group to experience this massive decline, while activity rates among preschoolers and younger children remained relatively stable 3339.
The gender gap within this youth demographic is staggering: 33% of teen boys currently meet the activity recommendations, compared to a devastatingly low 8% of teen girls 3334. Because low activity levels during adolescence frequently continue into adulthood, public health experts fear this cohort is being set up for a lifetime of metabolic and cardiovascular challenges 39.
Experts point to a combination of environmental and technological factors driving this national decline. Brianne Bruijns, a project manager for ParticipACTION, notes that "technological advancements have pretty much socially engineered movement out of our daily lives" 36. Rather than walking grocery aisles or taking the stairs, daily tasks have been outsourced to screens and convenience tech 36. Furthermore, youth screen time is extraordinarily high; only 28% of Canadian youth meet the recommendation of engaging in no more than two hours of recreational screen time a day, while they spend an average of 10.6 hours per day being entirely sedentary 3438.
The built environment is also a major culprit. Urban sprawl, a heavy dependence on car infrastructure, and a lack of safe, connected active transportation routes (like protected bike lanes and wide sidewalks) mean that movement in Canada is no longer incidental 45. As experts have noted, movement in Canada is no longer the easy choice or a natural byproduct of commuting; it has been reduced to a "scheduled activity" that requires dedicated time, money, and motivation - resources that are increasingly scarce for the average citizen 3645.
Redefining "Exercise": The End of the 10-Minute Rule
Amidst the grim statistics regarding inactivity, one of the most significant and positive shifts in public health strategy in recent years has been the radical redefinition of how exercise must be accumulated to be considered biologically valid.
Historically, public health guidelines operated under a rigid, sustained-effort paradigm. The prevailing consensus stated that physical activity only counted toward the 150-minute weekly goal if it was performed in continuous, uninterrupted bouts of at least 10 minutes 4041484243. If an individual walked briskly for eight minutes to catch a train, or carried heavy boxes up three flights of stairs for four minutes, that cardiovascular exertion was statistically discarded by surveillance systems and deemed insufficient to produce physiological benefits.
However, over the last decade, advancements in physiological monitoring have completely dismantled this assumption. Recent updates to major public health frameworks - including the second edition of the Physical Activity Guidelines for Americans and the Canadian 24-Hour Movement Guidelines for Adults - have officially eliminated the 10-minute bout requirement 140424344.
This policy change was driven by a wave of new epidemiological data. A landmark 2019 systematic review analyzed prospective cohort and randomized studies to examine the association between bout duration and health outcomes 4843. The researchers found that moderate-to-vigorous physical activity (MVPA) of any bout duration is strongly associated with improved health outcomes, including reductions in all-cause mortality, positive impacts on body weight and composition, lowered blood pressure, improved blood lipids, and better insulin sensitivity 4843. The body does not possess an internal stopwatch that must hit ten minutes before it begins burning fat or strengthening the heart muscle; the cumulative total volume of MVPA over a day is the vital metric, regardless of how it is fragmented 48.
This paradigm shift has given rise to the concept of "exercise snacks" - periodic short bursts of vigorous activity lasting under ten minutes 43. Taking the stairs instead of the elevator for two minutes, performing a set of jumping jacks during a television commercial break, or doing a 60-second sprint from the parking lot to the office all legitimately count toward the weekly 150-minute goal 434546. Studies evaluating adherence to these "PA snacks" show promising results, as participants generally find it much easier to adhere to prescribed micro-bouts throughout the day than to carve out a contiguous 45-minute gym session 43.
Statistically, the removal of the 10-minute rule drastically alters the landscape of public adherence data. A comprehensive study by Statistics Canada utilized accelerometer data from 7,102 adults across three survey cycles to compare how many people met the guidelines under the old "bouted" rules versus the new "non-bouted" rules 4042. The results were staggering: the proportion of Canadian adults meeting the 150-minute recommendation more than doubled, jumping from a mere 18.5% under the strict 10-minute bout rule to 45.3% when all fragmented minutes of MVPA were counted 404842.
While an Austrian surveillance study utilizing self-reported data found that removing the 10-minute requirement from questionnaires did not significantly alter their self-reported adherence estimates 41, the objective accelerometer data overwhelmingly confirms that millions of adults are accumulating vast amounts of health-enhancing physical activity in short, functional bursts that were previously ignored by science.
Breaking Down the 150 Minutes in Real Life
For individuals struggling to build an active lifestyle from scratch, the prospect of committing to 150 minutes of exercise per week can sound intimidating, conjuring images of grueling gym sessions and expensive athletic gear. However, public health experts emphasize that reframing the math makes the target highly attainable for the general population.
At its core, 150 minutes equates to just 30 minutes a day, five days a week 294445. With the removal of the 10-minute bout rule, this can be broken down even further into microscopic segments. It requires only 15 minutes of elevated heart rate twice a day, or roughly ten minutes three times a day 9. In the broader context of weekly leisure time, 150 minutes is significantly less time than it takes to watch a single average feature-length movie 454647.
Because the barrier to entry is often a lack of free time, public health officials increasingly advocate for "habit stacking" - the behavioral psychology technique of piggybacking a new desired behavior onto an existing, unbreakable daily routine 47. The daily commute presents the ultimate opportunity for this intervention. Integrating active transport, such as walking to a distant bus stop, cycling the entire way to work, or deliberately parking far from the office entrance, transforms dead transit time into cardiovascular therapy 47. A systematic review of intervention trials revealed that active commuting in previously untrained subjects significantly improves exercise capacity, maximal power, blood pressure, lipid parameters (including HDL cholesterol), and waist circumference 48. The physiological improvements derived from simply walking to work are mathematically comparable to those achieved through structured moderate exercise training protocols 48.
Crucially, experts stress that you do not need to wear athletic clothing, purchase a gym membership, or even call it a "workout" to accumulate valid minutes 454656. Everyday household management naturally elicits the required MET output if done with minimal vigor.
- Housework: Deep cleaning the house is a highly effective cardiovascular circuit. Vacuuming, mopping floors, scrubbing the bathtub on hands and knees, hanging laundry on a clothesline, and washing the car by hand all qualify as moderate-intensity activities that elevate the heart rate and build endurance 1112131446.
- Yard Work: Outdoor maintenance engages the whole body and often incorporates the elusive muscle-strengthening requirement. Gardening tasks such as continuous digging, spading, pushing a heavy lawnmower, splitting wood, or carrying heavy bags of mulch easily breach the moderate-to-vigorous threshold, demanding energy expenditures ranging from 4.0 to over 7.0 METs 112131415.
- Recreation and Play: Movement should be joyful. Putting on lively music and dancing in the living room for a few songs (roughly 10 minutes), playing tag or throwing a frisbee with children rather than watching them from a bench, or briskly walking a dog all elevate the heart rate sufficiently to chip away at the 150-minute minimum 4454656.
Even the newest, gentler fitness trends sweeping social media align perfectly with public health goals. The viral concept of "cozy cardio" - which involves ditching tight activewear for pajamas and engaging in low-impact, comfortable exercise from home while watching television - serves as an excellent entry point for the previously inactive 57. As long as the individual is pushing their body hard enough to breathe slightly heavier and raise their heart rate, the environment and the attire are medically irrelevant 57. The best exercise regimen is the one that an individual can sustain without dread.
Bottom line
While nearly a third of the global population remains dangerously inactive, and flawed self-reported surveys in developed nations likely mask an even deeper epidemic of sedentary behavior, meeting the biological requirements for long-term health is vastly more accessible than society portrays it to be. You do not need to be a structured athlete to achieve the 150-minute weekly target. By understanding that every single minute of effort counts, and that vigorous chores, active commuting, and spontaneous play are physiologically indistinguishable from a treadmill session, individuals can seamlessly weave life-saving movement back into the fabric of their daily lives.