
Timelines and Predictors of Product-Market Fit
The concept of product-market fit serves as the defining milestone in the lifecycle of technology ventures. Originally codified in the mid-2000s, product-market fit describes the degree to which a unique product offering satisfies a strong market demand 1. In practical terms, it marks the transition phase from the search for a viable business model to the execution and scaling of that model. Despite its ubiquitous usage in venture capital and entrepreneurial ecosystems, achieving this state remains a formidable challenge. Industry data indicates that over 80 percent of startup founders fail to find product-market fit, representing the primary filter that separates successful ventures from early-stage failures 2.
This report examines the empirical timelines associated with achieving product-market fit across various sectors, the quantitative and qualitative patterns that predict its arrival, the methodological frameworks utilized by founders, and the structural factors that influence its sustainability over time.
The Conceptual Framework of Product-Market Fit
Before analyzing timelines, it is critical to establish the parameters of product-market fit. The term is widely attributed to venture capitalist Don Valentine and formalized by Andy Rachleff and Marc Andreessen, who defined it simply as being in a good market with a product that can satisfy that market 13.
The Binary Versus Continuum Debate
In popular entrepreneurial narratives, product-market fit is frequently depicted as a sudden, binary event - a singular moment when customer acquisition outpaces production capacity and revenue begins to compound exponentially 45. This binary myth implies that ventures exist in a state of darkness until a sudden breakthrough elevates them to unicorn status 5.
However, contemporary research and practitioner data suggest that product-market fit exists on a fluid continuum rather than as a strict binary threshold. Fit can range from weak to mild to strong, and its strength fluctuates over time based on market conditions and competitive dynamics 678. For instance, a venture may achieve strong resonance with early adopters but fail to cross the chasm to the mainstream market, indicating localized rather than absolute fit 8. Treating the concept as a rigid milestone often pressures founders into prematurely scaling operations before genuine, scalable demand has been scientifically validated, a misstep that accounts for a significant portion of startup mortality 35.
Early Sales as a Predictor of Long-Term Survival
Longitudinal academic studies provide concrete evidence that early market traction is the ultimate predictor of venture survival. A 20-year panel study of high-technology new ventures conducted by researchers Gimmon and Levie revealed that generating early sales - the most tangible proof of initial product-market fit - has a disproportionately strong association with venture survival and high performance over two decades 78.
Ventures that successfully captured regular sales in their earliest years reduced their hazard of closure by approximately 90 percent over a 20-year period compared to those that did not 8. Interestingly, the study found that the positive effects of external venture capital funding faded after a few years, merely keeping ventures alive in the short term, whereas early sales demonstrated a permanent, structural advantage 78. This implies that capital cannot manufacture product-market fit; it can only scale the fit that has already been organically discovered.
Aggregate Timelines to Market Validation
The duration required to achieve product-market fit varies significantly, driven by industry characteristics, product complexity, and the quality of initial market validation. While the popular startup narrative often highlights overnight successes, empirical data reveals a much longer and more iterative reality.
Baseline Expectations and the Validation Advantage
Across the broader technology startup ecosystem, the average time to achieve product-market fit ranges between 18 and 24 months 9. This timeline represents the duration from the inception of the company or the initial product development phase to the point where the venture experiences sustained, organic demand that outpaces the team's capacity to deliver 4.
A critical determinant of this timeline is the degree of market validation conducted prior to product development. Startups built upon thoroughly validated ideas - where founders engage in extensive customer discovery before writing code or manufacturing prototypes - typically reach product-market fit six to twelve months faster than those relying on unvalidated assumptions 9.
The startup lifecycle is heavily characterized by iterative learning. Following the launch of a first live product or minimum viable product, which typically occurs within the first three to nine months, companies often face an additional six to twelve months of learning, pivoting, and refinement before genuine product-market fit solidifies 12. If no signals of market alignment appear after 12 to 18 months of continuous iteration, ecosystem advisors typically recommend a significant structural pivot 9.
Sector-Specific Timelines and Structural Constraints
The path to product-market fit is not uniform; structural differences in sales cycles, development costs, and regulatory environments dictate distinct timelines across sectors. Software sectors typically reach product-market fit within one to three years, whereas hardware and biotechnology require significantly longer runways due to prototyping cycles and regulatory hurdles 9131415.
Consumer Applications and Software
Consumer-facing digital products operate on the fastest theoretical timelines, largely due to immediate feedback loops and lower barriers to user adoption. Consumer products can achieve product-market fit in 6 to 18 months, though this rapid timeline often includes multiple product pivots as founders test different value propositions against highly variable consumer attention spans 9. In the consumer social space, benchmarks for success are rigorous: to demonstrate respectable product-market fit, a social application typically requires day-one (D1) retention of 60 percent, day-seven (D7) retention of 30 percent, and day-thirty (D30) retention of 15 percent, alongside a Daily Active User to Monthly Active User (DAU/MAU) ratio exceeding 20 percent 16.
Business-to-Business Software-as-a-Service
Business-to-business (B2B) software-as-a-service companies face systematically longer timelines, typically ranging from 18 to 36 months 9. The delay is attributed to extended enterprise sales cycles, the necessity of building integrations with legacy corporate systems, and the time required to demonstrate measurable return on investment to institutional buyers. In this sector, reaching $1 million in annual recurring revenue is widely considered the threshold of initial product-market fit, signaling that the venture can systematically acquire and retain professional customers 1011. Scaling from $1 million to $10 million in revenue is the subsequent phase where product-market fit is stress-tested; companies must evolve from offering a single beloved feature to providing a comprehensive platform 11.
Generative Artificial Intelligence
The advent of generative artificial intelligence has severely compressed timelines for successful ventures. A recent empirical analysis of AI startups indicates that consumer AI applications are hitting $4.2 million in annual recurring revenue within their first year, while enterprise AI companies are reaching $2 million in revenue within 12 months 14. Because AI products can leverage pre-trained foundation models via application programming interfaces from major providers, founders bypass traditional infrastructure development and rapidly test for product-market fit 12.
This dynamic allows top-tier AI companies to raise Series A funding within eight to nine months of launching monetization 14. However, maintaining this fit requires managing volatile compute costs. Generative AI companies often experience demand spikes that can increase request volumes tenfold in a single day 12. Furthermore, achieving high accuracy for edge cases requires exponential capital investment, altering traditional software margins 13.
Hardware and Physical Products
Hardware startups face a rigid, linear development process that severely limits the speed of iteration. Going from an initial prototype to a mass-produced product ready for the consumer market generally takes 18 to 24 months, with complex medical or industrial products sometimes requiring 36 months or more 15. This timeline includes the development of a proof of concept, engineering verification testing, design verification testing, tooling preparation, and establishing a robust supply chain 151422.
Hardware iteration is constrained by physical reality. Creating a 3D model and preparing it for mass manufacturing (injection molding) can take one to six months 23. Rushing these phases often leads to catastrophic quality issues, meaning hardware founders must secure sufficient capital runway to survive a two-year pre-revenue iteration cycle 23. Startups that attempt to write firmware after the physical hardware is locked frequently experience multi-month delays, highlighting the need for concurrent engineering 15.
Biotechnology and Life Sciences
In the life sciences and deep tech sectors, the concept of product-market fit is deeply intertwined with regulatory approval and scientific efficacy. The journey from laboratory discovery to commercial availability is highly regulated and capital-intensive. Preclinical development involves in vitro and animal studies to assess safety and toxicity, a process lasting one to two years 13. If successful, companies file an Investigational New Drug application to commence human trials 13.
Clinical trials represent the most significant hurdle. Phase I tests safety in a small cohort of 20 to 80 healthy volunteers. Phase II tests efficacy and dosing in 100 to 300 patients. Phase III involves large-scale testing across 1,000 or more patients globally 15. These phases consume five to seven years and account for up to 70 percent of total development costs, with the average trial failing to progress beyond Phase I nearly half the time 1316. The probability of a drug progressing from Phase I to full regulatory approval is a mere 13.8 percent 13. Consequently, a biotech startup may not achieve commercial product-market fit for a decade, requiring massive capital deployment long before any revenue is realized 1315.
| Venture Sector | Average Time to Fit | Key Milestone Indicating Fit | Primary Structural Constraints |
|---|---|---|---|
| Consumer Software | 6 - 18 months | D30 retention > 15%, DAU/MAU > 20% | User attention saturation, low switching costs |
| B2B SaaS | 18 - 36 months | $1M ARR, Net Revenue Retention > 110% | Enterprise sales cycles, procurement and integration barriers |
| Generative AI | 6 - 12 months | $2M - $4M ARR in Year 1 | Heavy up-front compute costs, reliance on third-party foundation models |
| Hardware | 18 - 24+ months | Mass production, successful EVT/DVT | Injection molding tooling, supply chain delays, concurrent firmware engineering |
| Biotech / Pharma | 7 - 10+ years | Phase III success, FDA/EMA Approval | Highly regulated clinical trials, biological failure rates, massive R&D expenditure |
Quantitative Indicators of Product-Market Fit
Determining whether a startup has achieved product-market fit requires a rigorous analysis of quantitative performance metrics. Venture capital analysts rely on specific threshold metrics to differentiate genuine organic market pull from growth that is artificially subsidized by aggressive marketing spend.
Revenue Velocity and Trajectory
At the early scaling stage, explosive revenue growth is a primary indicator of market alignment. The median year-over-year growth for SaaS companies successfully navigating the transition from $1 million to $10 million in recurring revenue is approximately 100 percent, while top-quartile performers achieve 150 to 250 percent growth 17.
To maintain an optimal venture trajectory, known within the industry as the "T2D3" path (triple, triple, double, double, double), a venture must grow its revenue from $1 million to $100 million over five years 17. Achieving the initial tripling phases requires approximately 11.6 percent month-over-month growth 17. As companies scale beyond $50 million in revenue, absolute dollar growth remains massive, but percentage growth naturally decelerates to a benchmark of 25 to 40 percent year-over-year 17.
Customer Retention and Churn Metrics
Growth without retention signifies a fundamental lack of true market fit. Net Revenue Retention, which measures revenue from an existing customer cohort after accounting for churn and expansion upgrades, is widely considered the strongest predictor of long-term success 1718. An NRR trending above 110 percent demonstrates that existing customers are extracting enough ongoing value to upgrade their usage, organically offsetting any lost accounts 1718. For enterprise software companies scaling past $50 million, NRR frequently sits between 115 and 125 percent, functioning as a compounding growth engine 17.
Conversely, churn rates provide the starkest warning of missing product-market fit. If monthly logo churn exceeds 5 percent in early-stage software, it is a definitive sign that the product is failing to deliver its promised value 17. At later stages, best-in-class companies maintain monthly logo churn below 1 percent 17.
Capital Efficiency and Burn Multiples
The financial efficiency with which a startup acquires and services customers highlights the strength of organic market demand. The Customer Acquisition Cost payback period measures how many months of gross margin are required to recover the marketing and sales expenditure used to acquire a single customer. According to industry benchmarking, a payback period under 12 months is considered best-in-class for small-to-medium business software 1920. Mid-market products target under 18 months, while enterprise solutions can sustain up to 24 months due to much higher lifetime contract values and lower churn 20.
Additionally, the "Burn Multiple" is a critical metric for assessing early-stage fit. This ratio calculates how much venture capital is burned to generate each net new dollar of revenue. During the pre-seed and seed stages, burn multiples are expectedly high (2.0x to 3.0x) as teams invest heavily in unmonetized research and development 14. However, once product-market fit is established and a company approaches its Series A funding round, the burn multiple should drop below 1.5x 1419. A company growing revenue at 200 percent but sustaining a burn multiple of 3.0x is likely forcing growth through unsustainable spending, rather than enjoying true product-market fit 19.
Finally, the Rule of 40 - which stipulates that a software company's growth rate plus its free cash flow margin should equal or exceed 40 percent - becomes the dominant metric for balancing growth and profitability as companies scale beyond $10 million in revenue 1719.
Qualitative and Behavioral Predictors
While quantitative data measures the trailing outcomes of product-market fit, qualitative customer behaviors serve as early leading indicators. Relying purely on aggregate analytics without qualitative context leaves founders unable to explain why users are churning or converting 212223.
The Sean Ellis Threshold
A prominent qualitative metric utilized globally by product managers is the Sean Ellis test. This methodology involves surveying active users and asking how they would feel if they could no longer use the product. If 40 percent or more of respondents state they would be "very disappointed," the product has likely crossed the minimum threshold required for sustainable product-market fit 11824.
Inbound Pull and Time-to-Value
A primary behavioral signal of fit is a dramatic shift in the sales dynamic from an outbound "push" to an inbound "pull." When qualified inbound leads organically constitute more than 40 percent of the sales pipeline without the aid of paid marketing campaigns, it indicates that the broader market is actively seeking out the solution 18.
Furthermore, strong product-market fit is evident when prospects arrive at discovery calls naturally utilizing the startup's specific vocabulary, indicating that the company's messaging perfectly articulates an existing market pain point 18. In software and digital products, this correlates with a highly compressed time-to-first-value. If a new user achieves a clear, positive outcome - such as generating a crucial report or automating a tedious workflow - within two weeks of onboarding, the likelihood of long-term retention increases dramatically 18. Finally, when existing users act as unprompted champions, sharing links and recruiting peers organically, the venture exhibits the highest qualitative validation of fit 18.
Geographic Variations and Ecosystem Dynamics
Product-market fit is heavily influenced by the macroeconomic conditions and infrastructure maturity of the region in which a venture operates. Playbooks developed in mature technology hubs frequently fail when transplanted to emerging markets.
The African Venture Landscape
The challenges of achieving product-market fit are acutely magnified in emerging markets across Africa. Research indicates that over 90 percent of African technology startups fail before achieving product-market fit 25. This astronomical failure rate is rarely due to a lack of technical talent; rather, it stems from attempting to replicate Silicon Valley business models in environments with vastly different infrastructural realities 25. Fragmented regional markets, complex regulatory environments, and a historical lack of consumer trust dictate that a technically impressive application does not automatically translate into market demand 25.
However, the African tech ecosystem is maturing rapidly. In 2025, African technology funding rebounded significantly, reaching $4.1 billion in deployed capital, a 25 percent year-over-year increase that signals an end to the regional funding winter 2627. Crucially, this recovery is characterized by a massive shift toward debt financing, which hit a record $1.64 billion and accounted for 41 percent of all capital deployed on the continent 262728. This pivot toward debt indicates that investors are prioritizing mature, asset-heavy companies with definitively proven product-market fit and reliable cash flows, rather than speculative early-stage equity bets 26. The equity landscape has also diversified; while fintech remains dominant, sectors like cleantech ($550 million) and healthtech ($215 million) experienced explosive growth, proving that non-financial sectors can achieve scalable fit in the region 262728.
Southeast Asian Market Realities
Similar dynamics are observed in Southeast Asia. The region's digital economy is expanding rapidly, with Vietnam alone experiencing a 28 percent growth rate, increasing from $18 billion to $23 billion in a single year 29. Despite this macroeconomic tailwind, achieving product-market fit requires deep localization.
Venture capital analysts in the region emphasize that founders must align with realistic infrastructure timelines 30. Pursuing financial technology models that rely on infrastructure that will not mature for 15 to 20 years results in guaranteed failure 30. Furthermore, many founder teams in Southeast Asia struggle with creating fit because they over-index on pitching skills rather than fundamental customer development and financial management 31. Investors in the region increasingly seek founders who understand deep structural inefficiencies and can build deeply vertical, regional solutions tailored to the growing middle class, rather than importing Western consumer applications 4132.
Strategic Methodologies for Establishing Fit
The pursuit of product-market fit has evolved from an ad-hoc art form into a structured methodology, supported by academic research in entrepreneurship theory and design science.
The Lean Startup and Innovation Accounting
The most prominent framework for accelerating the path to product-market fit is the Lean Startup methodology. This approach treats venture creation as a scientific exercise centered on discovering customer needs and validating hypotheses through repeated experimentation 3334. By building a minimum viable product - defined strictly as the version of a product that enables a full turn of the "build-measure-learn" feedback loop with the least amount of development time - founders can gather empirical data on customer behavior rather than relying on unverified business plans 223435.
The framework replaces traditional vanity metrics with "innovation accounting," a structured way to measure progress through actionable indicators like customer lifetime value, acquisition cost, and cohort retention 35. Research published in Entrepreneurship Theory and Practice highlights that the Lean Startup framework minimizes resource waste and significantly reduces the time required for product development, allowing founders to pivot early based on market feedback 3336.
The Product-Market Fit Matrix and Lean Constraints
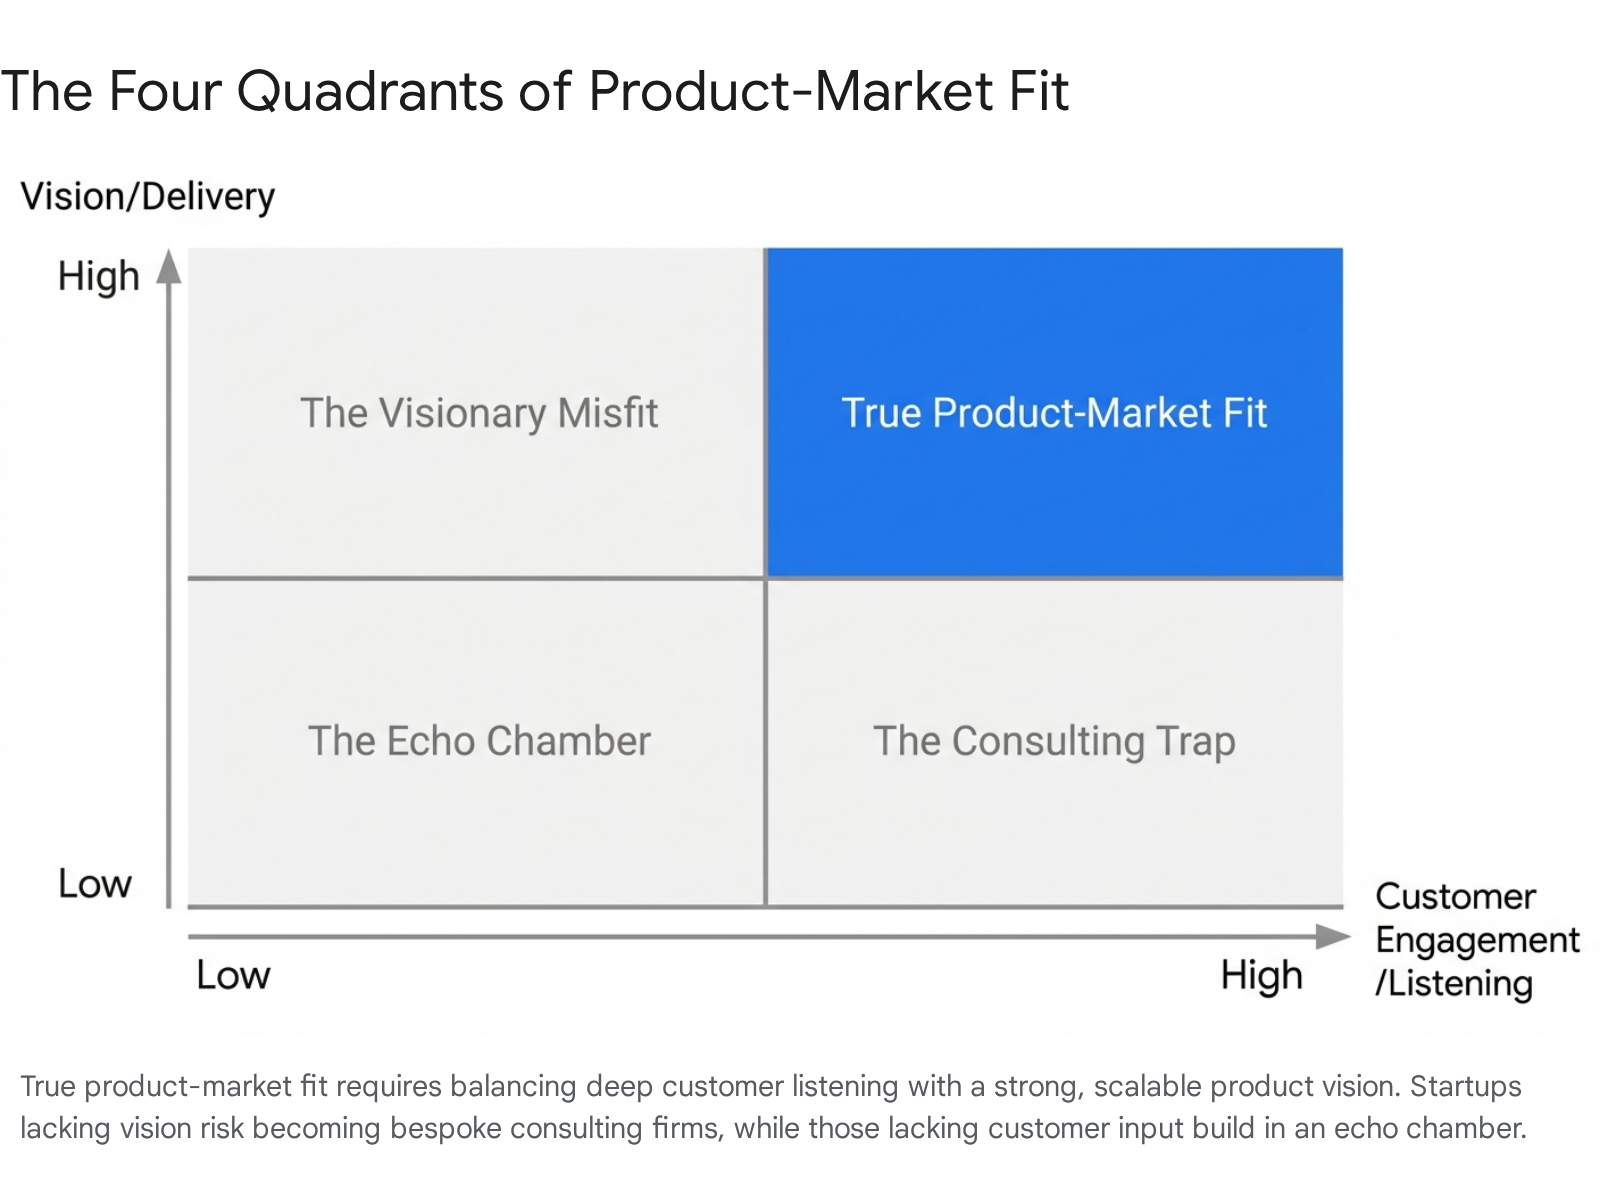
Despite its widespread adoption, the Lean Startup methodology possesses notable limitations. When entrepreneurs focus excessively on pushing their minimal product to market rather than conducting deep, empathetic interviews to uncover underlying behavioral insights, the methodology fails 34. Academic evaluations suggest that early-stage entrepreneurs benefit more from a "demand pull" approach - focusing entirely on market discovery - than a "resource push" approach that merely attempts to commercialize existing technical capabilities 37.
The Post-ZIRP Definition of Viability
The definition of a minimum viable product has shifted significantly following the end of the global zero-interest-rate policy era. During periods of cheap capital, venture capitalists prioritized rapid growth at all costs, allowing founders to launch low-quality, rudimentary products to test unproven markets 38.
Today, higher costs of capital enforce a rigorous focus on immediate efficiency and swift profitability. Moreover, because very few software markets remain untouched, new entrants are competing against established, feature-rich incumbents rather than building in greenfield spaces 38. Consequently, the "minimum" required for a product to be viable has risen dramatically. Users now demand high-quality interfaces, immediate integrations with their existing corporate software stacks, and robust security architecture from day one 38. A poor initial product in a saturated market creates hidden, compounding costs - including severe technical debt and reputational damage - that can permanently derail the search for product-market fit 38. In the modern landscape, software quality itself serves as a defensive moat.
Case Studies in Product-Market Fit Failure
Analyzing high-profile corporate failures provides critical insights into the fragility of product-market fit. Fit can be misdiagnosed early on, forcibly displaced by distribution asymmetries, or naturally eroded over time due to technological paradigm shifts.
Premature Scaling and Validation Failure: Quibi
The spectacular collapse of the short-form streaming service Quibi serves as a premier case study in misdiagnosing product-market fit and the dangers of premature scaling. Founded by entertainment and technology veterans Jeffrey Katzenberg and Meg Whitman, and backed by a staggering $1.75 billion in venture capital, Quibi launched in April 2020 and completely shut down a mere six months later 394041.
Quibi's failure was rooted in a fundamental disconnect between its product offering and genuine consumer behavior. The company built an elaborate, premium subscription service designed strictly for "on-the-go" mobile viewing, operating under the unvalidated assumption that consumers would pay for heavily produced short episodes during commutes. The launch coincided with the COVID-19 pandemic, which shifted consumer behavior heavily toward home viewing on larger screens, a use case Quibi's technology did not support 244041.
More critically, Quibi failed to account for the abundance of free, highly engaging short-form content already capturing consumer attention on platforms like TikTok and YouTube 3941. The venture ignored basic market validation protocols: it disabled social sharing features, preventing the organic virality that drives modern media consumption, and it failed to conduct extensive beta testing with ordinary consumers outside of the Hollywood and Silicon Valley echo chambers 3941. The company's massive capital reserves led to lethal premature scaling - spending hundreds of millions on content acquisition and advertising before proving that a broader audience actually desired the product 41.
Distribution Asymmetry and Competitive Displacement: Netscape
The browser wars of the late 1990s demonstrate how product-market fit, even when overwhelmingly dominant, can be neutralized by a competitor with superior distribution channels. Netscape Navigator pioneered the commercial web browser market, achieving early, powerful product-market fit and capturing an 80 percent global market share by 1996 4243.
However, Netscape's fit eroded rapidly when Microsoft leveraged its monopoly in operating systems to bundle its free Internet Explorer browser directly into Windows, which controlled the vast majority of personal computers worldwide 5444. Netscape's standalone business model - which initially required users to actively download or purchase the software - could not compete with the frictionless, pre-installed distribution of Internet Explorer 5456.
Compounding this insurmountable distribution disadvantage, Netscape made critical internal engineering errors. The company released a slow, feature-bloated version 4.0, and subsequently made the fateful strategic decision to rewrite its entire codebase from scratch for version 6.0 4256. This decision stalled product innovation for nearly three years, during which time Microsoft invested heavily in research and development to rapidly improve Internet Explorer 4256. The combination of monopolistic distribution tying and strategic internal missteps effectively destroyed Netscape's market position, allowing Internet Explorer to capture over 90 percent of the market by the year 2000 5456.
Technological Obsolescence and the Erosion of Fit: BlackBerry
Product-market fit is not permanent; it must be actively defended against shifting consumer preferences and new technological paradigms. In the mid-2000s, Research In Motion achieved immense product-market fit with its BlackBerry devices, particularly in the enterprise and government sectors, by providing highly secure, mobile email via tactile physical keyboards 64546. By 2008, BlackBerry controlled over 50 percent of the United States smartphone market 45.
However, the introduction of the Apple iPhone in 2007 and the subsequent proliferation of Android devices fundamentally shifted the market's definition of mobile value. Consumers increasingly prioritized large touchscreen interfaces, full web browsing capabilities, and expansive third-party application ecosystems over physical keyboards and enterprise security 645. BlackBerry executives severely misjudged this paradigm shift, viewing the iPhone as a flawed consumer toy with poor battery life, and insisting that their core corporate demographic would never abandon physical messaging devices 4659.
By failing to innovate its hardware form factors and stubbornly relying on restrictive, aging operating systems, BlackBerry alienated the emerging third-party developer community. This created a destructive feedback loop: a lack of modern applications drove consumers away, which further disincentivized developers from building for the platform 46. Over time, the comparative added value of BlackBerry's devices turned negative, completely eroding its once-dominant product-market fit and reducing its global market share to a fraction of a percent before it was forced to exit the hardware manufacturing business entirely 64546.
Conclusion
Achieving product-market fit is a rigorous, time-intensive process that defies simple shortcuts or heavy capital subsidies. The empirical evidence demonstrates that successful founders typically endure 18 to 24 months of iterative learning, prototype development, and market validation before achieving sustainable organic demand. Quantitative metrics such as Net Revenue Retention exceeding 110 percent, capital efficient burn multiples, and rapid month-over-month revenue growth serve as the ultimate arbiters of success, separating genuine market pull from artificially engineered traction.
As the technology landscape matures - marked by the end of the zero-interest-rate environment, the saturation of legacy software markets, and the rapid rise of capital-intensive generative AI - the bar for establishing initial market viability has risen considerably. Ventures can no longer afford to launch unvalidated, low-quality minimum products into the market. Ultimately, product-market fit remains a dynamic continuum. It must be rigorously discovered through early, empathetic customer engagement, aggressively scaled through efficient capital deployment, and continuously defended against technological obsolescence and shifting consumer behaviors.