How AI Trading Differs from Technical Analysis
Artificial intelligence shifts trading from a retrospective, linear analysis of price charts into a real-time, multidimensional system capable of processing vast alternative datasets without emotional bias. While advanced machine learning models dynamically adapt to new market regimes and consistently outperform traditional technical indicators in empirical trials, they introduce severe new hazards such as backtest overfitting and algorithmic monocultures. Ultimately, while AI democratizes sophisticated analytical tools for retail traders, the underlying execution advantages of latency, colocation, and proprietary data ensure that institutional players continue to dominate the modern financial landscape.
The Mathematical Divide: Linear vs. Non-Linear Modeling
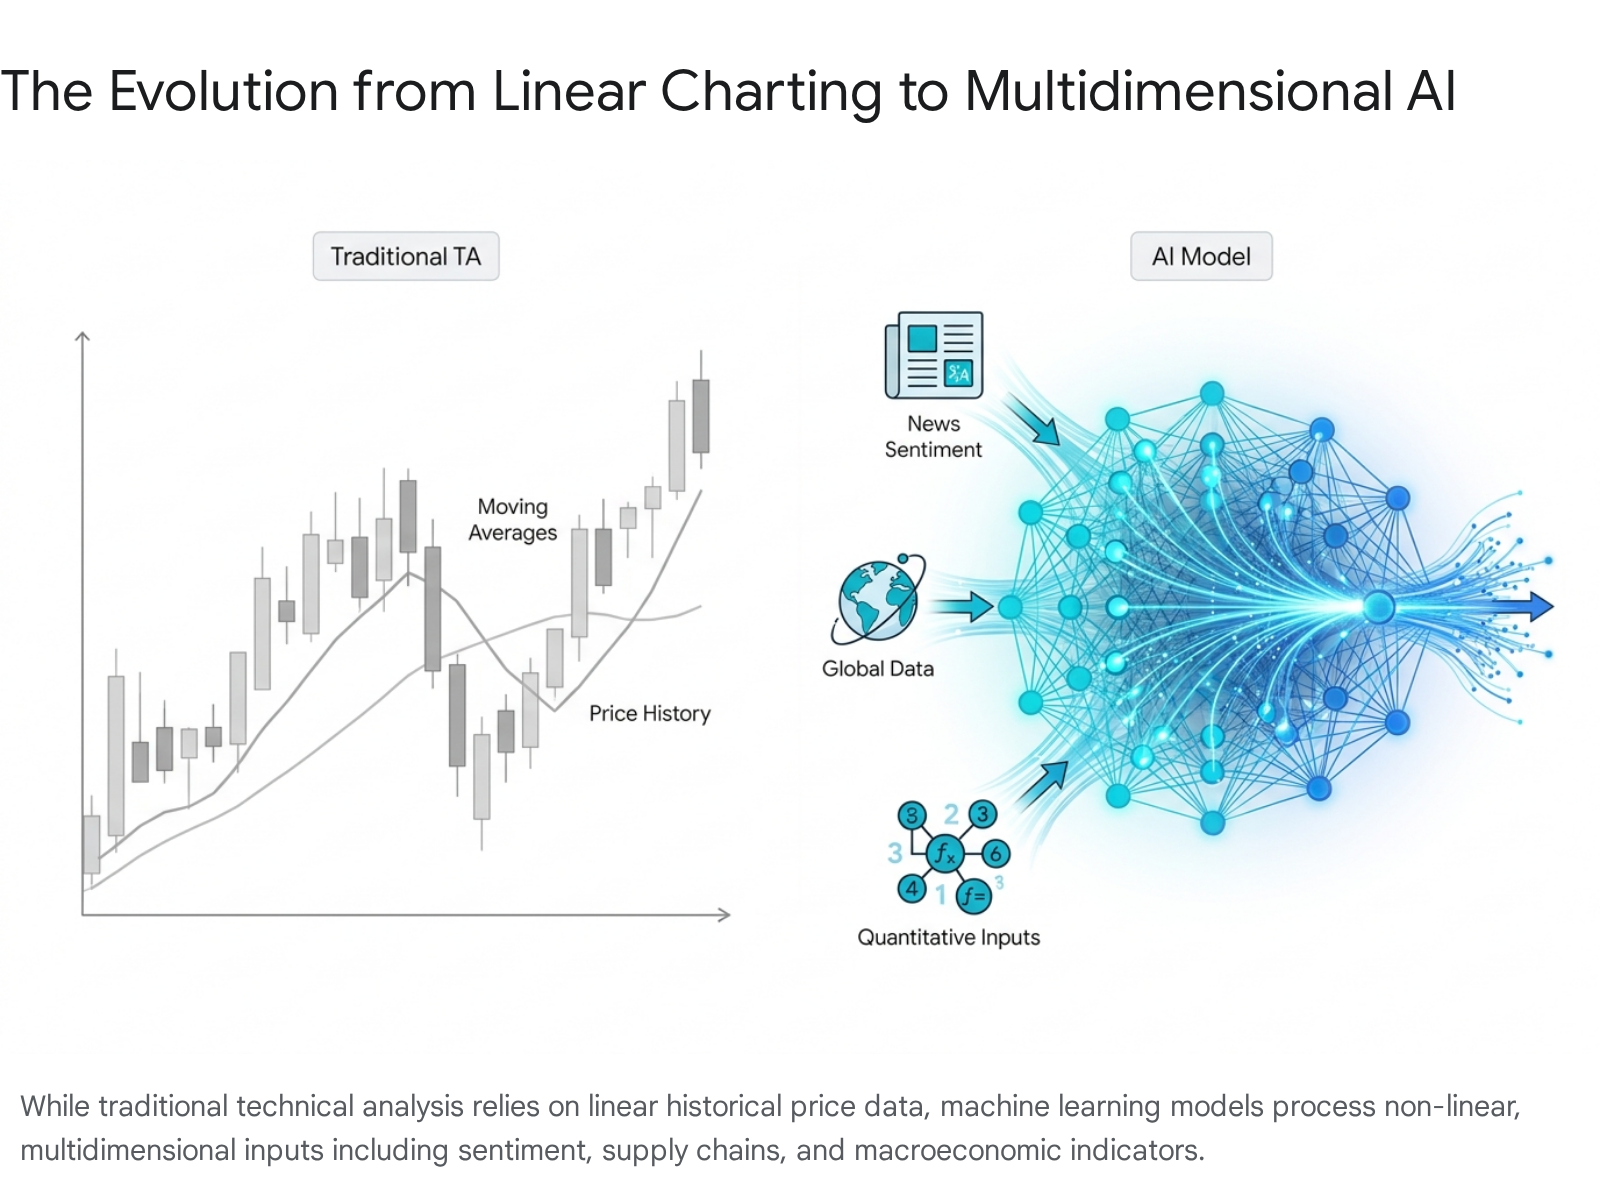
To understand the practical differences between artificial intelligence and traditional technical analysis, one must first understand the fundamental mathematical divergence between linear and non-linear modeling. For decades, the foundation of quantitative and algorithmic trading for the average market participant has rested on technical analysis. This methodology is fundamentally an exercise in linear abstraction and historical extrapolation.
The Limitations of Linear Charting
Indicators such as Simple Moving Averages (SMA), Exponential Moving Averages (EMA), the Moving Average Convergence Divergence (MACD), and the Relative Strength Index (RSI) rely on fixed mathematical formulas applied exclusively to historical price and volume data. A linear relationship is one where a change in an independent variable yields a proportional change in a dependent variable, often expressed mathematically as a straight line 123.
The core assumption of traditional technical analysis is that market patterns repeat in a linear, predictable fashion. If a 50-day moving average crosses above a 200-day moving average, creating the classic "golden cross," the linear assumption dictates that upward momentum will predictably persist. Because these models are easy to implement and mathematically straightforward, they are highly interpretable 4. A trader can look at an RSI reading of 80 and instantly deduce that an asset is statistically overbought according to that specific formula.
However, linear models are inherently limited because they cannot easily account for the complex, interactive web of variables that drive modern financial markets. Financial markets are deeply non-linear ecosystems heavily influenced by geopolitical events, sudden macroeconomic data releases, shifting monetary policy, and human psychology 15. When a market transitions abruptly from a low-volatility trending regime to a highly volatile sideways regime, traditional trend-following indicators and mean-reversion tools routinely generate false signals, leading to substantial drawdowns 67.
The Non-Linear Paradigm of Machine Learning
Artificial intelligence, specifically through machine learning architectures like Long Short-Term Memory (LSTM) neural networks, Random Forests, and Gradient Boosting algorithms (e.g., XGBoost), fundamentally alters this paradigm. Machine learning operates on the premise of non-linear modeling. Rather than drawing a straight line or applying a static formula to past data, non-linear models identify complex, hidden dependencies across hundreds or thousands of variables simultaneously, creating relationships that cannot be graphed on a simple two-dimensional plane 156.
Finding the best parameters for a non-linear model is significantly more computationally intensive than finding the slope of a linear regression. Non-linear regression relies on an iterative process, where algorithms start with baseline assumptions and continuously refine their parameters over millions of steps to minimize forecasting errors 8. This allows machine learning systems to adapt dynamically to shifting market conditions. Instead of relying on a rigid rule, an AI model can detect when a market regime has changed and instantly adjust its predictive weighting, capturing temporal dependencies and complex correlations that human analysts simply cannot visualize 56.
The distinction between these two approaches can be summarized across several core dimensions of market analysis.
| Feature | Traditional Technical Analysis | AI & Machine Learning Trading |
|---|---|---|
| Mathematical Basis | Linear regression and static mathematical formulas (e.g., averages, standard deviations) 13. | Non-linear optimization, neural networks, and iterative parameter refinement 18. |
| Primary Data Inputs | Exclusively historical price action and trading volume data 9. | Multidimensional inputs including alternative data, macroeconomic indicators, and textual sentiment 62. |
| Adaptability | Rigid. Strategies fail abruptly when transitioning from trending to ranging markets 67. | Highly adaptive. Models continuously update probability weights based on real-time regime shifts 611. |
| Interpretability | High. Traders can easily understand why an indicator triggered a specific signal 4. | Low. Deep learning models often function as "black boxes" with hidden decision-making logic 1213. |
Does AI Actually Outperform Human Technical Analysis?
Theoretical mathematical superiority does not always translate to live market profitability. However, empirical studies tracking the performance of advanced artificial intelligence models against traditional technical analysis baselines reveal a stark performance gap in highly volatile asset classes.
Evidence from Cryptocurrency Markets
Cryptocurrency markets present an ideal testing ground for algorithmic trading due to their 24/7 continuous operation, massive data availability, and extreme volatility driven by retail sentiment. In early 2024, researchers José Ángel Islas Anguiano and Andrés García-Medina conducted a robust study testing whether machine learning could navigate the wild volatility surrounding the approval of the first U.S. spot Bitcoin ETFs better than traditional charting methods.
The researchers divided Bitcoin price data into a pre-ETF training period (2021 - 2024) and a post-ETF testing period, simulating a major market regime change. They deployed advanced machine learning models (LSTM and LightGBM) against classic technical analysis strategies (EMA crossovers and MACD combined with the Average Directional Index). The results decisively favored artificial intelligence. The LSTM network achieved a cumulative return of 65.23%, vastly outperforming the LightGBM model (53.38%). Both machine learning architectures eclipsed traditional technical analysis, with the MACD strategy returning 35.45% and the EMA crossover strategy netting just 26.07% 14.
These findings are corroborated by broader industry data; a separate study analyzing AI-driven Bitcoin strategies from 2018 to 2024 demonstrated an astonishing 1640% total return, significantly outpacing standard buy-and-hold approaches 3. Beyond individual trading performance, the integration of AI is actively altering the efficiency of the cryptocurrency market itself. Following the launch of ChatGPT in late 2022, empirical data reveals that sectors related to Generative AI and AI Big Data within the crypto ecosystem began exhibiting far greater market efficiency. As algorithms assimilate information faster, these specific assets demonstrate more robust price discovery during both bull and bear markets, supporting the Adaptive Market Hypothesis which posits that market efficiency evolves dynamically over time 4.
Evidence from the Global Forex Market
The foreign exchange (forex) market is the largest financial ecosystem in the world, processing roughly $6.6 trillion in daily trading volume 5. It is heavily influenced by non-linear macroeconomic, political, and geopolitical factors, making it a notoriously difficult environment for retail traders - statistics indicate that only 2% of retail participants successfully predict currency movements over the long term 5.
In response to the limitations of conventional forecasting, researchers have systematically tested AI against traditional econometric and technical models in the forex arena. Studies evaluating currency pairs such as the EUR/USD and GBP/USD between 2014 and 2025 consistently demonstrate that LSTM models capture the complex temporal dependencies of currency time-series data far better than traditional linear regression baselines 217. In one comprehensive study forecasting European currencies (the Euro, British Pound, Swiss Franc, and Swedish Krona) across a 15-year dataset ending in January 2025, researchers found that tree-based ensemble methods, specifically Random Forest algorithms, provided the most robust and highly effective predictive performance 5196.
These studies suggest that integrating deep learning architectures with macroeconomic variables - such as inflation data, interest rate differentials, and GDP growth - creates hybrid models that thoroughly eclipse the predictive capabilities of isolated technical charting 2.
What Role Does Alternative Data Play in AI Trading?
The second major pillar differentiating modern AI trading from traditional technical analysis is the scope and ingestion of external information. Traditional technical analysis assumes that all known public information is instantaneously priced into the chart; therefore, the only data worth analyzing is price and volume. AI algorithms discard this assumption, relentlessly pursuing "alternative data."
Alternative datasets consist of non-traditional, highly granular, and often unstructured information that provides real-time microeconomic insights before they are reflected in quarterly earnings reports or market prices 921. Machine learning architectures - particularly natural language processing (NLP) and computer vision models - are uniquely equipped to clean, structure, and analyze these massive data pipelines at scale.
Hedge funds and institutional asset managers view alternative data as the ultimate source of alpha generation. In 2025, institutional spending on alternative data reached $2.8 billion, a 17% year-over-year jump, and industry projections suggest total spending could accelerate to $23 billion by the end of the decade as AI tools make ingestion faster and more cost-effective 7. The application of this data falls broadly into three major categories.
Satellite Imagery and Supply Chain Mapping
Computer vision algorithms analyze high-resolution satellite imagery to generate objective, real-time metrics regarding physical economic activity. By counting the number of cars in retail parking lots, algorithms can accurately forecast quarterly consumer revenue long before a company issues guidance 23. Similarly, by monitoring global shipping movements, port activity, and crop yields, hedge funds can map highly complex supply chain dependencies 923.
In a notable historical example, investors successfully utilized alternative data tracking corporate jet movements to predict Warren Buffett's major investment in Occidental Petroleum before any public disclosures were made 923. Today, this technology is deployed at a massive scale across global trade hubs. For instance, alternative data analytics tracking Chinese outward foreign direct investment and industrial commodity imports have successfully identified the ASEAN region - specifically nations like Thailand, Malaysia, and Indonesia - as the primary recipients of global supply chain reconfigurations and rerouted trade flows, providing investors with immense predictive advantages 2189. Asset managers utilize platforms like Descartes Datamyne, which processes granular import and export data across 230 markets, to uncover these hidden geographical shifts in manufacturing dominance 26.
Natural Language Processing and Sentiment Analysis
Financial markets are driven by human psychology as much as they are by fundamental economics. Modern AI systems utilize advanced NLP models, such as FinBERT, to constantly read and interpret millions of social media posts, news articles, press releases, and earnings call transcripts in milliseconds 6923.
These models do not simply look for keywords; they understand semantic context, tone, and the underlying emotional valence of the market. By quantifying public sentiment on platforms like Reddit or X, algorithms can gauge shifts in consumer preferences and anticipate dramatic price movements, famously demonstrated during the retail meme-stock frenzies surrounding GameStop and AMC Entertainment 923. Quantitative researchers note that sophisticated social media sentiment analysis can achieve forecast accuracies as high as 87% under specific conditions, providing a massive informational edge over traders relying solely on lagging technical indicators 23.
Web Traffic and Digital Engagement Metrics
In an increasingly digital economy, a company's web traffic and app download velocity serve as direct proxies for consumer demand. AI tools process anonymized mobile device location data, software development kit (SDK) analytics, and web crawling metrics to evaluate corporate performance 92123.
For example, in the highly competitive Chinese technology sector, institutional investors have pivoted away from backward-looking financial metrics, instead relying on real-time mobile engagement data to decode sectoral shifts. Analytics firms tracking over 1.4 billion active devices discovered a massive surge in engagement for generative AI applications like Doubao, allowing them to predict revenue growth and stock performance for AI-themed equities long before traditional analysts updated their earnings models 10.
Why Do "Perfect" AI Trading Systems Fail in Live Markets?
Given the undeniable empirical evidence supporting AI's analytical superiority and its access to profound alternative data, a paradox emerges: if these systems are so powerful, why do so many algorithmic traders consistently lose money? According to extensive research, including a 2025 Stanford study, up to 58% of retail algorithmic strategies collapse and begin hemorrhaging capital within just three months of being deployed into live markets 7.
The answer lies in the invisible traps of quantitative modeling, the foremost being the lethal illusion of backtest overfitting.
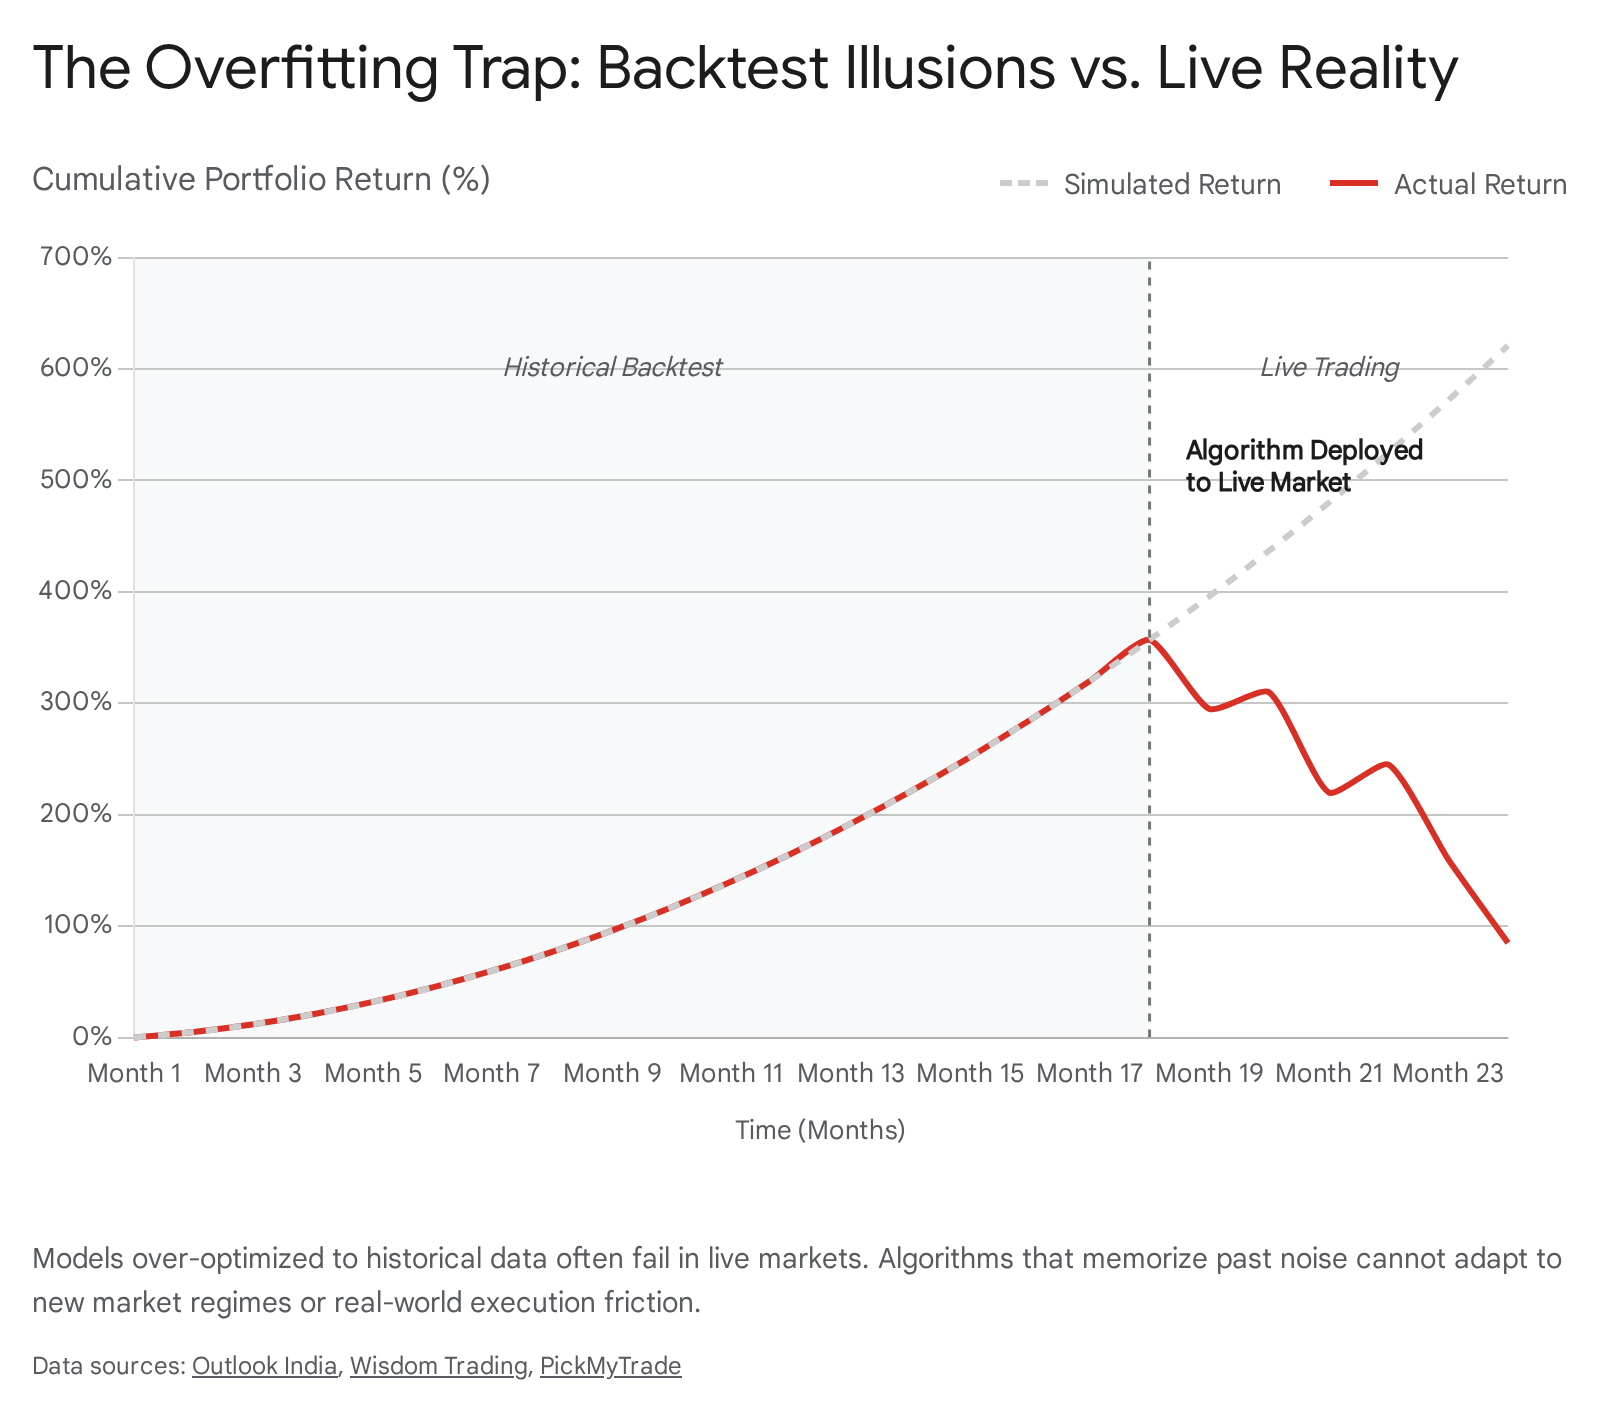
The Trap of Backtest Overfitting
In machine learning, overfitting occurs when an algorithm memorizes the specific noise, quirks, and random variations of its historical training data rather than learning the underlying, generalizable market patterns 112912. Because modern AI models possess immense computational power, they can easily find spurious, coincidental correlations in historical datasets.
If a retail trader provides a deep learning model with thousands of parameters and commands it to maximize returns over a specific five-year window (for example, the low-volatility equity bull market of 2014 to 2019), the AI will generate a highly complex, convoluted set of rules that prints money in a simulation. The in-sample backtest will look flawless. However, because the algorithm's rules are perfectly tailored to the specific historical noise of that past era, the model becomes exceedingly fragile 29.
The moment this overfitted algorithm is deployed into a live market and encounters unseen data or a shifting macroeconomic regime - such as the sudden inflation shocks of 2022 or unexpected geopolitical conflict - its predictions become completely worthless. The strategy fails catastrophically because the market behavior it memorized no longer exists 13112913.
The Multiple Testing Problem
The proliferation of accessible AI tools has actually exacerbated the overfitting problem. Historically, quantitative analysis required human patience and extensive coding, inherently limiting the number of strategy variations a team could test. Today, a retail trader using AI can test thousands of parameter combinations in minutes.
This introduces the "Multiple Testing Trap." Basic probability dictates that if a trader runs 50 variations of a moving average crossover system on historical data, the statistical probability that at least one combination will appear highly profitable entirely by random chance exceeds 92% (assuming a 95% confidence interval) 7. Testing vast quantities of parameters mathematically guarantees that some will look exceptional due to pure noise. When these "lucky" strategies are moved to a live environment, their lack of genuine structural edge is rapidly exposed, resulting in swift and severe financial losses 732.
Furthermore, retail backtests frequently ignore the punishing realities of execution friction. A backtest might generate a high Sharpe ratio assuming frictionless trades, but in the real world, bid-ask spreads, exchange fees, and execution slippage systematically erode these apparent opportunities. Institutional audits of cryptocurrency perpetual futures strategies repeatedly show that when funding costs and realistic slippage are factored into a backtest, the promised alpha drastically compresses or vanishes entirely 73214.
Epistemic Calibration: The Power of Abstention
To defend against regime shifts and overfitting, elite institutional AI models rely on a concept known as calibrated uncertainty. Human traders and novice algorithms tend to operate with absolute confidence; if the parameters align, they execute the trade regardless of broader contextual shifts.
Sophisticated machine learning systems, however, are engineered to recognize their own epistemic uncertainty - they know when they do not know. If an algorithm detects that current market volatility or cross-asset correlations have deviated significantly from its training data, its confidence intervals widen. Rather than forcing a trade, a properly calibrated meta-controller implements "abstention" protocols 3415. It may dynamically reduce position sizing for the most uncertain predictions or completely halt trading until market behavior returns to a recognizable state 34.
The financial market overwhelmingly rewards confident recommendations, but the quantitative entities that survive across decades understand that rigorous forecasting requires the structural capacity to abstain from chaotic data 1536.
Can Retail Investors Actually Compete With Wall Street?
A pervasive narrative surrounding financial technology suggests that AI is democratizing the stock market, breaking Wall Street's monopoly on sophisticated analytics. By 2024, algorithmic trading accounted for nearly 65% of U.S. equity trading volume, with the global algorithmic market projected to reach $28.4 billion by 2030 as retail adoption expands rapidly 1638. Individual investors now utilize cloud infrastructure, generative language models for rapid coding, and user-friendly platforms to deploy sophisticated algorithms from their laptops 1638.
However, the democratization of analytical software does not equate to the democratization of market infrastructure. A profound, structural divide persists, and institutional players continue to control approximately 70% to 90% of daily trading volume 16174018.
The Democratization Myth vs. Infrastructure Reality
The gap between retail and institutional participants is no longer primarily about who possesses the smartest algorithm; it is fundamentally an arms race centered on infrastructure, latency, and data quality.
Institutional high-frequency trading (HFT) firms invest heavily in physical co-location services, placing their proprietary servers directly inside exchange data centers alongside specialized Field Programmable Gate Array (FPGA) chips and dedicated fiber-optic connections. This allows their algorithms to execute trades in microseconds or nanoseconds 16. Even if a retail AI bot is brilliant, it typically relies on cloud-based or local internet execution. By the time a retail signal traverses the public internet to reach the exchange, an institutional algorithm has already consumed the available liquidity, leaving the retail trader to execute at a less favorable price (slippage) 163842.
| Trading Capability | Institutional Quantitative Funds | Retail AI Traders |
|---|---|---|
| Execution Latency | Microseconds to nanoseconds via exchange co-location and dedicated fiber connections 16. | Milliseconds to seconds via cloud servers and standard internet routing 1638. |
| Market Routing | Direct market access (DMA), dark pools, and bespoke block trading venues 1617. | Standard market hours via retail brokerages, often subject to Payment for Order Flow 17. |
| Data Quality & Cost | Millions spent annually on proprietary alternative data, real-time tick history, and exclusive research 71617. | Dependent on basic, delayed, or generalized open-source data streams with limited analytical depth 1617. |
| Execution Friction | Negotiated, ultra-low fee structures (often fractions of a percent) enabling high-frequency strategies 1618. | Wider bid-ask spreads and cumulative platform costs that create a high mathematical hurdle for profitability 1718. |
The 27-Year Survival Study and the Four-Phase Spiral
The ultimate test of any trading paradigm is long-term survival. Despite the influx of advanced retail tools, historical failure rates remain remarkably persistent. A massive longitudinal study conducted by AI trading lab PiP World analyzed 28 years of continuous trading data (1998 - 2025) covering 8 million retail traders and 295 million individual trades across multiple market crashes and interest-rate cycles. The findings were staggering: across almost three decades, 74% to 89% of retail traders consistently lost money 43.
The study isolated trader behavior from macroeconomic events and discovered that human failure is highly systematic. A remarkable 85% of failed accounts followed an identical, predictable behavioral pattern labeled the "four-phase spiral": 1. Cautious Success: The trader applies rules methodically, achieving early wins. 2. Overconfidence Formation: The trader mistakes structural market luck for personal genius, slowly increasing leverage and risk exposure. 3. Catastrophic Loss: A sudden market regime shift occurs, resulting in a severe, unexpected portfolio drawdown. 4. Terminal Decline: Under psychological pressure, all discipline evaporates. The trader widens stop-losses, chases losses out of desperation, and executes impulsive trades until the account is entirely wiped out 43.
AI trading platforms offer retail investors a theoretical defense against this spiral. Because an algorithm is devoid of emotion, it does not experience fear during drawdowns, nor does it revenge-trade at two in the morning 194546. It strictly adheres to pre-programmed risk management protocols. However, if the underlying retail strategy is poorly backtested or relies on inadequate infrastructure, removing human emotion simply allows the software to lose money systematically rather than impulsively.
Furthermore, retail traders exhibit unique behavioral patterns that disadvantage them against institutions. A 2025 study published in the Journal of Financial Economics, titled "The Retail Habitat," revealed that retail investors consistently gravitate toward stocks that are inherently difficult to value - companies with massive intangible assets, long cash-flow durations, and high risks of mispricing. Sophisticated institutional algorithms frequently avoid these specific stocks because their prices do not respond rationally to fundamental information, essentially leaving retail traders to fight among themselves in highly volatile, unpredictable arenas 47.
How Is AI Reshaping Global Market Ecosystems?
As AI-driven systems process nearly 89% of global trading volume, their influence has transcended basic execution mechanics; artificial intelligence is actively restructuring the macroeconomic gravity of the market itself 320.
The AI Supercycle and Asian Equities
The sheer scale of capital required to build the infrastructure of the AI era is unprecedented. Asset management giants like BlackRock estimate that scaling transformational infrastructure - including data centers, advanced cooling systems, and specialized power grids - will require $3.5 trillion in new capital every year throughout the decade, with total AI-related capital expenditures potentially reaching $8 trillion by 2030 2150.
This massive influx of capital has created a distinct divergence in global equity markets, particularly in Asia. Markets heavily exposed to upstream AI infrastructure and semiconductor manufacturing have surged to record highs. By mid-2026, Japan's Nikkei 225, South Korea's KOSPI, and Taiwan's Taiex experienced historic rallies directly linked to intense global demand for custom silicon and AI hardware 2223.
Conversely, tech-heavy indices that lack upstream hardware exposure have suffered. The Hang Seng Technology Index in Hong Kong, for instance, historically concentrated over 50% of its weighting in downstream, application-focused e-commerce, social media, and electric vehicle companies. While global upstream tech rode the AI supercycle to record heights, the Hang Seng initially slumped, forcing index providers to implement structural pivots to include pure-play AI constituents to capture the thematic momentum 532455. The market dynamics clearly indicate that investors are prioritizing the physical infrastructure of AI over consumer-facing software applications.
Systemic Risks: Monocultures and Hallucinations
The most pressing concern facing modern financial markets is not whether AI will replace human traders, but what happens when AI ecosystems break down.
When human, discretionary traders dominate a market, diverse opinions naturally provide liquidity. One trader's panic selling serves as another trader's value-buying opportunity. However, as the financial industry consolidates around a few highly advanced, proprietary foundation models trained on identical alternative datasets, markets risk developing a dangerous "algorithmic monoculture" 1325. If multiple deep learning networks arrive at the exact same conclusion regarding a macroeconomic shock and attempt to exit positions in the same millisecond, the market can experience catastrophic, self-reinforcing feedback loops, triggering sudden, uncontrollable volatility spikes reminiscent of the 2010 Flash Crash 134225.
Furthermore, regulatory bodies and major institutions, including J.P. Morgan and the International Monetary Fund (IMF), have issued stark warnings regarding the integration of Generative AI into the critical perimeter of trade execution 57. A 2025 Stanford study noted that large language models (LLMs) hallucinate on complex reasoning tasks at rates exceeding 33%, while separate research found LLMs hallucinate in up to 41% of finance-related queries 57. If a trading system misinterprets a geopolitical news headline and generates flawed trading logic, it can execute thousands of erroneous orders in a fraction of a second. In an era where algorithms operate autonomously, these invisible software errors can inflict hundreds of millions of dollars in losses before human oversight can manually sever the connection 5758.
Bottom line
Artificial intelligence fundamentally alters the trading landscape by replacing the retrospective, linear rules of technical analysis with dynamic, non-linear models that continuously adapt to multidimensional alternative data. While this evolution eradicates the psychological spiral of human emotion and offers significant predictive advantages, it simultaneously introduces perilous new technical risks, most notably the devastating impact of backtest overfitting and algorithmic monocultures. Retail traders have gained unprecedented access to sophisticated analytical software, but until the structural disparities in latency, execution infrastructure, and data quality are resolved, the true edge in global financial markets will remain firmly in the hands of institutional institutions.