Federal Reserve policy and late-stage technology IPO valuations
Macroeconomic Environment and Venture Capital Liquidity
The intersection of central bank monetary policy and private capital markets has reached a highly complex juncture in 2026. Following a prolonged period of liquidity constraints and valuation resets that began at the end of the zero-interest-rate policy (ZIRP) era, the initial public offering (IPO) window exhibits signs of reopening. However, this recovery is characterized by unprecedented market bifurcation and extreme capital concentration, rather than a broad-based return to historical issuance volumes 123. The swearing-in of Kevin Warsh as Chairman of the Federal Reserve has introduced a new macroeconomic paradigm, shifting market expectations away from the easing bias maintained by his predecessor 4.
The transition in Federal Reserve leadership coincides with structural transformations within the technology sector. The rapid industrialization of artificial intelligence (AI) has heavily segmented the venture-backed ecosystem. AI infrastructure and frontier model developers command historic valuations and massive capital inflows, while traditional enterprise software companies face severe multiple compression due to the emergence of autonomous AI agents 45. Concurrently, venture capital limited partners (LPs) are experiencing a severe liquidity drought. The median distribution-to-paid-in (DPI) multiple for North American fund vintages over the past decade remains below 1.0x, placing immense pressure on general partners to secure exit events 12.
This environment creates a highly complex calculus for late-stage technology companies preparing for public market debuts. Issuers must navigate a monetary posture that elevates the risk-free rate, directly impacting discounted cash flow (DCF) models, while simultaneously positioning their narratives to align with the stringent demands of public market investors who prioritize durable profitability and AI-defensibility over pure revenue growth 37. Geopolitical fragmentation has additionally initiated a regional divergence in listing venues, with regulatory and national security constraints dictating where strategic technology assets can access public capital 8610.
Aggregate data reflects this constrained reality. Global venture funding in 2025 reached $425 billion across more than 24,000 private companies, positioning the year as the third-highest venture financing year on record 11. The aggregate value of US unicorns expanded to $4.3 trillion, driven largely by massive late-stage AI valuations 7. Yet, the median time between venture rounds has steadily increased since 2022, and nearly 25% of US venture rounds in 2024 were structured as flat or down rounds, representing a decade high 8.
Warsh-Era Federal Reserve Monetary Policy
The appointment of Kevin Warsh as Federal Reserve Chairman marks a substantive rhetorical and operational departure from the monetary policy framework of the preceding several years. Financial markets have rapidly recalibrated expectations regarding the trajectory of the federal funds rate and the management of the central bank's balance sheet.
Federal Funds Rate and Inflation Metrics
In his initial public remarks, Chairman Warsh struck a distinctly hawkish tone regarding the inflation outlook, explicitly removing the "easing bias" language that had telegraphed the central bank's inclination toward future rate reductions 4. By suggesting that a rate increase is statistically just as likely as a rate cut, the Federal Reserve reasserted its commitment to price stability. This posture initially disappointed market participants who had anticipated a dovish approach aligned with political desires for the lowest possible interest rates, resulting in immediate upward pressure on the US Dollar Index (DXY), which rose to 99.34, and a corresponding pullback in safe-haven assets such as gold and highly leveraged equities 4915.
The Warsh doctrine integrates the macroeconomic impact of artificial intelligence into monetary policy. Warsh maintains that the rapid adoption of artificial intelligence constitutes a massive, structural disinflationary force 9. By driving labor productivity higher, AI adoption theoretically allows the economy to sustain elevated nominal wage growth - running near 4% annually - without breaching the Federal Reserve's 2% inflation target . To track this phenomenon, Warsh relies heavily on trimmed mean inflation metrics, such as the Dallas Fed trimmed mean PCE and the Cleveland Fed 16% trimmed mean CPI, which trended lower than traditional core PCE entering 2026 . If AI-driven productivity gains materialize at scale, this framework suggests the Federal Reserve could eventually accommodate lower short-term policy rates. However, persistent core inflation readings and high energy prices complicate this potential easing timeline 91710.
Quantitative Tightening and Balance Sheet Reduction
While the trajectory of the federal funds rate remains data-dependent, the Warsh administration has signaled a definitive commitment to aggressive balance sheet reduction. The Federal Reserve's portfolio, which expanded to nearly $9 trillion during pandemic interventions, sits at approximately $6.7 trillion as of mid-2026 9. Warsh views this balance sheet size as an excessive intervention in financial markets that distorts natural price discovery.
The acceleration of quantitative tightening (QT) - whether through the passive roll-off of maturing Treasuries and mortgage-backed securities or active asset sales - mechanically removes liquidity from the financial system 917. Critically for corporate valuations, QT increases the supply of long-duration bonds that the private market must absorb. This dynamic naturally applies upward pressure on long-term yields, effectively steepening the yield curve even if short-term policy rates remain static or are slightly reduced 91517. Market consensus suggests Warsh will pursue an environment characterized by dovish short-term policy rates paired with hawkish balance sheet reductions, steepening the curve and heavily impacting discount rates for long-duration assets 17.
Currency Markets and Sovereign Yield Impacts
The divergence between the US Federal Reserve's balance sheet policies and other major central banks - such as the European Central Bank (ECB), which nears the end of its tightening cycle, and the Bank of Japan, which is hiking rates - has profound implications for global capital flows 11. A steeper US yield curve inherently supports the US dollar, making American assets more attractive to global capital 91511.
For international equity markets, this dynamic presents a continuous risk of capital flight. As capital flows toward higher-yielding, dollar-denominated assets, liquidity is drained from emerging markets and alternative listing venues 9. A structurally strong dollar simultaneously poses headwinds for multinational technology companies preparing for public offerings, as repatriated foreign earnings are devalued, potentially dampening top-line revenue growth projections in S&P 500 earnings forecasts 9. Corporate earnings forecasts remain robust despite these headwinds; Goldman Sachs projects S&P 500 earnings per share to grow 24% in 2026, largely powered by AI infrastructure investments offsetting potential currency drags 1213.
Discount Rate Mechanics in Technology Valuations
The primary transmission mechanism between macroeconomic monetary policy and private market valuations operates through the discount rate applied in financial modeling. For late-stage technology companies preparing for an IPO, Discounted Cash Flow (DCF) analysis remains the foundational methodology utilized by institutional underwriters to determine intrinsic value and establish pricing ranges 71415.
Weighted Average Cost of Capital Formulation
The discount rate in a standard unlevered DCF model is the Weighted Average Cost of Capital (WACC). WACC represents the blended cost of equity and the after-tax cost of debt 152425. For high-growth technology startups, which typically operate with minimal debt to avoid fixed servicing costs during periods of negative cash flow, the WACC is overwhelmingly dictated by the Cost of Equity 25.
The Cost of Equity is calculated utilizing the Capital Asset Pricing Model (CAPM), which adds an equity risk premium (ERP) to the risk-free rate, scaled by the asset's beta, a measure of volatility relative to the broader market 14152526. The yield on the 10-year US Treasury bond serves as the standard proxy for the risk-free rate. Under the Warsh-era policy of aggressive quantitative tightening, upward pressure on the 10-year yield directly and mechanically increases the risk-free rate input 91726.
The beta assigned to late-stage technology companies is typically elevated, frequently modeled between 1.3 and 2.0, reflecting execution risk, unproven unit economics, and inherent sector volatility 725. Any increase in the risk-free rate or the equity risk premium is amplified by this high beta, resulting in an elevated Cost of Equity. Industry benchmarking dictates that mature public software companies are discounted near 10%, high-growth private firms are discounted between 15% and 20%, and early-stage ventures require discount rates of 25% to 40% 252627. Adjustments are also frequently required for modern accounting standards; businesses adhering to IFRS 16 must treat operating leases as financial liabilities, which affects unlevered free cash flow calculations and capital structure weightings 15.
Terminal Value Compression Factors
The elevation of the WACC has an asymmetrical impact on the valuation of high-growth technology companies compared to mature corporations. Technology startups frequently exhibit a financial profile characterized by near-term operating losses from heavy investments in customer acquisition, followed by projected exponential revenue growth in the distant future 2716.
In a DCF model, the explicit forecast period (typically years one through five) often yields a negative or negligible present value. The overwhelming majority of the company's estimated intrinsic value - regularly 70% to 90% - is captured in the Terminal Value, representing the assumed value of all cash flows generated beyond the explicit forecast period 71517.
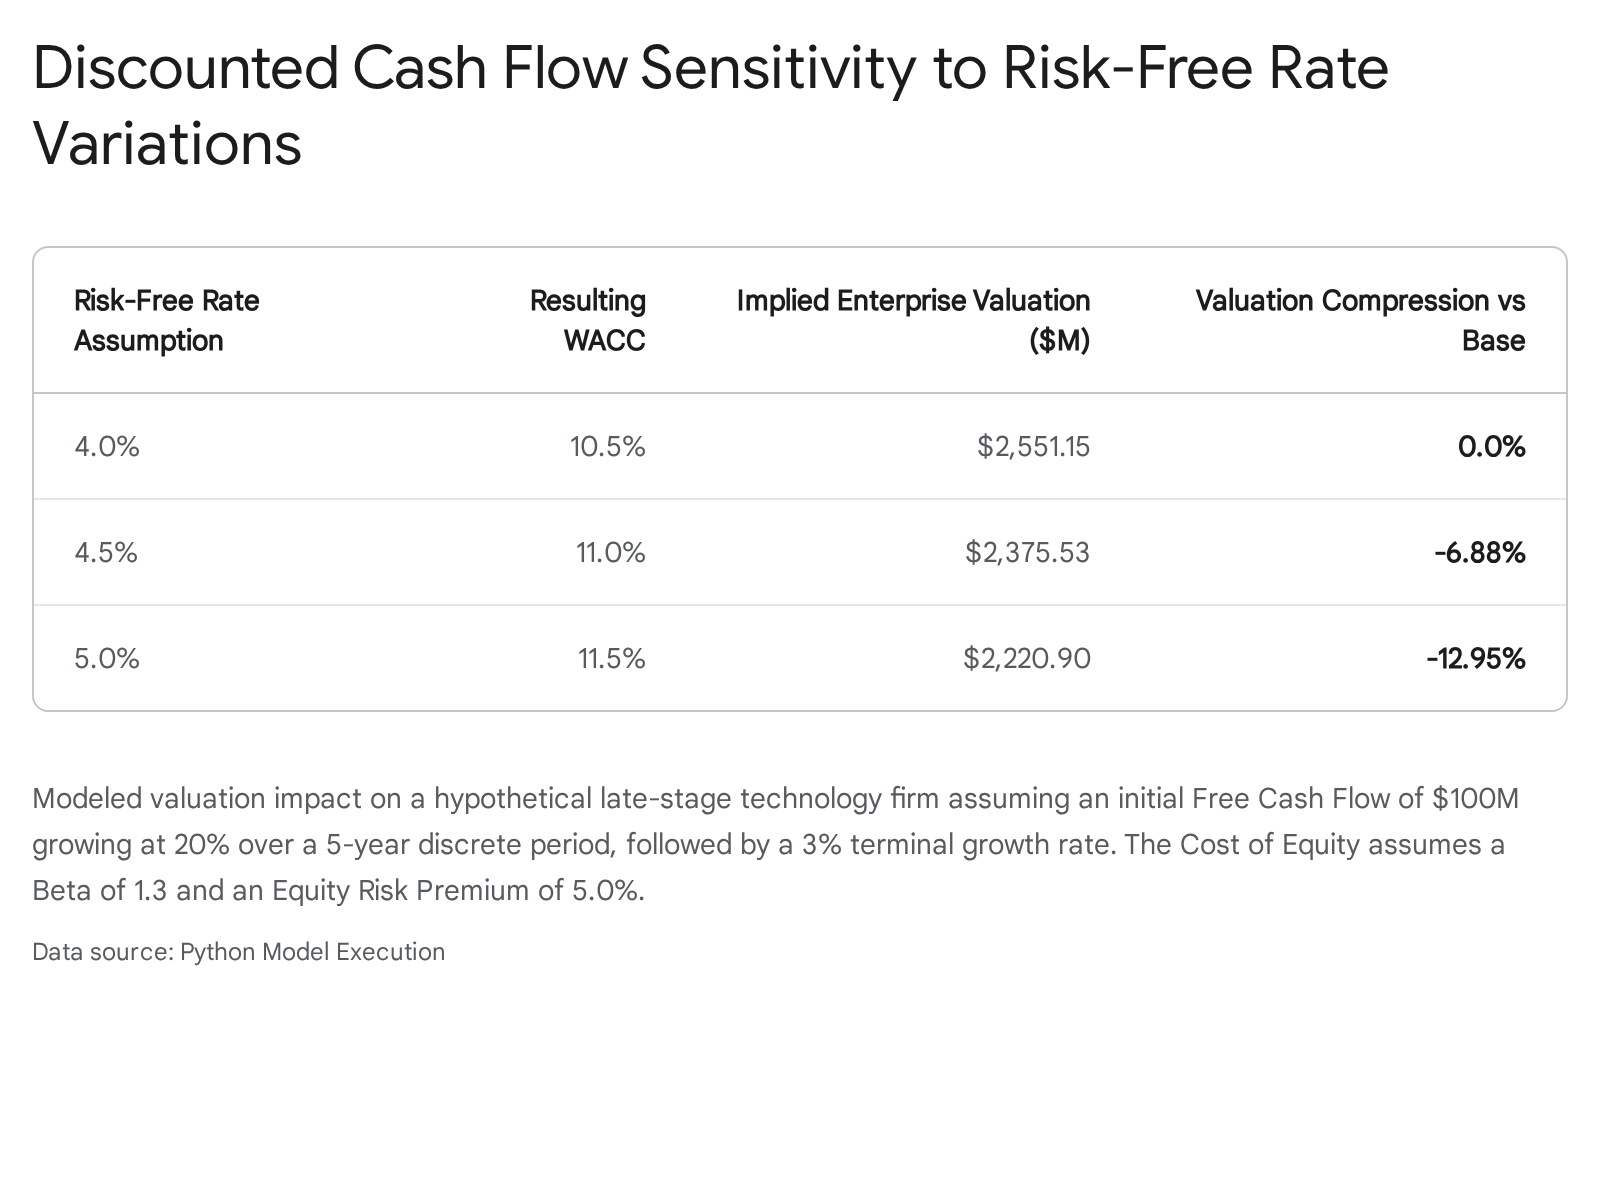
Terminal Value is commonly calculated using the Perpetuity Growth Model, where the final year's projected cash flow is divided by the difference between the WACC and a perpetual growth rate 151718. Best practices require this terminal growth rate to remain below long-term nominal GDP growth 15. Because the WACC dictates the denominator, and the Terminal Value is discounted back to the present over multiple compounding periods, minor upward revisions to the risk-free rate cause exponential compression in the present value of the firm 1415.
Quantitative analysis demonstrates that a movement from a 4.0% to a 5.0% risk-free rate environment - consistent with the steepening yield curve anticipated under rigorous quantitative tightening - compresses a high-growth startup's intrinsic valuation by nearly 13%, holding all operational execution metrics constant .
This mechanical repricing severely complicates IPO feasibility for companies that raised private capital at peak ZIRP-era valuations, as public market underwriters apply contemporary, elevated discount rates.
Alternative Valuation Methodologies
To mitigate the rigid sensitivity of standard DCF models, valuation practitioners increasingly rely on blended approaches. The First Chicago Method has gained prominence for late-stage tech startups; this approach generates three distinct DCF scenarios (optimistic, base, and pessimistic) utilizing varying cash flow assumptions and terminal values derived from exit multiples, rather than perpetual growth 2716. The final valuation is a probability-weighted average of the three scenarios. In an environment defined by high regulatory uncertainty and shifting capital costs, applying heavier probabilistic weights to conservative scenarios allows underwriters to present defensible, risk-adjusted pricing ranges to institutional investors 16. Furthermore, comparable company analysis and precedent transactions are utilized to validate DCF outputs, ensuring that implied revenue and EBITDA multiples align with prevailing public market trading realities 1518.
Software Valuation Contraction and Artificial Intelligence
Valuation methodologies applied by public markets to technology companies experienced a severe dislocation in early 2026. While the broader macroeconomic environment exerted downward pressure on enterprise values, sector-specific technological disruption catalyzed a profound market correction specifically targeting the enterprise software segment.
Autonomous Agent Disruption of Cloud Software
In the first quarter of 2026, the public software sector suffered an event characterized by market participants as the "SaaSpocalypse" 45. The catalyst for this severe repricing was the launch of advanced agentic AI platforms, prominently highlighted by Anthropic's release of Claude Cowork on January 12, 2026. These autonomous systems demonstrated the capability to execute multi-step enterprise workflows without human intervention 5.
The introduction of autonomous AI agents represents a structural threat to the foundational business model of enterprise software. For the past decade, Software-as-a-Service (SaaS) valuations were predicated on predictable, recurring revenue tied strictly to per-seat human licensing models 519. If AI agents successfully automate workflows previously requiring human operators, the aggregate number of human software seats across the enterprise ecosystem will structurally decline. Institutional investors swiftly concluded that the terminal growth rates and revenue durability assumptions embedded in SaaS valuation models were critically impaired.
The resulting multiple compression was historic, resulting in the erasure of approximately $1 trillion in aggregate SaaS market capitalization over a single quarter 45.
| Valuation Metric | Year-End 2024 | Year-End 2025 | Q1 2026 |
|---|---|---|---|
| Median Public SaaS EV/TTM Revenue | 6.2x | 4.9x | 3.3x |
Table 1: Public SaaS Enterprise Value to Trailing-12-Month Revenue Multiples. Data highlights the precipitous decline in software valuation frameworks triggered by AI agent disruption fears. 45
For private market SaaS companies aiming for an IPO, this multiple compression acts as a formidable barrier. Companies that raised venture capital at 15x to 20x annual recurring revenue (ARR) multiples during the 2021 peak cannot reconcile their private valuations with a public market willing to pay a median of 3.3x trailing revenue 45. Consequently, venture-backed SaaS IPO issuance ground to a near-absolute halt in early 2026, evidenced by the withdrawal of previously planned listings 5. By contrast, median M&A enterprise value to EBITDA multiples remained relatively stable across the broader market, resting at 9.7x in early 2026, reflecting acquirer discipline and a return to historical averages 20.
Energy Infrastructure and Capital Expenditure Demands
In stark contrast to application software, valuations for hardware, data center infrastructure, and energy-aligned technology assets are expanding rapidly. This premium is anchored in unprecedented corporate spending. Global data center construction is projected to command nearly $2.9 trillion in capital expenditures through 2028, fueled by sustained compute demand that vastly exceeds supply 21.
Goldman Sachs estimates that the largest US hyperscalers alone will execute over $750 billion in capital expenditures in 2026, representing an 83% to 84% year-over-year increase 1213. Consequently, US data center power demand is projected to scale from 31 gigawatts (GW) in 2025 to 66 GW by 2027, consuming 8.5% of total US peak summer power demand 22. The strain on regional grids is already manifesting in elevated base load costs. In the PJM Interconnection - a grid operator supplying 13 states - the price paid to guarantee generating capacity surged from $28.92 per megawatt-day to $329.17 for the 2026/2027 delivery year, piling $9.3 billion in incremental costs onto the grid 22.
This dynamic acts as a potent inflationary force. Goldman Sachs Research projects that consumer electricity inflation will remain around 6% through 2026 and 2027, boosting headline PCE inflation directly and indirectly 23. Companies providing the physical infrastructure, power generation, and silicon architectures necessary to support this build-out command high premiums, as their capacity constraints guarantee highly durable, collateral-backed cash flows 232425.
Initial Public Offering Pipeline Concentration
The collapse of the traditional software IPO window has exacerbated an already acute liquidity crisis within the venture capital asset class. Institutional limited partners have faced years of capital calls without commensurate distributions. In response, LPs have aggressively curtailed new capital commitments. US venture capital fundraising fell to $66.1 billion in 2025, the lowest total since 2018, and net cash flows to LPs remained deeply negative 7.
The Mega-Cap Technology Issuers
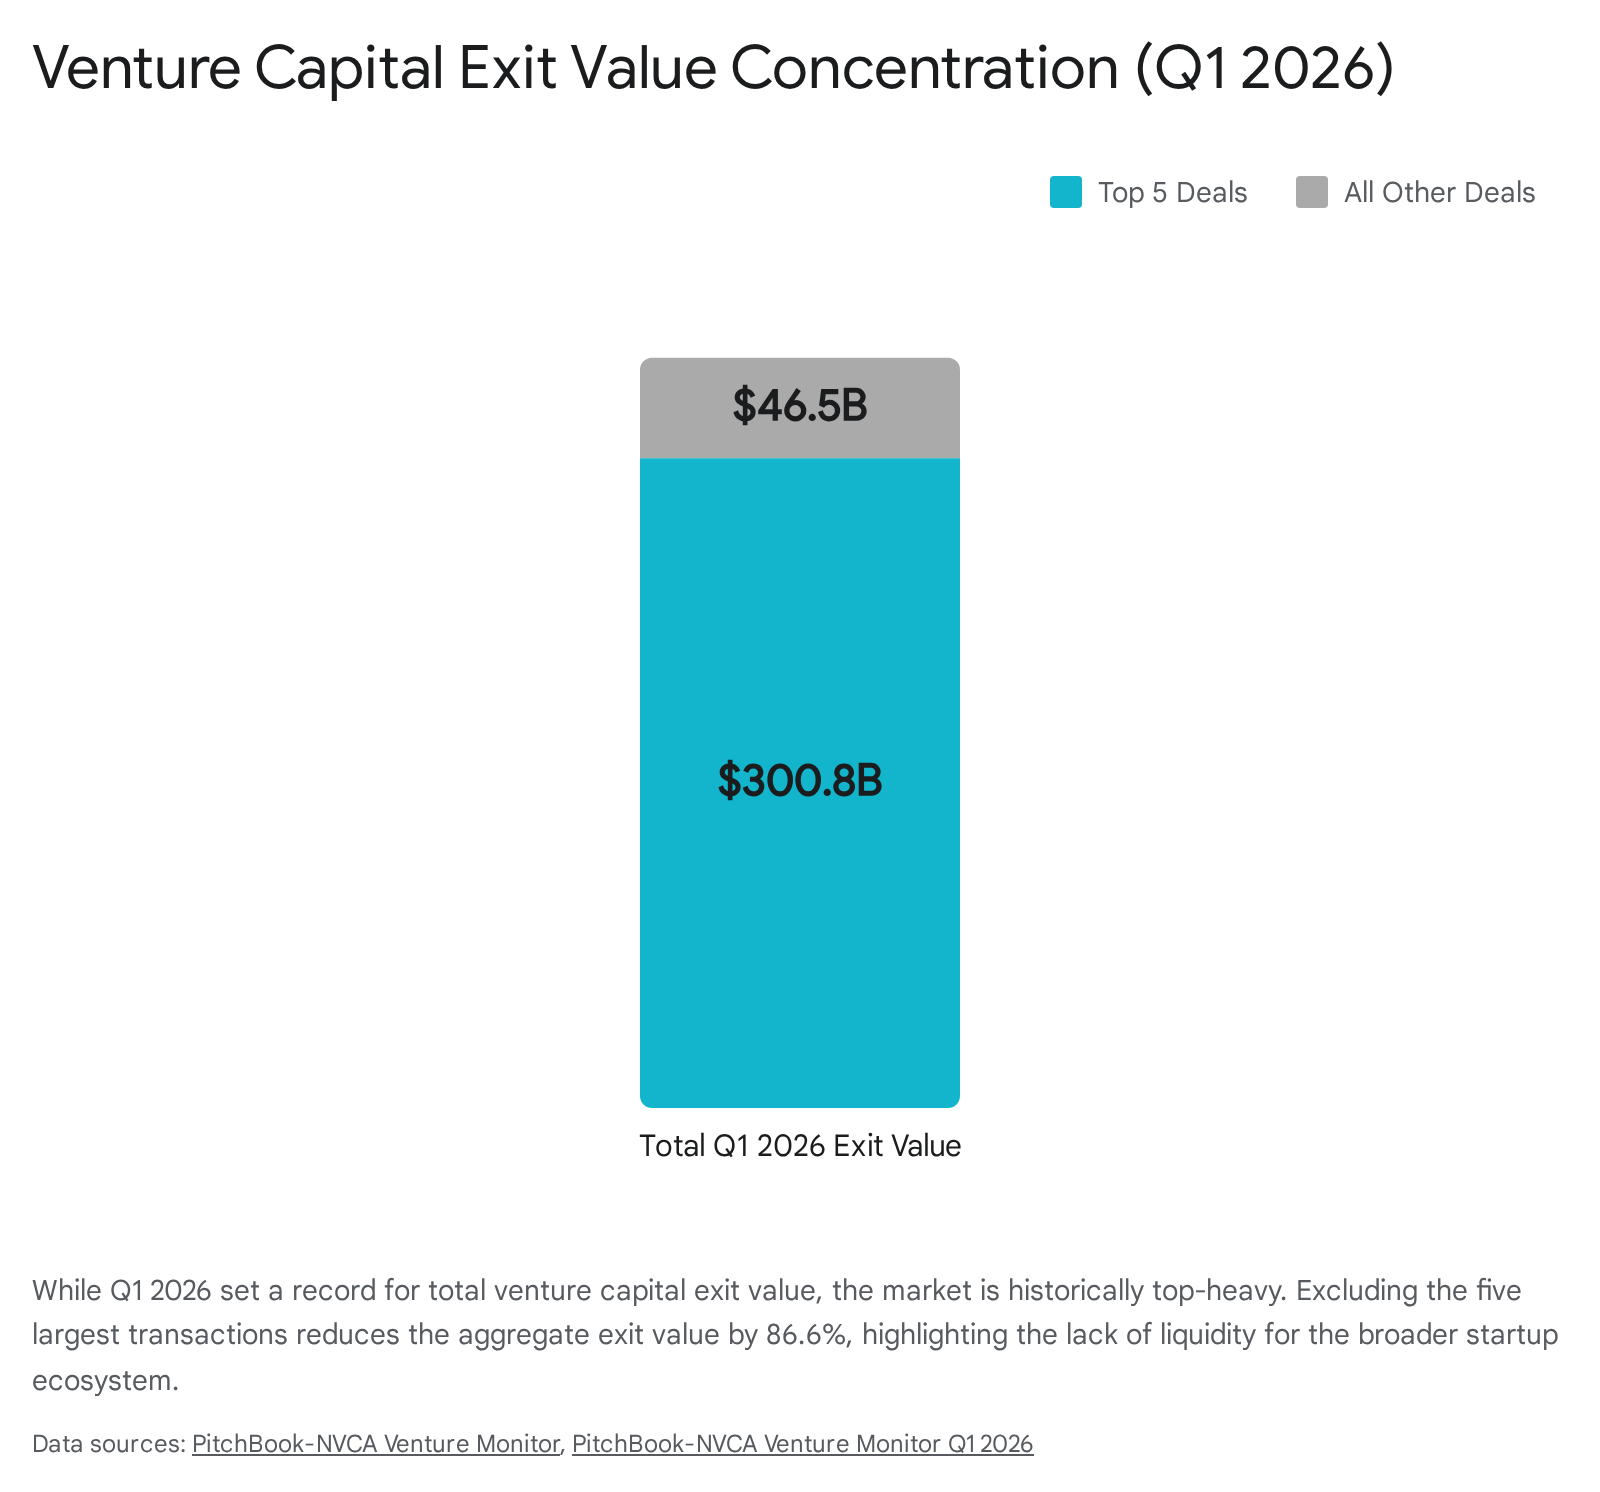
While aggregate headline metrics for venture capital dealmaking suggest a robust recovery, the underlying data reveals extreme fragility masked by a handful of historic outliers. In the first quarter of 2026, the US venture market reported $267.2 billion in deal value and an unprecedented $347.3 billion in exit value 12. However, these metrics are characterized by unparalleled concentration. When the five largest transactions are removed from the dataset, Q1 2026 deal value falls by 73.2%, and aggregate exit value plummets by 86.6% 12.
This concentration is driven entirely by frontier artificial intelligence laboratories and vital national infrastructure companies. The late-stage pipeline is dominated by three primary entities: SpaceX (valued between $400 billion and $1.25 trillion), OpenAI (valued at $840 billion), and Anthropic (valued at $330 billion to $380 billion) 2627.
If these entities execute public listings, they could generate nearly $2.5 trillion in exit value, surpassing the combined value of all venture-backed IPOs in the 21st century 12. The implications are twofold. Successful debuts could serve as catalytic events, releasing trapped capital back to LPs, generating significant underwriting fees, and reigniting market optimism 26. Conversely, the gravitational pull of these listings poses a systemic risk. Listings of this magnitude will absorb vast sums of institutional capital 26. If the market lacks the depth to support these mega-caps alongside traditional mid-cap IPOs, smaller issuers will be crowded out. Furthermore, if any of these frontier firms stumble in aftermarket trading, the resulting chill could definitively seal the IPO window for the broader venture ecosystem through 2027 26.
Financial Profile Shifts for Public Readiness
The operational profile required to execute a successful IPO has undergone a rigorous transformation. During the 1999 technology bubble, the median age of an IPO candidate was five years, and only 17% were profitable 28. By contrast, the post-2001 era saw the median age increase to 11 years, with a heavy emphasis on maturation prior to listing 28.
The 2026 offering window has heightened these requirements. The zero-interest-rate era rewarded unconstrained revenue expansion, but current monetary conditions require clear paths to structural profitability and high capital efficiency 329. In 2025, 25% of technology IPOs were profitable at the time of listing, double the 12% rate observed during the 2021 IPO peak 30. Furthermore, the average revenue for technology IPOs rose to $831 million 30.
This shift is quantifiable in private operational benchmarking. While traditional SaaS startups previously accepted median burn multiples of 1.6x - spending $1.60 to generate one dollar of new ARR - the emerging cohort of AI-native startups are achieving sub-1.0x burn multiples 15. This capital discipline translates into more resilient DCF valuations by minimizing the negative cash flows modeled in the explicit forecast period, directly combating the punitive effects of the Warsh-era discount rates 15.
Regional Divergence in Capital Markets
The macroeconomic shifts of 2026 are not uniformly distributed across the global financial system. Diverging central bank policies, localized economic recoveries, and escalating geopolitical tensions have fractured the global IPO landscape, forcing issuers to strategically select listing venues based on national security alignment and regulatory environments 11.
United States Market and National Security Constraints
The United States remains the preeminent destination for capital formation, characterized by deep liquidity and a high tolerance for capital-intensive innovation 1031. However, the US capital markets are increasingly utilized as instruments of national security.
This paradigm is perfectly illustrated by the anticipated IPO of SpaceX. As a dual-use commercial and military contractor responsible for classified Pentagon payloads and the Starlink communications network utilized in active global conflicts, SpaceX operates at the intersection of private enterprise and sovereign defense 6. In preparation for its public debut, SpaceX is structuring its offering to explicitly block buyers based in China and Hong Kong 6.
This highly unusual restriction is a preemptive defensive maneuver designed to prevent the accumulation of equity stakes by adversarial entities, which could trigger forced sales or aggressive intervention by the Committee on Foreign Investment in the United States (CFIUS) 6. By isolating foreign capital before the first share trades, SpaceX ensures its shareholder base aligns strictly with US strategic interests. Late-stage technology companies with defense, AI, or critical infrastructure applications are increasingly treated as strategic national assets, altering how they engage with global capital markets 621.
Asia-Pacific Listing Volume Rebound
The regulatory friction emanating from the United States has catalyzed a renaissance for alternative listing venues in the Asia-Pacific (APAC) region. Chinese technology firms, particularly those operating in sensitive sectors like artificial intelligence and semiconductors, face insurmountable regulatory hurdles when attempting to list on the New York Stock Exchange or NASDAQ 10.
A massive repatriation of capital formation is occurring in response. In the first quarter of 2026, the APAC region demonstrated robust momentum. China, including the Hong Kong Special Administrative Region, recorded 68 IPOs, an astounding 181% year-over-year increase in IPO proceeds, generating $16.7 billion 32. Hong Kong has effectively re-established itself as a vital conduit for capital seeking exposure to Asian growth, benefiting from recent dual-share listing approvals and a stringent but predictable regulatory framework managed by the Securities and Futures Commission (SFC) 810.
While the Hong Kong Exchange processes approximately $40 billion in daily spot trading - a fraction of the US market's $400 billion daily volume - it remains vastly superior in depth to European counterparts, positioning it as the undisputed primary venue for Eastern technology issuers 10. Secondary markets in the region are also participating; Southeast Asia saw 120 IPOs across six bourses raise $6.5 billion in 2025, up 76% year-over-year 8.
European Market Dynamics and Defense Sector Rotation
The European capital markets present a bifurcated narrative in 2026. Structurally, the European Central Bank is operating on a divergent timeline from the US Federal Reserve, nearing the end of its tightening cycle 11. However, Europe lacks the indigenous consumer technology and frontier AI ecosystem that dominates the US markets.
Consequently, European IPO activity declined by 18% to 28 listings in early 2026 32. European valuation multiples persistently trail their North American counterparts. The trailing-12-month median EV/EBITDA multiple for European M&A and public comparables sits at approximately 9.3x, representing a significant discount to the 10.6x multiple commanded by US entities 20. London specifically has struggled with cautious investors and a preference among founders for alternative funding, resulting in smaller and fewer listings 31.
Despite these headwinds, specific sectors in Europe are thriving. Driven by the geopolitical realities of regional conflict and a renewed mandate for sovereign capability, the European IPO pipeline is heavily weighted toward defense, advanced manufacturing, and industrials 323334. Defense conglomerates have found highly receptive domestic institutional bases, supported by massive public and private funding initiatives aimed at securing the continent's strategic autonomy and supply chain resilience 83234.
| Region | Q1 2026 IPO Count | Volume YoY Change | Q1 2026 Proceeds | Proceeds YoY Change | Primary Sector Drivers |
|---|---|---|---|---|---|
| China & Hong Kong | 68 | +36% | $16.7 Billion | +181% | AI, Semiconductors, Domestic Tech 32 |
| United States | 27 | -55% | $10.2 Billion | +13% | AI Infrastructure, Healthcare, Industrials 332 |
| Europe | 28 | -18% | N/A (Segmented) | N/A | Defense, Advanced Manufacturing, Finance 3233 |
Table 2: Global IPO Market Performance by Region (Q1 2026). Data illustrates the divergent regional recoveries, with Asian proceeds experiencing explosive growth while US and European listing volumes contract. 32
Other global regions remain uneven. The United Arab Emirates experienced a notable slowdown in 2025 IPO volume, raising $1 billion compared to $12 billion during its 2022 peak 3335. Brazil has suffered a prolonged capital markets freeze, seeing no traditional IPOs since 2021 3335. Meanwhile, Korea produced year-over-year gains in net IPO proceeds following a Q4 surge in late 2025 3335.
Strategic Implications for Technology Issuers
The intersection of Warsh-era monetary policy and sector-specific technological disruption has fundamentally rewritten the operational prerequisites for late-stage technology IPOs. The era in which venture-backed companies could reliably utilize the public markets as a mechanism to fund speculative, highly unprofitable growth has definitively concluded.
Issuers contemplating public debuts in 2026 and 2027 must navigate rigorous strategic realities. Companies must rigorously evaluate their financial profiles against structurally higher WACC assumptions. Firms heavily reliant on distant terminal values to justify private market valuations will likely face severe down-round pressures or be forced into highly dilutive structured financings. Public underwriters require immediate line-of-sight to free cash flow generation and durable margins to offset elevated risk-free rates 2527.
Furthermore, technology issuers face an intense validation test regarding artificial intelligence. It is no longer sufficient to reference peripheral AI capabilities; the market demands verifiable evidence of monetization and margin expansion 21. For companies operating in vulnerable segments, particularly traditional per-seat SaaS platforms, demonstrating architectural defenses against autonomous agent disruption is critical to prevent punitive multiple compression 45. Ultimately, the public institutional investor base, flush with high-yielding alternatives in the fixed-income markets, will only absorb offerings that transcend speculative narratives and deliver verifiable operational excellence in an increasingly multipolar economy.