Why the Federal Funds Rate Affects Tech Stock Valuations
The federal funds rate is the benchmark overnight interest rate set by the U.S. Federal Reserve, acting as the foundational metric that establishes the baseline cost of capital for the entire global economy. Because technology stocks derive the vast majority of their theoretical value from massive profits projected many years into the future, higher interest rates severely penalize the present value of these distant earnings through the mathematical mechanics of discounted cash flow valuation.
For the everyday corporate employee casually checking a 401(k) balance on a Friday afternoon, the sudden drop in portfolio value following a Federal Reserve press conference can feel deeply unintuitive and frustrating. A retirement portfolio heavily weighted in technology-focused mutual funds or index funds might shed thousands of dollars in perceived value in a matter of minutes, simply because the Chairman of the Federal Reserve signaled an intention to keep interest rates elevated for a longer period than the market anticipated. The companies held within that 401(k) did not suddenly lose their customer base, their enterprise software did not cease to function, and their quarterly revenue did not magically vanish into thin air. Yet, the broader market has abruptly and aggressively re-priced their worth 12. This jarring disconnect highlights the profound, invisible gravitational pull that macroeconomic monetary policy exerts on financial assets. To understand modern equity markets - and particularly the volatile, high-growth technology sector - investors must develop a nuanced understanding of the mechanical, mathematical, and psychological transmission of the federal funds rate 12.
What Is the Federal Funds Rate, and Does the Federal Reserve Directly Set Stock Prices?
The financial media often portrays the Federal Reserve as an omnipotent, monolithic entity turning a dial that directly controls the stock market. A pervasive misconception among retail investors is that the central bank intentionally "sets" stock prices or explicitly targets specific equity market levels to maintain economic stability 14. This is entirely inaccurate. The Federal Reserve operates under a strict, congressionally mandated dual directive: to promote maximum sustainable employment and to maintain stable prices by controlling inflation 13.
To achieve these two massive economic objectives, the Federal Reserve utilizes its primary tool of monetary policy: establishing a target range for the federal funds rate. This specific metric is defined as the interest rate at which depository institutions, such as commercial banks and credit unions, lend their excess reserve balances to other depository institutions overnight on an uncollateralized basis 45. When the Federal Open Market Committee (FOMC) determines that the economy is running too hot and inflation is rising above its historical 2% target, it decides to raise the federal funds rate. The central bank executes this policy shift through open market operations, which entail buying or selling government securities to physically adjust the supply of cash and reserves in the broader banking system 5. In extreme economic circumstances, the Federal Reserve may also expand or shrink its balance sheet - which peaked at roughly $8.5 trillion in 2022 before being reduced to near $6.6 trillion by early 2026 - to further influence market liquidity 6.
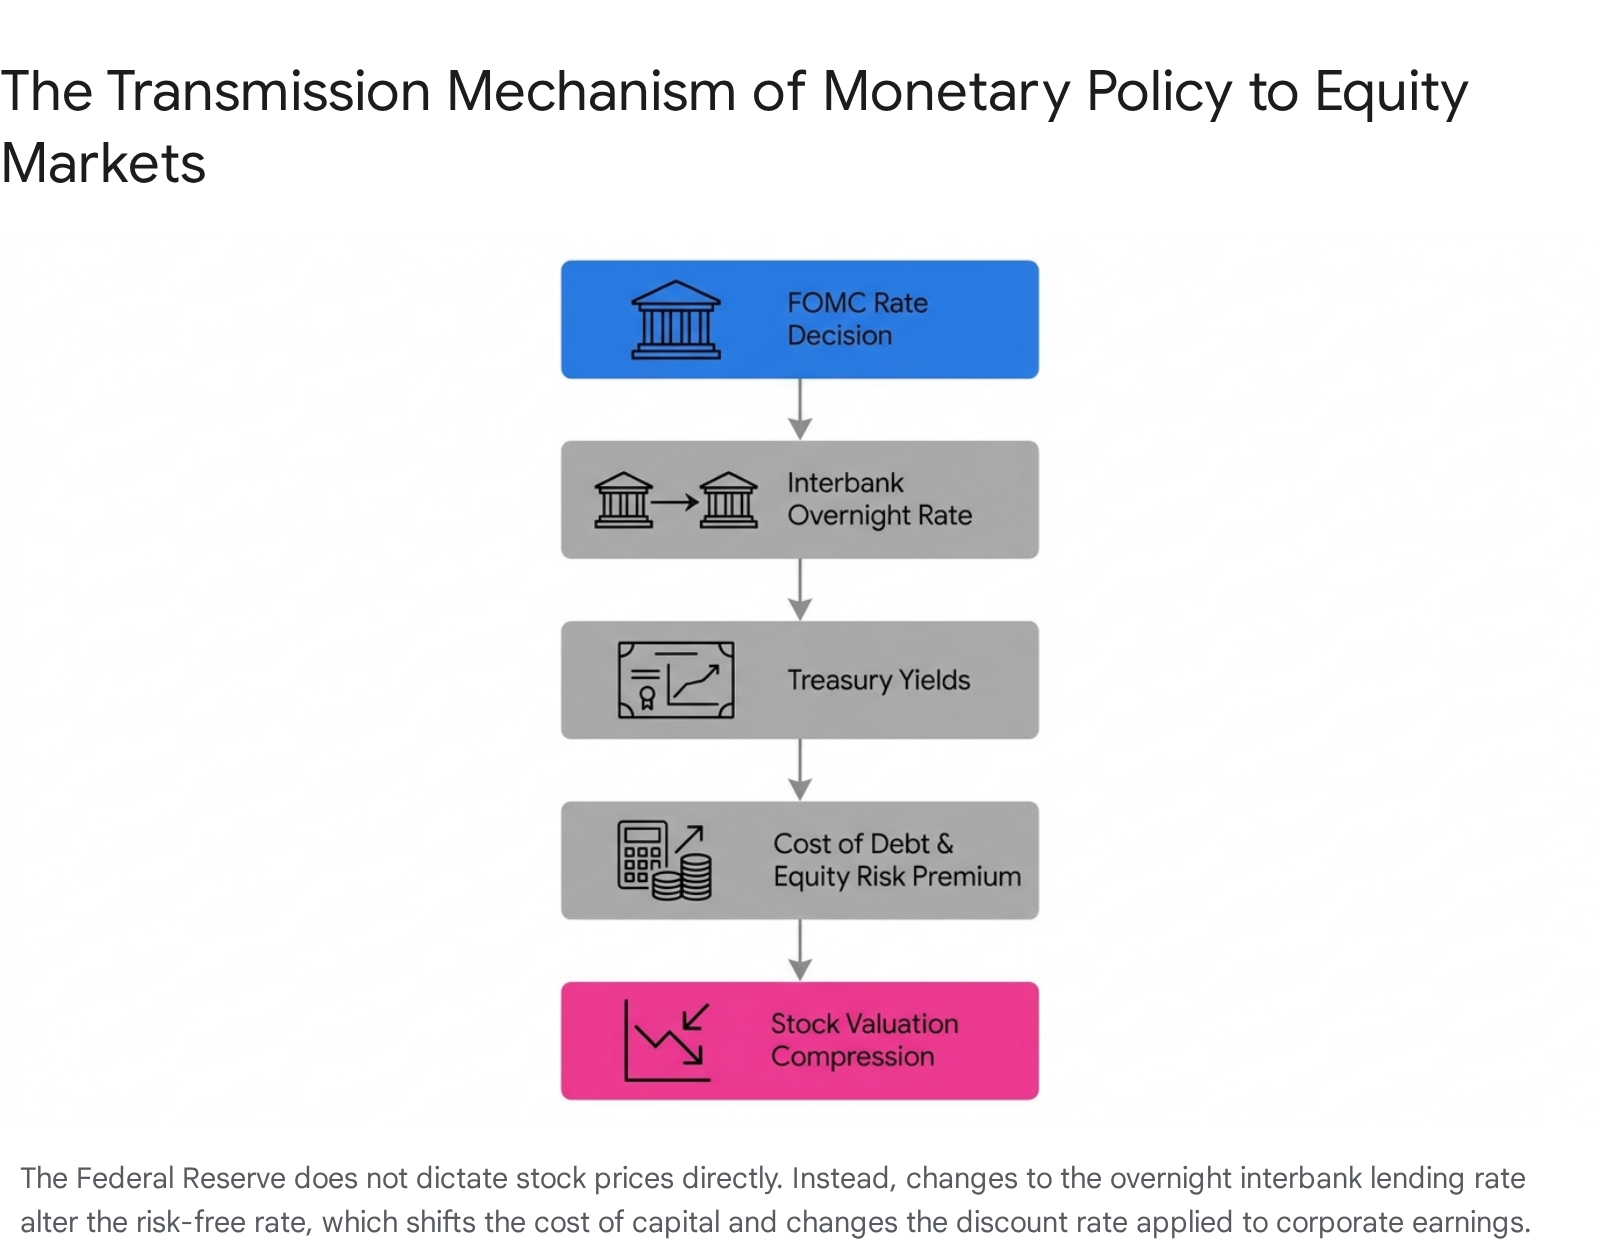
While the Federal Reserve only directly manipulates this obscure overnight interbank lending rate, the economic effects ripple outward instantaneously. The federal funds rate serves as the anchor for what financial professionals refer to as the "risk-free rate," typically represented in the marketplace by the yield on U.S. Treasury bonds, such as the 10-year Treasury note 17. Because a U.S. Treasury bond is backed by the full faith, credit, and taxing power of the United States government, it is universally considered to carry zero default risk 710. Consequently, every other financial asset in the global economy - from a residential mortgage in Ohio to a corporate debt issuance in London, to the valuation of an early-stage artificial intelligence startup in Silicon Valley - is priced on a relative basis against this risk-free rate 78.
If an institutional investor can earn a virtually guaranteed yield on a risk-free government bond, they will naturally demand a significantly higher potential rate of return to justify taking on the inherent volatility of buying technology stocks 212. Therefore, the Federal Reserve does not actively set stock prices. Rather, millions of market participants collaboratively and ruthlessly reset stock prices in real-time by demanding a higher "equity risk premium" to compensate for the newly elevated cost of capital and the higher baseline return available in completely safe assets 110.
How Do Interest Rates Determine the Intrinsic Value of a Technology Company?
To fully comprehend why technology stocks are so acutely and violently sensitive to fluctuations in the federal funds rate, one must examine the mathematical framework that financial analysts use to determine the intrinsic value of a business. The foundational methodology utilized by investment banks, venture capitalists, and equity researchers across Wall Street is the Discounted Cash Flow (DCF) model 21314.
The DCF model operates on the core financial principle known as the "time value of money" 1015. Stated simply, a dollar received today is inherently more valuable and possesses greater utility than a dollar received at some point in the future 15. If an individual or a corporation holds a dollar today, they can invest it immediately into an interest-bearing account or a productive asset and begin earning a return. Therefore, to ascertain the true present value of a publicly traded company, analysts must forecast all the free cash flow the business is expected to generate for the remainder of its operational existence, and then apply a specific "discount rate" to mathematically calculate what those future dollars are worth in today's terms 214.
The mathematical relationship utilized in these models is expressed as the present value equation, where $PV$ represents the present value, $FV$ represents the future value of the cash flow, $r$ represents the discount rate, and $n$ represents the number of periods until the payment is received:
$PV = \frac{FV}{(1 + r)^n}$
This formula illustrates that as the discount rate ($r$) increases, the present value ($PV$) of the future cash flow must decrease. Furthermore, the penalty becomes exponentially more severe the further out into the future ($n$) the cash flow is projected to occur 109.
A Real-World Analogy for Discounting Future Cash Flows
For those outside the finance profession, the abstract concept of a discount rate can feel highly opaque 1314. Consider this practical, everyday analogy: Imagine you are offered a choice between receiving a lump sum of $10,000 in cash today, or receiving a guaranteed payment of $15,000 exactly ten years from now. Which option represents the superior financial decision?
To make this determination accurately, you must consider the "opportunity cost" of your capital 1015. If you choose to take the $10,000 today and deposit it into a secure government bond or a high-yield savings account earning a 5% annual interest rate, that initial sum will compound over time. After ten years of compounding at 5%, your initial $10,000 will have grown to approximately $16,288 10. In this specific interest rate environment, taking the $10,000 today is mathematically superior to waiting a full decade for a flat $15,000 payout.
However, if central bank interest rates are pinned near zero - meaning your savings account yields virtually nothing - the $10,000 will not grow at all over the decade. In a zero-interest-rate macroeconomic environment, choosing to wait ten years for the $15,000 payout becomes the far better financial decision 1015.
This basic opportunity cost calculation is precisely how institutional investors evaluate the worth of technology stocks. When the Federal Reserve raises interest rates, the discount rate applied to corporate earnings goes up in tandem. Consequently, the mathematical penalty applied to money that a company is expected to earn in the distant future becomes incredibly severe 917.
The "Long Duration" Nature of Technology Equities
The technology sector - particularly software-as-a-service (SaaS) providers, biotechnology startups, and early-stage consumer platform companies - features a highly unique financial profile. These companies frequently operate at massive net losses for the first five to ten years of their existence, prioritizing hyper-growth, rapid customer acquisition, and intensive research and development (R&D) over immediate, bottom-line profitability 418.
In advanced financial parlance, these types of tech stocks are categorized as "long-duration" assets 2. Much like a 30-year U.S. Treasury bond, the vast majority of their expected cash flows are projected to materialize many years, if not decades, in the future. Because most of a technology company's value is captured in the outer years of financial projections, discount rates exert an outsized, non-linear impact on their current market valuation 18.
During the Zero Interest Rate Policy (ZIRP) era spanning from 2020 through late 2021, the discount rate was practically zero. Institutional investors were perfectly willing to assign astronomical, unprecedented valuations to deeply unprofitable technology companies because the mathematical penalty for waiting ten years for those companies to finally turn a profit was negligible 1518. But when the Federal Reserve aggressively hiked rates to combat historically high inflation - pushing the federal funds rate from near zero to a peak of 5.25% to 5.50% by 2023 - the underlying math of the technology sector violently reversed 1011.
If a technology company's intrinsic value is derived predominantly from profits expected to arrive in the year 2035, a macroeconomic shift in the discount rate from a baseline of 7.5% up to 12.5% can obliterate the present value of that business. In some valuation models, an increase of just 5% in the discount rate can reduce the net present value of a high-growth, unprofitable business by nearly 75% 18. Furthermore, rising rates actively suppress the very innovation that drives tech valuations. Macroeconomic research indicates that for every 100-basis-point increase in the federal funds rate, research and development spending at public companies historically falls by between 1% and 3%, as tightening monetary policy intrinsically decreases the expected profitability of developing new products 4. Higher borrowing costs compress the valuation multiples of growth companies, even if their underlying software products and business operations remain fundamentally flawless 22.
ZIRP vs. The High-Rate Era: How Did Tech Stocks and IPOs Perform?
To quantify the profound, structural impact of interest rates on the technology sector, it is highly instructive to contrast the Zero Interest Rate Policy (ZIRP) era of 2020 to 2021 against the restrictive High Rate era of 2022 to 2023.
During the ZIRP era, capital was essentially free. The federal funds rate was pinned near zero to artificially stimulate the global economy during the depths of the pandemic 10. This highly accommodative environment sent technology valuations into the stratosphere and opened the floodgates for Initial Public Offerings (IPOs) and Special Purpose Acquisition Companies (SPACs). Companies with zero revenue and entirely untested business models successfully entered the public markets at multi-billion-dollar valuations because the low discount rate heavily favored long-term, speculative growth narratives 1213. The full year of 2021 set an all-time record for the U.S. stock market with 1,035 IPOs, generating hundreds of billions in proceeds 1415.
When the Federal Reserve abruptly reversed course in 2022, executing the fastest and most aggressive rate hiking cycle in modern economic history to combat surging inflation, the IPO window slammed shut almost immediately 1014. As the fundamental cost of capital spiked, investors simply refused to fund cash-burning enterprises. The total volume of IPOs fell off a cliff, dropping to just 181 U.S. listings in 2022, and the tech-heavy Nasdaq 100 index suffered a historic drawdown, shedding nearly 33% of its value as valuation multiples violently contracted 1516.
The table below starkly contrasts the capital market activity across these two distinct macroeconomic regimes.
| Macroeconomic Era | Year | U.S. Federal Funds Target Rate (Year-End) | Nasdaq 100 Annual Return | U.S. IPO Volume (All Sectors) | Global IPO Proceeds ($Bn) |
|---|---|---|---|---|---|
| ZIRP Era | 2020 | 0.00% - 0.25% | +47.58% | 480 | N/A |
| ZIRP Era | 2021 | 0.00% - 0.25% | +26.63% | 1,035 (Record High) | $459.9 |
| High Rate Era | 2022 | 4.25% - 4.50% | -32.97% | 181 | $179.5 |
| High Rate Era | 2023 | 5.25% - 5.50% | +53.81% (AI Anomaly) | 154 (Cyclical Low) | N/A |
Data compiled from historical Nasdaq 100 returns 16, U.S. stock market IPO statistics 15, and global market EY IPO updates 14. Note the anomalous behavior of the Nasdaq in 2023; despite the highest interest rates in over a decade and a deeply frozen IPO market, the index soared entirely on the back of the mega-cap AI infrastructure boom.
The severe freeze in the IPO pipeline created a compounding liquidity crisis for the entire technology ecosystem. With the Mergers and Acquisitions (M&A) market heavily throttled by the high cost of debt financing for private equity acquirers, and the IPO window tightly closed, venture capital firms were entirely unable to achieve liquidity events or "exits" for their portfolio companies 1317. Without these lucrative exits, venture capitalists could not return initial capital and profits to their Limited Partners, which in turn meant those Limited Partners lacked the free liquidity to re-invest in new, subsequent venture funds 1318. The restrictive interest rate regime effectively clogged the entire plumbing of the technology funding lifecycle from the earliest seed rounds all the way to the public markets.
Why Did the 2023 Artificial Intelligence Boom Defy High-Rate Gravity?
According to the established macroeconomic rulebook and the mechanics of the DCF model, the aggressive rate-hiking cycle of 2022 and 2023 should have triggered a multi-year dark age for the entire technology sector. Initially, it did exactly that, as evidenced by the severe 2022 drawdowns 16. Yet, in 2023, the Nasdaq 100 roared back with a staggering 53.81% return 1628, and by the middle of 2026, the broader S&P 500 had surpassed the 7,500 milestone 29.
How did the technology sector successfully defy the intense gravitational pull of the highest interest rates in over two decades? The answer lies in an unprecedented bifurcation of the equity market, driven almost entirely by the emergence of Generative Artificial Intelligence (AI) and the highly unique financial architecture of "mega-cap" technology companies.
The Fortress Balance Sheets of the Tech Titans
The traditional sensitivity of technology stocks to interest rates generally assumes that these companies rely on external debt or continuous equity issuance to fund their operations and growth 2. High interest rates usually mean high borrowing costs, which eat directly into corporate cash flow. However, the trillion-dollar technology giants that dominate modern indices - such as Apple, Microsoft, Alphabet, Amazon, and Meta - operate with balance sheets that more closely resemble sovereign wealth funds than traditional corporations 2.
These mega-cap companies sit on hundreds of billions of dollars in liquid cash equivalents. When the Federal Reserve hiked interest rates, these specific tech giants actually benefited from a pure accounting perspective. The interest income generated by their massive cash reserves sitting in high-yield corporate treasuries and money market funds significantly outpaced the increased interest expenses associated with their existing, mostly fixed-rate debt 2. For these large, highly profitable technology monopolies, higher macroeconomic rates became a beneficial second-order effect rather than an existential threat to their survival 2.
The Generative AI Infrastructure Super-Cycle
Simultaneously, the commercial breakthrough of advanced large language models ignited a historic, global infrastructural arms race. Institutional investors quickly realized that the enterprise transition to artificial intelligence required an immediate, unprecedented deployment of capital into physical data centers, advanced semiconductors, and power generation grids 1920.
This sudden dynamic sharply separated the "promises of the future" from the "profits of the present." While unprofitable SaaS companies and smaller tech firms continued to languish under the crushing weight of high discount rates 1232, the specific companies building the physical and computational infrastructure of AI - most notably semiconductor designers like Nvidia and AMD, alongside the major hyperscale cloud providers - saw immediate, explosive revenue and earnings growth 12.
In early 2026, institutional analysts estimated that U.S. hyperscalers would spend over $800 billion on capital expenditures (CapEx) for the year, a figure projected to scale beyond a staggering $1.1 trillion by 2027 20.
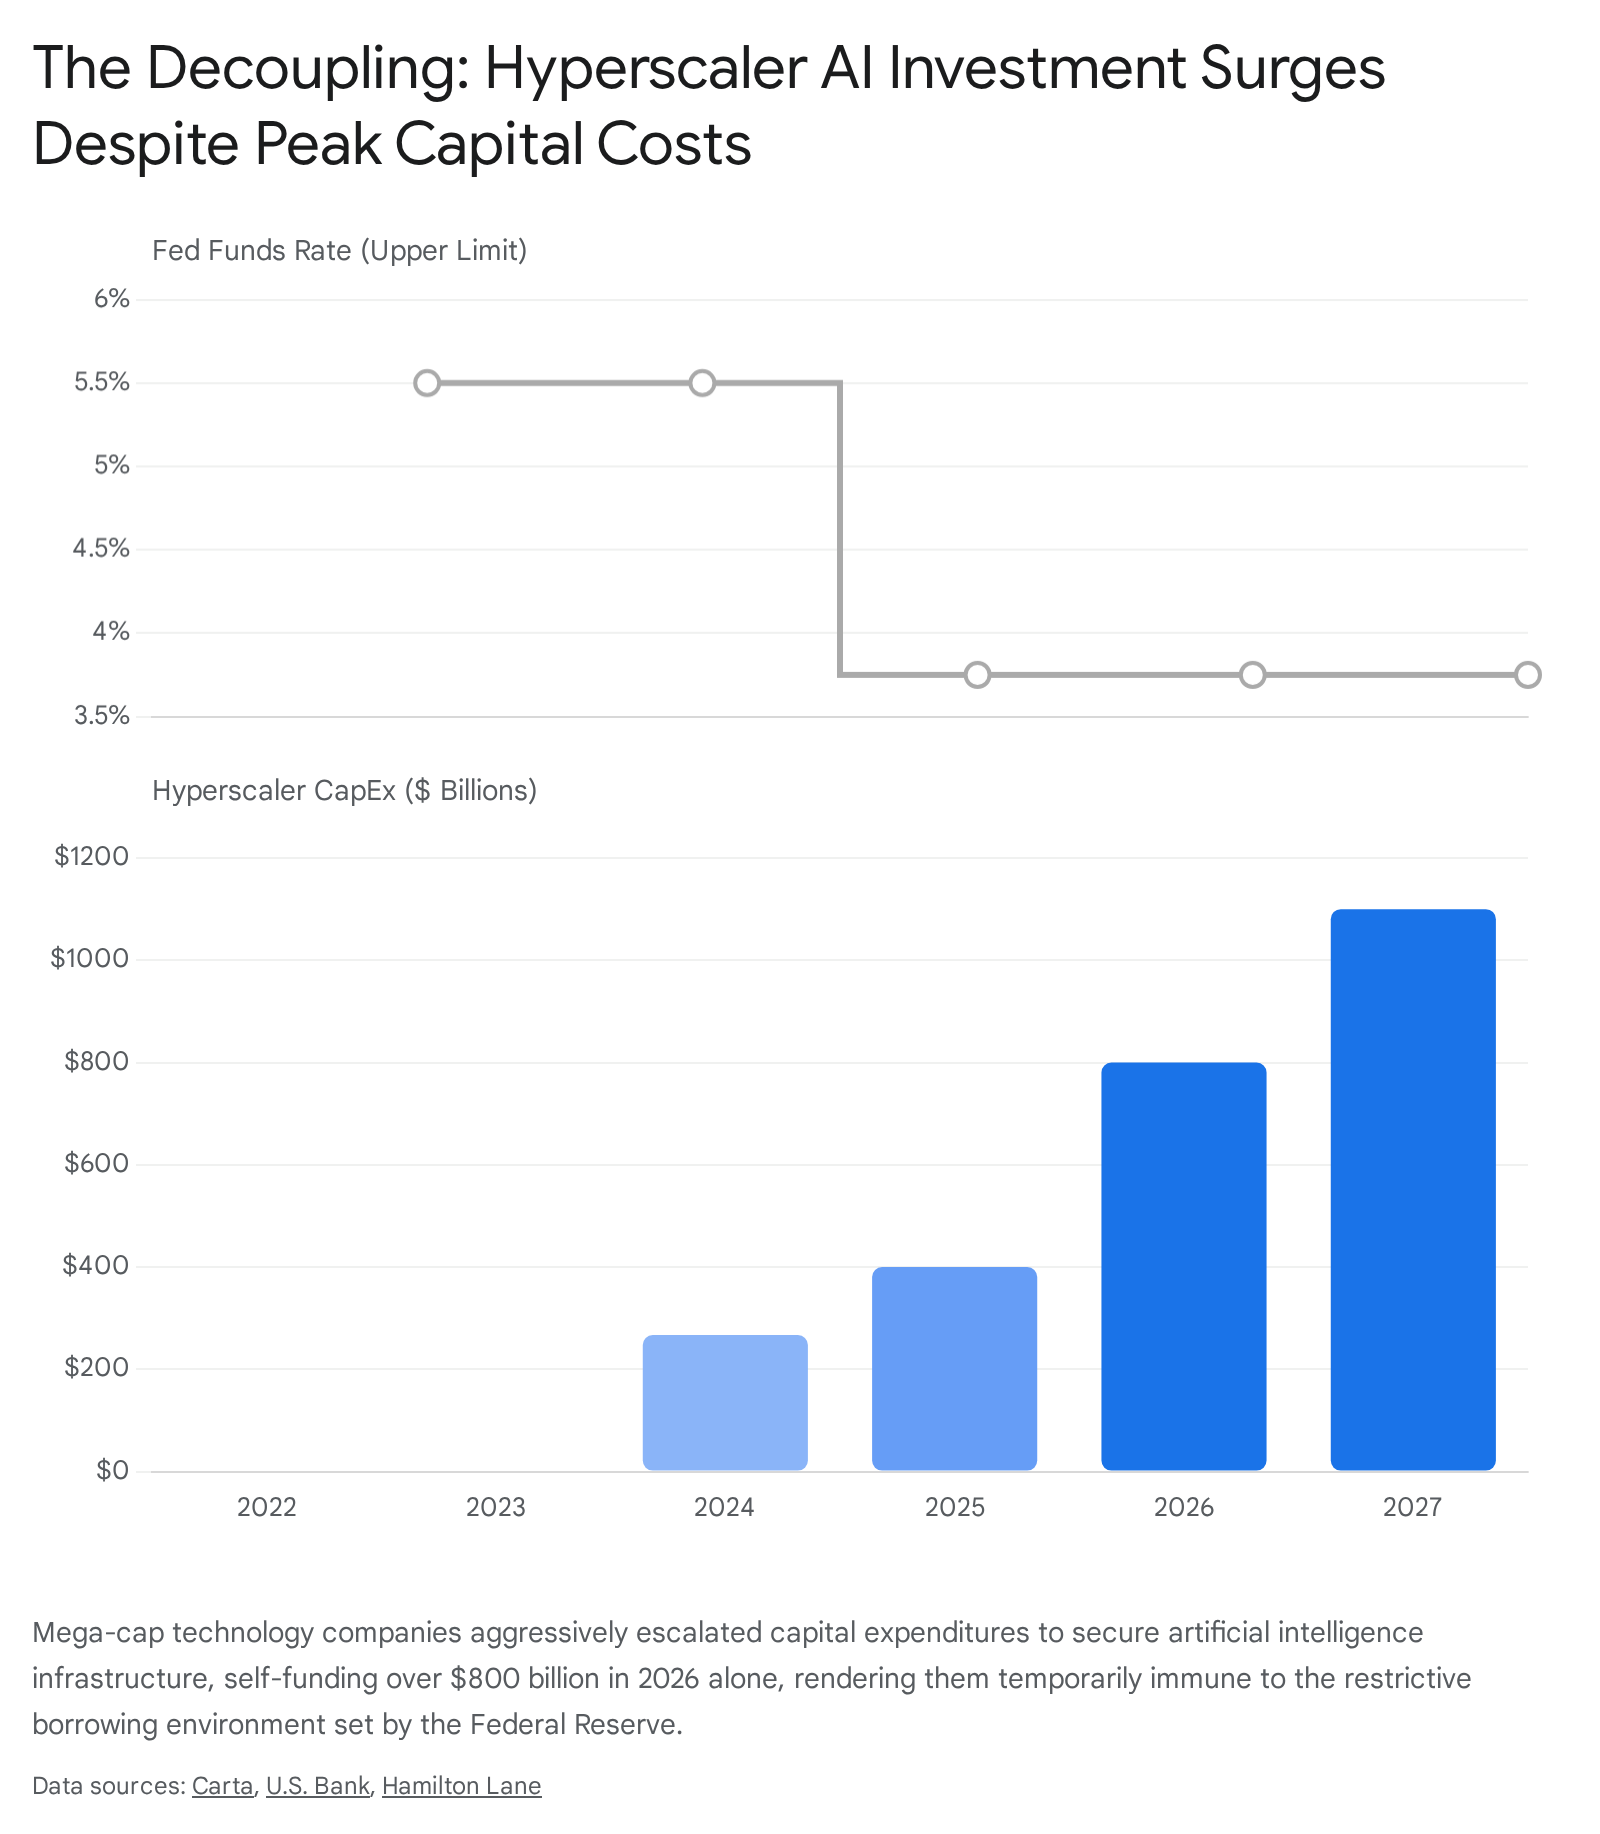
To contextualize this massive scale of corporate investment, the roughly $800 billion spent by just four technology companies roughly matched the combined capital expenditure of all the other 495 companies in the S&P 500 20. This tsunami of immediate, tangible spending completely overwhelmed the standard DCF valuation models. The sheer velocity of growth in near-term cash flows for AI hardware and infrastructure companies was so violent that it completely overpowered the negative valuation effects of a higher macroeconomic discount rate 21.
However, this extraordinary resilience carries intense, systemic risks. The "circularity" of AI capital spending has drawn increasing scrutiny from skeptical economists. An elite, incestuous handful of technology companies are essentially raising vast sums of capital, buying specialized chips, leasing massive compute capacity, and booking immense revenues from one another in a closed loop 22. Influential venture capitalists have openly questioned the sustainability of this model, pointing out the massive revenue gaps that must eventually be filled by end-user monetization to justify such immense capital outlays 12. If the ultimate enterprise and consumer adoption of AI fails to justify a $1 trillion annual CapEx run-rate, the sheer volume of capital destruction could mirror the devastating dot-com crash of 2000, leaving these currently high-flying tech stocks highly vulnerable to sudden, violent sentiment shifts 1223.
How Do U.S. Federal Reserve Decisions Ripple Through Global Tech and International Venture Capital?
The U.S. Federal Reserve effectively serves as the central bank of the world. Because the U.S. dollar functions as the primary global reserve currency and the dominant medium for international trade, shifts in the federal funds rate have immediate, often destabilizing macroeconomic effects on international technology markets and cross-border venture capital flows 2437.
The Wrecking Ball of a Strong U.S. Dollar
When the Federal Reserve raises interest rates, foreign capital heavily flows into the United States seeking higher, risk-free yields on Treasury bonds 737. This massive, structural inflow of capital strengthens the U.S. dollar against almost all other foreign currencies 37.
For technology companies operating in emerging market economies (EMEs) like Brazil, India, or Southeast Asia, a rapidly appreciating U.S. dollar is disastrous. Many foreign tech companies rely heavily on U.S. dollar-denominated debt for their early-stage funding 25. As the dollar appreciates against their local currency, the cost of servicing that debt skyrockets, quickly devastating their balance sheets and pushing them toward insolvency 3725. Furthermore, as global risk appetite declines in the face of rising U.S. rates, foreign investors rapidly liquidate their holdings in emerging market tech equities in favor of safe domestic assets, exacerbating capital outflows and crushing local valuations 2425.
By 2026, the pain extended well beyond vulnerable emerging markets to the highly developed, sophisticated technology sectors of Asia. Equity markets in South Korea, Taiwan, and Japan experienced severe volatility as fears of sustained, high U.S. interest rates weighed heavily on forward valuations. Major Asian semiconductor and hardware players like Samsung Electronics, SK Hynix, and Tokyo Electron saw sharp single-day sell-offs that were directly correlated with robust U.S. jobs data 2239. Institutional investors interpreted the strong U.S. labor market as a definitive signal that the Federal Reserve would keep rates elevated, triggering immediate algorithmic selling across Asian tech exchanges, which at one point prompted the South Korean market operator to temporarily halt trading on the Kospi index 22.
The macroeconomic differential between European and American monetary policy further complicated the global landscape. As the European Central Bank (ECB) embarked on an aggressive rate-cutting cycle - slashing deposit rates to 2% - the Federal Reserve maintained a much tighter stance 26. This divergence meant that European investment funds, which hold significant exposure to U.S. technology equities, faced intense currency risks. If the U.S. dollar were to eventually weaken against the Euro, European investors owning U.S. tech stocks would see the value of their overseas investment gains severely eroded when converted back to their domestic currency 2326.
The Dictatorship of the Venture Capital "Hurdle Rate"
Perhaps nowhere is the restrictive impact of the federal funds rate felt more acutely than in the highly illiquid world of international venture capital (VC) fundraising 18.
Venture capital is the essential lifeblood of technological innovation, providing the necessary risk capital for software, biotech, and hardware startups to scale their operations 41. However, VC is an exceptionally high-risk asset class characterized by high failure rates. Institutional investors, known as Limited Partners (LPs) - such as sovereign wealth funds, pension funds, and university endowments - allocate capital to VC funds with the strict expectation of achieving outsized returns that heavily compensate them for locking up their money in illiquid private assets for a decade or more 813.
The absolute minimum acceptable return that LPs demand before paying performance fees is known as the "hurdle rate" 8. This hurdle rate is heavily dictated by the prevailing risk-free rate. If the federal funds rate sits at 0%, LPs might accept a VC hurdle rate of 8%. However, when the federal funds rate rises to 5%, LPs can earn a highly secure, liquid yield in public credit markets without taking on any existential startup risk 13. Consequently, the required VC hurdle rate adjusts violently upward 8. VC fund managers (General Partners) suddenly find themselves needing to project internal rates of return (IRR) of 20% or more on their portfolio companies simply to make the mathematics work and attract LP capital 8.
This dynamic severely contracted the global VC market. In 2024, the share of venture capital successfully raised by first-time fund managers dropped to a mere 5% of the total market, representing the lowest level recorded since data tracking began in 2001 18. Higher interest rates fundamentally made venture capital "more expensive" relative to safe assets . A comprehensive study by the European Financial Management Association spanning 35 years of data found that a mere 1% increase in interest rates reduced global venture capital fundraising by an average of 3.2% 41.
By 2025, the global venture landscape had radically consolidated around perceived safety. The United States captured an overwhelming 64% of all global VC funding, totaling $274 billion, driven almost entirely by domestic AI infrastructure megadeals that LPs deemed "must-have" allocations 43. Europe, meanwhile, stagnated, maintaining only a 15.3% share as global capital concentrated around the safest, most robust geography 43. Rising U.S. rates effectively drained the speculative risk capital out of international markets, starving early-stage foreign technology companies of the liquidity they desperately needed to survive and grow.
What Are the Practical Takeaways for Investors Navigating a 3.5% to 3.75% Rate Environment?
By mid-2026, the global macroeconomic narrative had decisively shifted away from anticipating aggressive, ZIRP-era rate cuts toward accepting a structural "higher for longer" reality. Following persistent, sticky inflation concerns - exacerbated by severe geopolitical shocks to energy markets and surprisingly resilient U.S. job growth - the Federal Reserve appeared anchored, holding the benchmark rate steady in the 3.50% to 3.75% target range 3612.
This specific macroeconomic environment - neither the free-money paradigm of ZIRP nor the extreme, punishing 5.5% peak of 2023 - requires a highly nuanced, strategic approach to equity allocation. A 3.5% risk-free rate still presents a formidable mathematical hurdle for speculative technology stocks, while simultaneously offering highly attractive yields in traditional fixed-income markets 29.
For institutional and retail investors navigating this complex landscape, several practical, evidence-based takeaways emerge:
Shift from "Growth at All Costs" to "Growth at a Reasonable Price"
In a sustained 3.5% to 3.75% interest rate environment, the foundational cost of capital remains significantly elevated 12. The broader equity market will severely punish technology companies that exhibit high cash burn rates, lack clear paths to profitability, and rely on continuous equity dilution to fund day-to-day operations 44. Investors must rigorously screen their technology portfolios for companies demonstrating strong free cash flow generation, expanding profit margins, and fortress balance sheets that minimize reliance on external, high-interest debt 212. Absolute valuations still matter immensely; investors must exercise extreme caution before paying 100x or 200x forward earnings multiples for enterprise software companies whose projected growth relies entirely on multiple expansion rather than fundamental, organic earnings delivery 32.
Monitor AI "Duration Risk" and Capital Expenditure Sustainability
While the artificial intelligence boom provided a protective, near-term halo over mega-cap technology stocks, investors must acutely monitor the actual return on investment (ROI) generated by hyperscaler spending 32. With elite financial institutions estimating a staggering $1.1 trillion in U.S. hyperscaler capital expenditures by 2027 20, any indication that mainstream enterprise adoption of AI software is failing to generate commensurate downstream revenue could lead to a massive, violent re-pricing of semiconductor and cloud computing stocks 2223. Strategic diversification away from a pure, concentrated mega-cap tech allocation is critical to mitigate the severe duration risk of a hardware spending plateau 1927.
Embrace Broader Portfolio Diversification and Fixed Income
The traditional 60/40 portfolio (60% equities, 40% bonds) faced intense, widespread criticism during the simultaneous stock and bond market crash of 2022, but the normalization of higher interest rates has fully restored its utility 46. With investment-grade corporate bonds yielding above 5% and standard U.S. Treasuries providing highly meaningful, risk-free income for the first time in over a decade 29, the fixed income asset class once again offers true diversification and legitimate downside protection 2728. Investors heavily concentrated in technology equities should utilize these elevated bond yields to generate reliable portfolio income without taking on additional duration risk.
Implement Strategic Inflation Hedges
Persistent inflation risks - driven by massive structural forces such as global supply chain deglobalization and severe geopolitical energy shocks, like the 2026 Middle East conflicts that temporarily pushed U.S. CPI to 4.2% - suggest that investors can no longer rely solely on technology stocks to outpace inflation 4849. A modern portfolio adapted for a 3.5% rate environment should maintain a dedicated 15% to 20% allocation to proven inflation hedges. This includes energy equities, which profit directly from commodity supply crunches, Treasury Inflation-Protected Securities (TIPS), and selective value-oriented sectors like industrials and materials that possess the pricing power to pass increased costs onto consumers 1949.
The Bottom Line
The federal funds rate acts as the undisputed fulcrum upon which global technology valuations pivot. It is not an arbitrary dial that central bankers use to manipulate stock prices, but rather the fundamental anchor of the risk-free rate, which strictly dictates the mathematical discount applied to all future corporate cash flows.
In accommodative, low-rate environments, the mathematics of finance forgive unprofitability, driving highly speculative tech valuations and fueling booming IPO markets. In restrictive, high-rate environments, the math is entirely ruthless, crushing long-duration equity assets and choking off the international venture capital flows that serve as the lifeblood of global innovation. While the sheer financial mass of mega-cap technology companies and the structural, unprecedented demand for artificial intelligence infrastructure temporarily defied this macroeconomic gravity in recent years, the fundamental laws of finance remain intact.
As the Federal Reserve anchors monetary policy in the 3.5% to 3.75% range through the latter half of the decade, the historical era of free money is definitively over. Investors must permanently abandon the speculative fervor of the ZIRP era, focusing instead on highly disciplined asset allocation, robust corporate cash flow generation, and a deep, abiding respect for the profound, unavoidable influence of the time value of money.