Combined Trading Signals and Overfitting Risk
Market Efficiency and the Predictive Dilemma
Financial markets represent complex, dynamic systems characterized by profound volatility, non-stationarity, and persistently low signal-to-noise ratios (SNR). The core objective of quantitative finance and systematic trading is to extract predictive signals from historical data to forecast future price movements. However, according to the Efficient Market Hypothesis (EMH), asset prices rapidly assimilate and reflect all available information, implying that patterns derived exclusively from historical prices cannot produce systematic, exploitable gains without assuming disproportionate risk 1. In highly liquid markets, the true predictive component of any price movement is typically obscured by immense volumes of background noise. This noise consists of random, short-term fluctuations driven by market microstructure effects such as bid-ask bounce, transient news events, and asynchronous trading flows, none of which carry reliable information regarding future price trajectories 2. In many advanced markets, the signal-to-noise ratio for directional prediction is estimated to be between 0.51 and 0.53, placing the baseline predictive capacity of most models perilously close to random chance 2.
To navigate this noisy environment, technical analysis relies on mathematical transformations of price, volume, and time to isolate latent market dynamics such as momentum, underlying trend, and volatility. A pervasive heuristic among trading practitioners is that combining multiple technical indicators enhances the probability of success. The conventional logic asserts that if a moving average identifies a trend, a bounded oscillator identifies a localized entry point, and a volatility band confirms the expansion of market momentum, their intersection must represent a highly robust structural edge.
However, this heuristic introduces a severe statistical vulnerability. Because all technical indicators are ultimately derived from the same underlying dataset - typically Open, High, Low, Close, and Volume (OHLCV) - expanding the feature space by stacking indicators does not necessarily increase the true informational density of the model. Instead, it scales the dimensionality of the testing environment exponentially. The probability of discovering a strategy that produces exceptional backtested results purely by chance approaches absolute certainty as the number of tested parameters increases. This mathematical reality forces researchers to confront a fundamental dilemma: does combining multiple indicators genuinely improve the statistical validity of trading signals, or does it merely facilitate the combinatorial overfitting of historical noise?
Mathematical Mechanics of Technical Transformations
To rigorously evaluate the efficacy and redundancy of signal combination, it is necessary to deconstruct the mathematical mechanisms underlying the most widely utilized technical indicators. These tools generally function by performing low-pass filtering on price data to remove high-frequency noise, preserving low-frequency trend components, or by computing rolling standard deviations and ratios to identify probabilistic boundary conditions 3.
Bounded Momentum Oscillators
The Relative Strength Index (RSI) is a leading momentum oscillator designed to measure the velocity and magnitude of directional price movements. It operates on a bounded scale between 0 and 100. The mathematical formulation calculates the ratio of the average of upward price closes to the average of downward price closes over a defined lookback period, traditionally 14 periods 45678. The indicator yields an overbought condition when reading above 70 and an oversold condition below 30 51. However, the mathematical design intrinsically limits the RSI's ability to express continuous, compounding momentum. In strong, persistent trending regimes, the average of downward closes approaches zero, causing the RSI to saturate near its upper boundary. Consequently, the indicator frequently generates premature, false mean-reversion signals while the underlying asset continues its directional advance 12.
The Stochastic Oscillator operates on a similar bounded premise but utilizes an entirely different mathematical transformation. Rather than averaging gains and losses, it compares the most recent closing price to the absolute high-low range over a specified period 463. Comprising a primary %K line and a smoothed %D moving average, the Stochastic formula is driven by the theoretical assumption that closing prices tend to accumulate near the upper extreme of their rolling range during uptrends, and near the lower extreme during downtrends 68. Because it measures relative position within a rigid trailing window, the Stochastic Oscillator is highly sensitive and oscillates much faster than the RSI. This high sensitivity makes it prone to rapid whipsaw fluctuations from oversold to overbought states within the span of a few periods, producing significant noise in highly directional markets 81.
Unbounded Trend and Volatility Measures
Conversely, the Moving Average Convergence Divergence (MACD) is an unbounded indicator that fuses momentum and trend-following characteristics 456. It is constructed by subtracting a longer-term Exponential Moving Average (EMA), typically 26 periods, from a shorter-term EMA, typically 12 periods, generating the MACD line 734. A secondary 9-period EMA of the MACD line is then overlaid to act as a signal trigger 78. The MACD relies on the continuous divergence and convergence of these smoothed averages to identify acceleration or deceleration in a price trend 56. Because its inputs are heavily smoothed lagging averages, the MACD inherently lags real-time price action. Its value lies in confirming historical state changes and broader momentum shifts rather than providing leading indications of immediate movement 8.
Volatility indicators operate on yet another mathematical dimension. Bollinger Bands, for instance, measure price dispersion relative to a central tendency. The indicator consists of a simple moving average (SMA), most commonly 20 periods, flanked by an upper and lower band positioned two standard deviations away from the mean 454. Bollinger Bands explicitly model the evolving volatility regime, expanding during periods of market stress and contracting during consolidation phases, capitalizing on the statistical tendency of prices to revert to the mean 524.
Multicollinearity in Indicator Selection
A critical vulnerability in systematic strategy design is the failure to recognize multicollinearity among these tools. Multicollinearity occurs when multiple predictive features in a model are highly correlated, meaning they offer redundant information 5. The RSI and the Stochastic Oscillator both measure localized momentum through bounded ratios derived from recent price changes. Integrating both indicators into a single predictive model does not mathematically cross-validate a signal via independent metrics; it merely subjects the same underlying price vector to two highly correlated mathematical filters 678.
Meaningful signal enhancement requires the combination of indicators that capture mathematically orthogonal market dimensions. A valid combinatorial model might pair a trend filter (MACD) with a volatility metric (Bollinger Bands) and a momentum oscillator (RSI), thereby providing a multidimensional view of the market state 24. In such a configuration, the indicators are hierarchical and conditional: the Bollinger Band identifies a volatility compression, the MACD confirms the macro-trend direction upon breakout, and the RSI acts as a localized timing mechanism to confirm that the asset is not immediately overextended 214.
| Indicator Category | Core Indicator | Mathematical Transformation | Output Constraint | Primary Market Dimension Captured |
|---|---|---|---|---|
| Momentum | Relative Strength Index (RSI) | Ratio of average gains to average losses. | Bounded (0 to 100) | Velocity of recent price changes; saturation extremes. |
| Momentum / Range | Stochastic Oscillator | Close position relative to historical high-low range. | Bounded (0 to 100) | Proximity of closing price to recent period extremes. |
| Trend / Momentum | MACD | Difference between fast and slow Exponential Moving Averages. | Unbounded (Zero-line centered) | Trend acceleration, deceleration, and directional shifts. |
| Trend Filtering | Moving Averages (SMA/EMA) | Arithmetic or exponentially weighted mean of trailing prices. | Unbounded (Follows price scale) | Low-pass filter removing high-frequency noise. |
| Volatility | Bollinger Bands | Rolling standard deviation added/subtracted from an SMA. | Unbounded (Follows price scale) | Dispersion of price; standard deviation of market returns. |
The Multiple Testing Crisis in Strategy Development
When a quantitative researcher attempts to optimize a trading strategy by iterating through combinations of indicators, lookback periods, and entry thresholds, they enter a high-dimensional search space. If a practitioner tests 10 variations of an RSI lookback, 10 variations of MACD parameters, and 10 variations of a trailing stop, they have instantaneously generated 1,000 unique strategy configurations. This methodology introduces one of the most pervasive flaws in empirical asset pricing: selection bias under multiple testing, colloquially known as data snooping 678.
Combinatorial Expansion and Data Snooping
Data snooping occurs when a given historical dataset is repeatedly probed and evaluated for purposes of inference or model selection until a result that appears statistically meaningful is achieved 7. In traditional statistical hypothesis testing, a single test evaluated at a 5% significance level has a 5% chance of yielding a false positive (Type I error). However, when hundreds or thousands of hypotheses are tested simultaneously without proper mathematical correction, the family-wise error rate compounds dramatically. If 1,000 independent, random trading rules are simulated on historical market data, the probability that at least one rule will demonstrate statistically significant profitability purely through random walk mechanics is exceptionally high 819.
In the context of algorithmic trading, overfitting is explicitly exacerbated by optimizer-driven searches over strategies, feature variants, and parameterizations. Evolutionary algorithms, grid searches, and machine learning models navigate this space by balancing the exploration of new primitive operations (like price transformations) with the exploitation of promising combinations 19. By selecting the single best backtest from a massive matrix of combinatorial candidates, researchers fundamentally inflate the apparent statistical significance of the chosen strategy 68. Consequently, practitioners mistake the maximum value of a random error distribution for a persistent financial edge, leading to catastrophic deployment failures in live markets.
Probability of Backtest Overfitting and Symmetric Validation
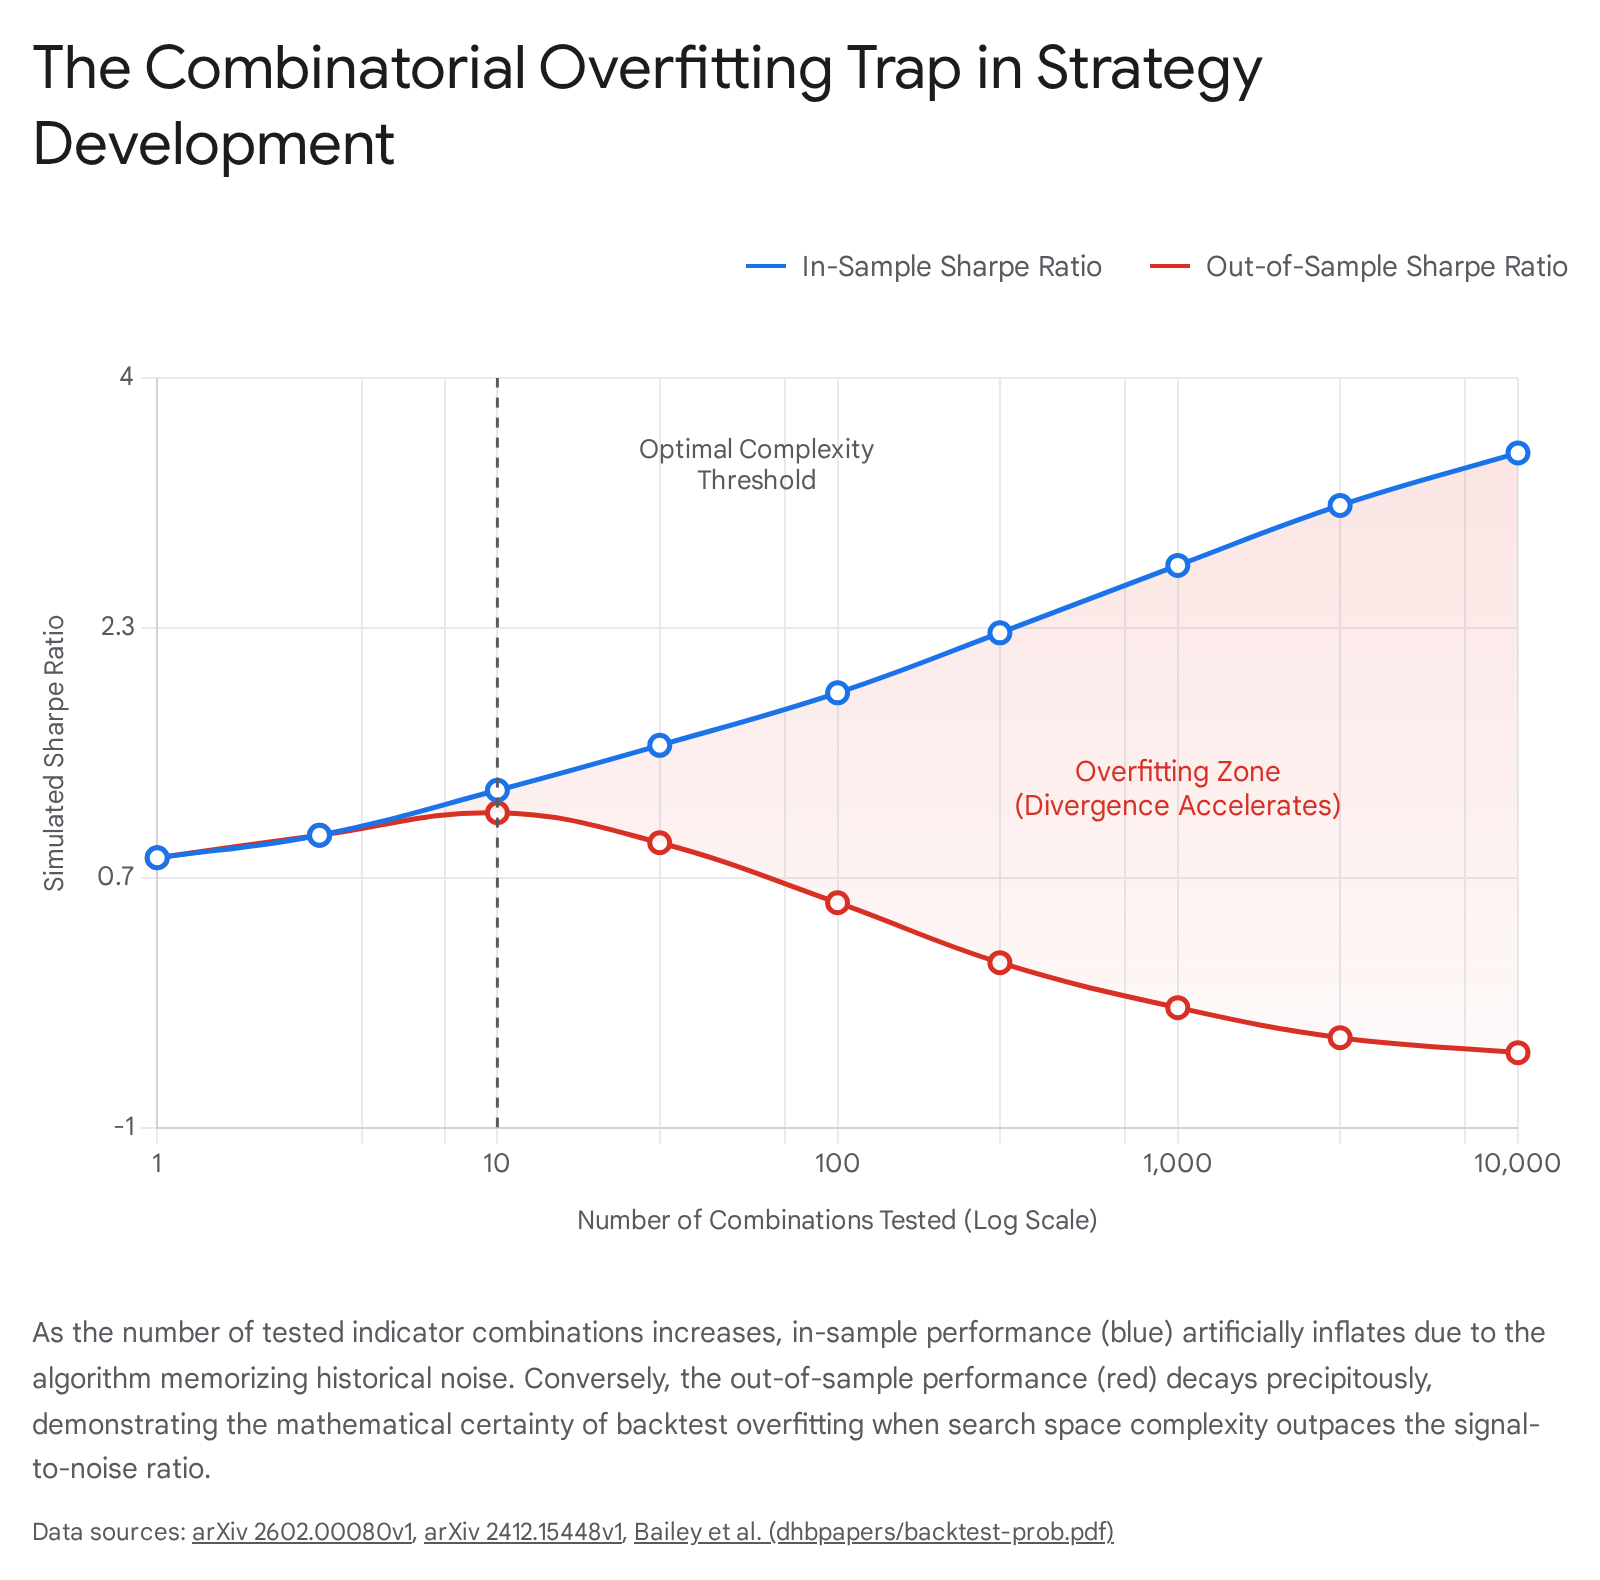
The mathematical formalization of this phenomenon has been extensively mapped in literature concerning the Probability of Backtest Overfitting (PBO). PBO utilizes a measure-theoretic framework to establish the exact likelihood that a strategy configuration selected as optimal during the in-sample (IS) training phase will rank below the median performance of all tested configurations in the out-of-sample (OOS) testing phase 9. In a heavily overfit combinatorial search, the strategies that perform best in-sample have merely memorized the specific, idiosyncratic noise sequence of that historical period. Consequently, when the optimized indicator set is exposed to unseen data, performance degradation is precipitous 91022.
To accurately estimate PBO without relying on a single, arbitrary chronological data split, quantitative researchers utilize Combinatorially Symmetric Cross-Validation (CSCV). The CSCV procedure represents a model-free and nonparametric implementation. It collects the performance series of all $N$ tested strategies into a matrix $M$, which is then partitioned across rows into an even number of disjoint submatrices 9. By forming all possible combinations of these submatrices into training and testing sets, the procedure evaluates the performance vector across countless permutations. This iterative recombination generates a robust distribution of logits representing the out-of-sample ranks for strategies that appeared optimal in-sample, providing a definitive quantitative probability of overfitting 9.
The Deflated Sharpe Ratio
Because standard performance metrics fail to account for the multiplicity of the search space, corrective statistical measures are mandatory for professional deployment. The standard Sharpe Ratio assumes a normal distribution of returns and evaluates a strategy as if it were a single, isolated hypothesis test 611. In financial reality, trade-level returns exhibit extreme fat tails, heteroskedasticity, and significant autocorrelation, all of which violently violate independent and identically distributed (i.i.d.) assumptions and severely miscalibrate parametric significance filters 6.
The Deflated Sharpe Ratio (DSR) addresses these inadequacies by correcting for both performance inflation caused by selection bias under multiple testing and the non-normality of return distributions. The DSR mathematically deflates the estimated Sharpe ratio by establishing an adjusted rejection threshold based on five critical variables: the skewness of the returns distribution, the kurtosis of the returns, the total sample length, the variance across the estimated Sharpe Ratios of all trials conducted, and the total number of independent trials ($N$) evaluated in the search space 11. By integrating these variables, the DSR dictates that strategies discovered through extensive combinatorial search over multiple technical indicators must produce substantially higher absolute baseline returns to cross the threshold of true statistical significance.
Formal Validation and Hypothesis Testing
To combat the inherent bias in discovering trading rules through intensive data snooping, econometricians employ formalized bootstrap testing methodologies. These frameworks are specifically designed to ascertain whether the performance of an optimized set of technical indicators genuinely reflects predictive ability, or if it is merely a statistical anomaly drawn from a massive testing universe.
White's Reality Check and Hansen's Superior Predictive Ability
White's Reality Check (RC) was introduced as a pioneering large-scale joint testing method to account for the dependency of individual trading statistics generated from the same underlying dataset 1213. When a researcher tests thousands of moving average lengths and oscillator combinations on an asset like the S&P 500, the resulting performance metrics are inherently linked because they process the exact same sequence of closing prices. White's Reality Check addresses this by evaluating the performance of the best trading rule among a massive series of multiple strategies, framing a null hypothesis that the single best model has no predictive superiority over a baseline benchmark (such as buy-and-hold) once data snooping is accounted for .
However, the Reality Check suffers from a structural flaw: it is highly sensitive to the inclusion of irrelevant or deeply unprofitable models in the testing universe. The presence of these inferior strategies can manipulate and reduce the test's statistical power, masking genuine signals 13. To rectify this, Hansen introduced the Superior Predictive Ability (SPA) test, which utilizes a studentized process to filter out irrelevant models and provides a far more robust, data-snooping-adjusted p-value 121314. An advanced extension, the stepwise SPA test (Step-SPA), further refines this capability by systematically identifying predictive models in large-scale multiple testing environments while asymptotically controlling the family-wise error rate .
When these rigorous data-snooping corrections are applied to historical studies of technical indicators, the empirical findings are profoundly restrictive. Early academic literature frequently reported that simple technical rules - such as moving average crossovers and trading range breakouts - could generate significant excess returns, particularly prior to the widespread automation of markets 14. However, modern replication studies applying White's Reality Check and Hansen's SPA test to expansive universes of technical trading rules (often evaluating over 7,000 combinatorial strategies simultaneously) consistently find that technical indicators lose their predictive power in mature, highly liquid markets such as the US large-cap equities sector 121314. While select anomalies occasionally survive these strict tests in emerging markets or thinly traded assets, the consensus is that the vast majority of optimized technical indicator combinations fail to outperform a simple buy-and-hold benchmark once data snooping is mathematically penalized 1214.
Machine Learning Architectures and Feature Redundancy
The paradigm of systematic trading is undergoing a rapid transition from human-specified technical combinations to advanced machine learning (ML) models capable of digesting ultra-high-dimensional data. Deep learning frameworks, including Long Short-Term Memory (LSTM) networks, Gated Recurrent Units (GRU), deep neural networks (DNN), and Random Forests, are deployed specifically to capture complex, non-linear dependencies in financial time series 1152916. A recurring methodological debate centers on feature engineering: does passing pre-calculated technical indicators as features to a neural network improve its predictive accuracy, or does it merely exacerbate combinatorial overfitting and feature redundancy?
The Paradox of Explicit Indicator Features
Empirical evaluations of deep learning models fed with explicit technical indicators reveal a striking paradox: augmenting the model's feature space with multiple indicators frequently degrades forecasting performance relative to models trained exclusively on raw unadulterated OHLCV price data 1.
In rigorous factorial designs utilizing LSTM and GRU architectures across diverse asset classes, baseline configurations relying solely on raw price inputs consistently achieved the lowest root mean square error (RMSE) and the highest directional accuracy 1. Conversely, models augmented with a comprehensive suite of trend and momentum indicators (such as MACD, RSI, ADX, and Bollinger Bands) exhibited statistically significant performance degradation. In one comprehensive evaluation, the addition of all technical indicators resulted in a 34.6% increase in RMSE relative to the baseline 1.
The discrepancy between training and testing phases further highlights the severity of the overfitting issue. Indicator-enhanced models often achieve seemingly exceptional directional accuracies exceeding 80% to 86% during the in-sample training phase, alongside high $R^2$ values ranging from 0.74 to 0.81 10. However, this accuracy collapses to below 50% (equivalent to or worse than a random coin flip) during out-of-sample testing, while testing $R^2$ values plummet into negative territory 10. Furthermore, correlation coefficients that sit at 0.90 in-sample routinely drop to near zero out-of-sample 10.
The underlying cause of this failure is structural. Deep recurrent architectures natively excel at learning the sequential dependencies, smoothing functions, and relative transformations that traditional technical indicators attempt to rigidly approximate 1. By manually feeding static moving averages and bounded oscillators into the network, practitioners force the model to process redundant, lagging representations of the price data. This artificially inflates the feature space, reduces the effective degrees of freedom, and drives the optimization algorithm to memorize transient noise patterns associated with those specific indicators, completely destroying the model's capacity to generalize to unseen data 1.
Endogenous Representation Learning and Advanced Topologies
An optimal alternative to explicit, manual indicator combinations is the deployment of models that construct their own endogenous representations of market dynamics. For example, Convolutional Neural Networks (CNNs) have been adapted to directly extract predictive patterns from raw, visual price charts. Research demonstrates that CNNs can automatically estimate complex smoothing filters that detect geometric shapes and attributes highly predictive of future returns, bypassing the need for human-engineered indicators entirely 1718.
Instead of arbitrarily selecting a 14-day RSI or a 12-26 MACD, the CNN performs an automated search over raw spatial pixels of historical market data. The resulting predictive patterns extracted by the CNN differ significantly from commonly analyzed trend signals and yield highly accurate return predictions 1718. This methodology largely avoids the data snooping traps inherent in traditional technical analysis by allowing the architecture to optimize its own internal representation of momentum and reversal. Image-based CNN strategies have demonstrated Sharpe ratios doubling those of predefined short-term reversal benchmarks, maintaining robust predictive strength even over longer monthly horizons 17.
Furthermore, the introduction of State-Space Models (SSMs) and specific architectures like Mamba presents a new frontier in handling the extreme non-stationarity and low signal-to-noise ratios of financial data 1920. These models utilize selective scanning mechanisms that efficiently filter out noise during calm market periods while attending heavily to significant price movements, achieving linear-time inference without requiring the manual specification of lagged technical indicators to provide context 1920.
Signal-to-Noise Ratio Variance Across Asset Classes
The efficacy of technical indicators is not uniform or absolute; it is inextricably linked to the underlying microstructure, liquidity profile, and statistical properties of the specific asset class being traded. Financial instruments possess vastly different signal-to-noise ratios. While deep learning optimization strategies and advanced filtering techniques can reduce forecasting error by 15% to 30% in noisy series, the inherent distribution of noise and the persistence of trends dictate which analytical tools are mathematically viable 2136.
Mature Equities and Foreign Exchange
US Equities, particularly large-cap indices like the S&P 500, represent highly mature markets characterized by centralized limit order books, massive participation from passive indexing, and deep liquidity. These markets exhibit a well-documented structural upward drift over long investment horizons and maintain high efficiency. Consequently, the signal-to-noise ratio for forecasting broad beta is relatively high, estimated around 90% 37. However, adverse selection at the individual stock level is generally more severe than at the broad index level 22. Due to this efficiency, traditional short-term oscillator combinations struggle to overcome transaction costs, leading systematic equity strategies to heavily prioritize broad time-series momentum and fundamental risk models over high-frequency technical triggers 2324.
The Foreign Exchange (Forex) market operates with distinct dynamics. Major fiat currency pairs (e.g., EUR/USD, USD/JPY) command immense global liquidity and operate continuously, resulting in generally lower absolute intraday volatility compared to commodities or digital assets 141. Importantly, major Forex pairs exhibit pronounced structural mean-reverting tendencies driven by the balancing effects of international trade, macroeconomic announcements, and central bank monetary policies 1941. Due to these defined trading ranges, the Forex market generally exhibits a higher SNR for specific volatility-based mean-reversion indicators. Empirical studies demonstrate that Forex is a unique asset class where position indicators like Bollinger Bands (%B) can effectively capture these boundaries, leading to marginal reductions in forecasting error that are absent when applied to highly volatile asset classes 1.
Cryptocurrencies and High Reflexivity
Cryptocurrencies represent a novel asset class defined by extreme volatility, fragmented global liquidity, and a remarkably high proportion of noise relative to signal 2543. Analyses utilizing the Hurst exponent and multifractal detrended fluctuation analysis consistently reveal that cryptocurrencies possess distinct multiscale cross-correlations, pronounced long-memory behavior, and heavy-tailed return distributions 44262747.
Advanced research assessing the origins of price dynamics in digital assets has constructed a "reflexivity index" to measure endogenous market activity. Findings indicate that the Bitcoin market exhibits an endogeneity of approximately 80%, meaning that four-fifths of mid-price changes are determined entirely by internal market mechanics and speculative behavior, independent of external macroeconomic variables 28. This extreme reflexivity drives profound momentum clustering but also generates an exceptionally low SNR. When evaluating beta predictability in crypto assets over extended horizons, the signal-to-noise ratio is estimated at a mere 36%, standing in stark contrast to the 90% SNR observed in mature US equities 37.
The practical consequence of this extreme volatility for technical indicators is catastrophic. Because cryptocurrencies experience massive, sustained directional breakouts interspersed with violent drawdowns, bounded momentum oscillators like the RSI are fundamentally compromised. In a strong crypto bull market, the RSI will swiftly breach the traditional "overbought" threshold of 70 and remain anchored there for weeks, rendering mean-reversion signals entirely false and destructive 12. Consequently, empirical evaluations demonstrate that high-volatility assets exhibit 83% higher mean prediction errors when utilizing indicator-augmented forecasting models compared to lower-volatility counterparts, confirming that standard technical rules fail to map the underlying fractal structure of the asset class 1.
Emerging Market Dynamics
Emerging market equities present a unique paradox. Theoretically, less efficient markets should offer higher predictability and larger arbitrage opportunities. However, standard econometric and machine learning implementations often reveal systematically higher forecasting errors in emerging markets compared to developed markets, largely due to immense structural breaks, thinner liquidity, and susceptibility to sudden external shocks 2149.
Yet, when sophisticated deep learning pipelines - such as LSTM networks or CNN hybrids - are applied to meticulously denoised minute-level data, the inefficiency of emerging markets can be exploited. Rigorous walk-forward validations demonstrate that developing market assets can deliver Sharpe ratios 1.2 to 1.6 times higher than developed counterparts, successfully generating alpha by capturing non-linear patterns that traditional technical indicators fail to isolate 21.
| Asset Class | Structural Volatility | Reflexivity / Endogeneity | Estimated SNR (Beta / Direction) | Dominant Indicator / Analytical Efficacy |
|---|---|---|---|---|
| US Large-Cap Equities | Moderate | High (~100% index level) | High (~90% for Beta) 37 | Time-Series Momentum, Broad Trend, Fundamental Risk Factors |
| Foreign Exchange (Majors) | Low to Moderate | Moderate | Moderate (High for mean-reversion) 1 | Volatility Bounds (Bollinger), Mean-Reversion |
| Cryptocurrencies | Extreme | High (~80%) 28 | Low (~36% for Beta) 37 | Pure Price Momentum, Trend Breakout, State-Space Models |
| Emerging Market Equities | High | Variable | Moderate to Low 49 | Deep Learning on Denoised Data, Cross-sectional Momentum |
Time Series Momentum and Robust State Identification
Given the mathematical limitations of individual indicators, the severe statistical dangers of combinatorial overfitting, and the mixed efficacy of deep learning on structured features, the prevailing consensus among institutional quantitative researchers shifts aggressively away from complex, multi-indicator entry triggers. Instead, robust system design pivots to utilizing simple, unified calculations for macroscopic state identification - specifically, Time Series Momentum.
Trend Following as a Persistent State
Time Series Momentum (TSMOM), fundamentally distinct from cross-sectional momentum, evaluates an asset's absolute past performance to forecast its future direction, agnostic to its performance relative to peers. A basic systematic strategy that takes long positions in assets with positive trailing returns (e.g., over a 12-month lookback) and short positions in assets with negative trailing returns has demonstrated robust, statistically significant alpha across decades of market history and across virtually all liquid asset classes 2223502930. Comprehensive studies examining over a century of financial data confirm that trend-following is not a localized, data-snooped anomaly. Rather, it is a persistent market state driven by fundamental behavioral underreaction, prolonged institutional capital flows, and macroeconomic regime shifts 222431.
When designing modern systematic models, the most effective implementations treat trend-following as a continuous state machine rather than an event-driven signal generator 14. An event-driven approach relies on short-term indicator crossovers (e.g., a 12-day EMA crossing above a 26-day EMA) to execute discrete, high-frequency trades. This methodology guarantees lag and exposes the system to severe whipsaw losses during range-bound regimes 32. A state machine approach utilizes a long-term technical filter strictly to define the overarching market regime (e.g., "Bullish State"). The system remains unconditionally long as long as the macro state persists, managing risk through wide trailing stops rather than reacting to the noise of short-term oscillator reversals 14. This implementation drastically reduces turnover, limits transaction costs, and isolates the true risk premium of the trend 1423.
Hierarchical Integration of Orthogonal Information
In institutional portfolio construction, combining signals is most effective when it bridges entirely different data modalities rather than stacking collinear technical patterns. Portable alpha frameworks demonstrate that layering a trend-following momentum strategy alongside tail risk hedging over a standard equity beta portfolio significantly enhances total risk-adjusted performance 2429. The outperformance is driven by complementarity: tail risk hedging mitigates acute equity drawdowns during sudden volatility shocks, while time-series momentum supports the portfolio during protracted, slow-grinding bear markets 24.
When technical indicators are utilized, they must be applied hierarchically to filter operations, strictly separating logic layers to prevent combinatorial overfitting. 1. Regime Definition (Trend): A long-term Moving Average or MACD histogram evaluates the primary structural question: is the market in a trend, a bounded range, or a volatility squeeze? 23. If a macro-trend filter is negative, localized long setups generated by fast oscillators are systematically ignored. 2. Timing and Execution (Momentum): Only once the overarching trend regime is confirmed do shorter-term momentum oscillators become relevant. In an established structural uptrend, an RSI reading dropping below 40 may indicate a localized pullback within the broader bullish state, acting as a value-oriented entry mechanism rather than a macro signal 23. 3. Sizing and Risk Control (Volatility): Volatility indicators such as Bollinger Bands or the Average True Range (ATR) are utilized strictly to scale position sizing inversely to current market volatility, ensuring constant risk parity across shifting regimes without dictating directional bias 5232.
By separating the duties of indicators into distinct, non-overlapping logical tiers - Direction, Execution, and Sizing - practitioners radically minimize the dimensionality of the optimization search space. This prevents the mathematical collinearity that plagues multi-indicator strategies and aligns the quantitative logic with durable macroeconomic realities.
Advanced Filtering Methodologies
Beyond standard technical indicators, the challenge of signal extraction has prompted the adoption of advanced signal processing techniques. The Kalman filter, rooted in Wiener-Kolmogorov theory, represents an optimal filtering methodology designed to minimize the mean square error between an estimated hidden state and the true underlying signal 2. In high-frequency trading, continuous-time Kalman-Bucy filters and Extended Kalman Filters are utilized to handle non-linear dynamics and volatility modeling, isolating the true price state from microstructural noise 2.
Furthermore, spectral analysis utilizing Fourier transforms allows practitioners to decompose financial time series into their fundamental frequency components. By analyzing the spectral density, researchers can separate low-frequency cyclical trends (such as multi-month business cycles) from high-frequency intraday noise 236. These advanced denoising frameworks, when coupled with rigorous out-of-sample validation, offer a mathematically sound alternative to the ad-hoc combination of lagging retail indicators.
Conclusion
The pursuit of algorithmic alpha via the combination of technical indicators demands a rigorous understanding of statistical probability and mathematical redundancy. This extensive analysis demonstrates that blindly stacking trend lines, momentum oscillators, and volatility bounds frequently results in highly collinear models that amplify market noise rather than isolate genuine predictive signals.
When quantitative researchers optimize these combinations across massive historical datasets, they inevitably trigger the multiple testing crisis. Strategies that exhibit flawless in-sample performance are overwhelmingly statistical mirages - artifacts of data snooping that collapse rapidly when exposed to out-of-sample realities. Econometric frameworks such as Combinatorially Symmetric Cross-Validation, the Deflated Sharpe Ratio, and Hansen's Superior Predictive Ability mathematically confirm that the probability of backtest overfitting approaches absolute certainty as the complexity of the combinatorial search space expands without bound.
Furthermore, advancements in machine learning underscore the obsolescence of manual indicator combination. Deep learning architectures trained on raw price data consistently outperform models burdened by explicit technical features. The injection of lagging, pre-calculated transformations artificially inflates the feature space, confusing the neural network and severely degrading out-of-sample generalizability. Alternatively, modern topologies that bypass rigid indicator formulas entirely - such as CNNs analyzing spatial price charts or State-Space Models evaluating sequential ticks - demonstrate that highly predictive, non-linear patterns exist far outside the boundaries of classical technical analysis.
Ultimately, multiple technical indicators offer durable utility only when applied as orthogonal, hierarchical filters defining broader market regimes. When a unified trend metric establishes directional bias, a distinct volatility band dictates dynamic risk sizing, and a momentum oscillator optimizes localized execution, the indicators function correctly: to systematically manage exposure rather than to predict the unpredictable. Divorced from this strict structural discipline, the combination of multiple trading indicators is overwhelmingly a mathematically flawed exercise in overfitting historical noise.