
Aggregate Project Plan for balancing innovation investments
Foundational Origins and Strategic Context
The Aggregate Project Plan (APP) is a strategic portfolio management framework designed to align an organization's product, service, and internal development projects with its overarching corporate strategy, market demands, and finite resource capacities. The framework was formally introduced in 1992 by Harvard Business School professors Steven C. Wheelwright and Kim B. Clark through their foundational text, Revolutionizing Product Development: Quantum Leaps in Speed, Efficiency, and Quality 112. Prior to the formalization of this framework, manufacturing and technology firms frequently approached new product development in an ad hoc, decentralized manner, treating each project as an isolated entity requiring approval 1.
This localized approach to project approval routinely resulted in profound organizational dysfunction. Because executive leadership evaluated initiatives based on individual merit rather than aggregate systemic impact, companies consistently initiated far more projects than their engineering and operational capacities could realistically support 14. The resulting environment was characterized by development malaise, where highly skilled engineers were forced to distribute their attention across too many conflicting priorities 14. Instead of executing strategic objectives, personnel spent the majority of their time resolving crises and fighting fires, leading to plummeting productivity, delayed market launches, and compromised product quality 1.
The Aggregate Project Plan framework resolves this dysfunction by fundamentally restructuring how management views development. It dictates that the long-term competitiveness of a firm is not defined by any single breakthrough project, but by the aggregate sum of the entire project portfolio 15. By visualizing the entire set of projects simultaneously, executives can make explicit decisions regarding resource allocation, project sequencing, and the systematic development of critical organizational capabilities over extended planning horizons 13.
Project Classification Taxonomy
The first operational step in executing an Aggregate Project Plan involves classifying all active and proposed initiatives. Wheelwright and Clark determined that mapping development projects based on a specific set of dimensions provides the empirical data required to dictate resource allocation and appropriate management styles 44. The standard APP taxonomy categorizes projects based on the degree of change required in the product design and the degree of change required in the manufacturing, delivery, or business process 124.
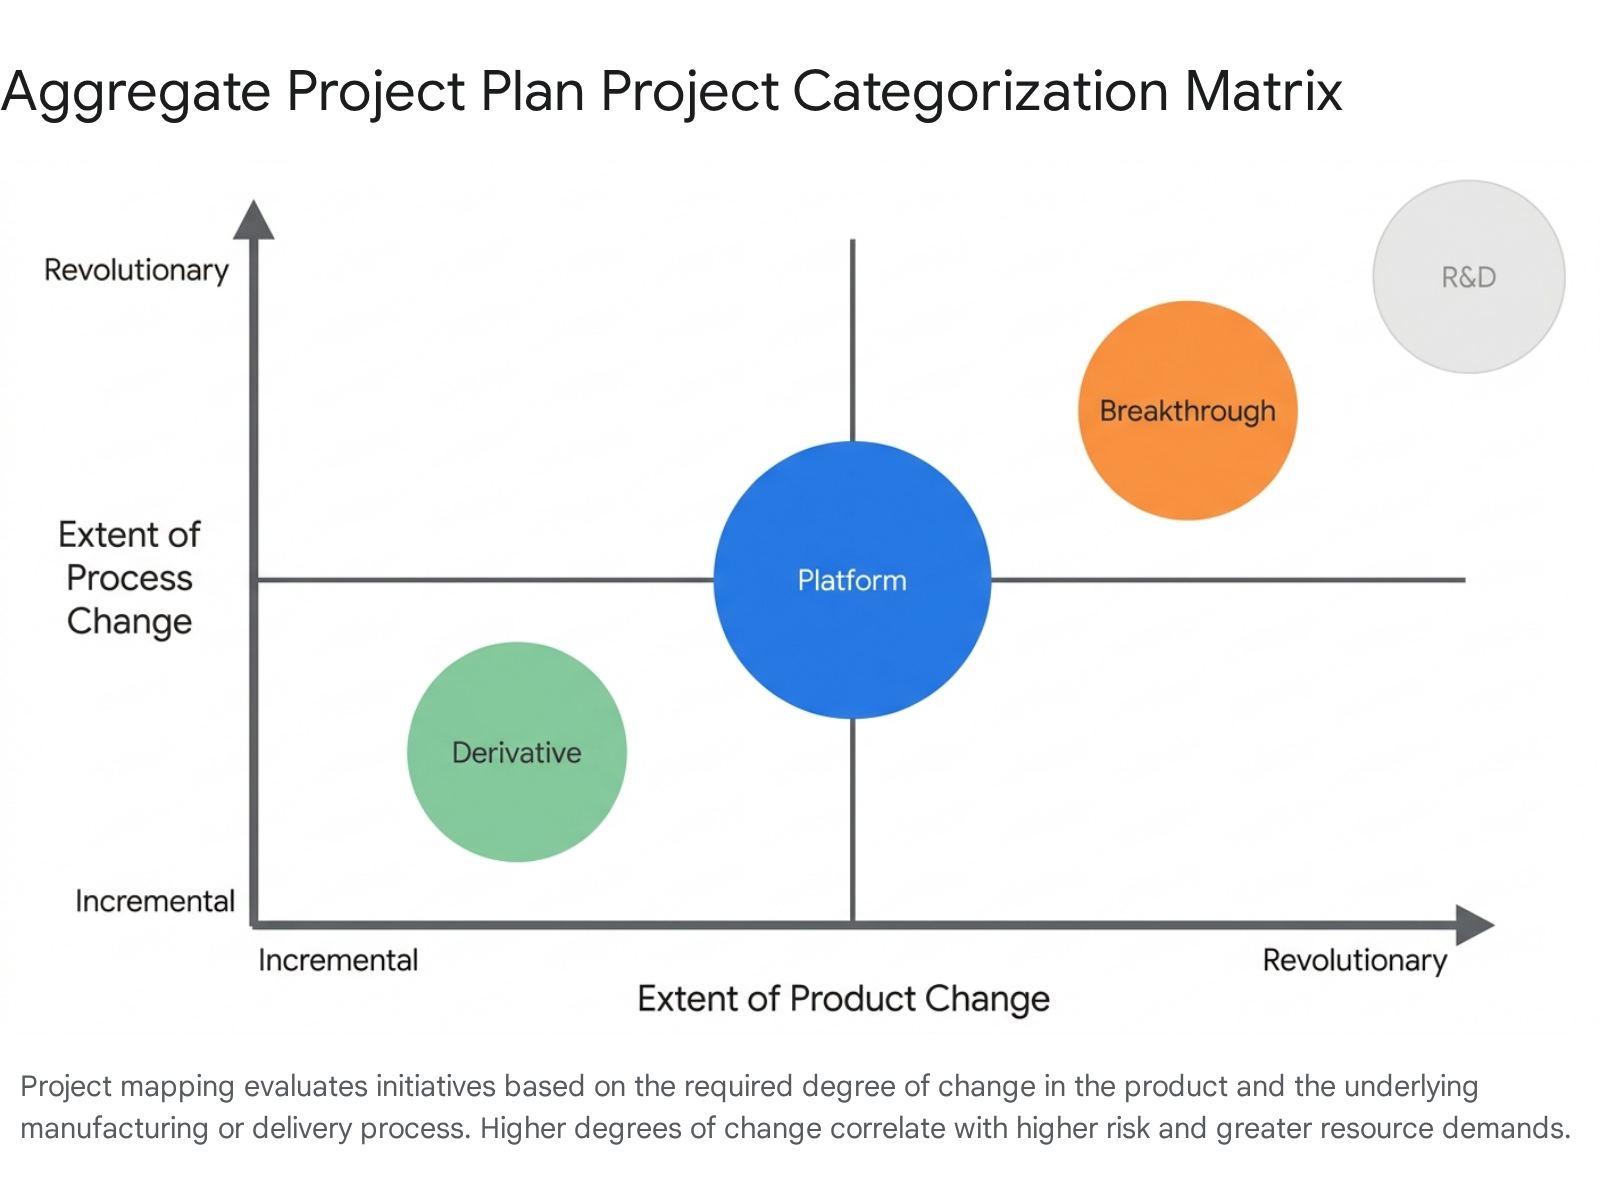
This classification system yields five distinct project types.
Derivative Projects
Derivative projects represent the lowest degree of change within the portfolio. These initiatives involve minor, incremental modifications to existing products or established processes 128. Organizations deploy derivative projects to extend the profitable lifecycle of an existing product family, to offer a cost-reduced version for highly price-sensitive segments, or to add minor feature extensions targeted at specific market niches 28. Because they utilize proven, mature technologies and well-established operational capabilities, derivative projects carry the lowest risk profile 5. They require minimal resource investment and are characterized by rapid execution timelines 5. However, a portfolio overwhelmingly dominated by derivative projects often indicates a strategic vulnerability, suggesting that the firm is maximizing short-term revenue extraction at the expense of long-term capability generation 5.
Platform Projects
Platform projects constitute the core architecture of a company's product strategy. These projects deliver significant, recognizable improvements in cost, quality, and performance compared to previous generations, without relying on highly experimental or unproven technologies 2. The primary objective of a platform project is to establish a robust, scalable foundation designed to meet the needs of a broad, core customer group 12. Once the platform is established, the organization can efficiently launch numerous derivative projects off that single architecture 2. Common industrial examples include the development of a completely new vehicle chassis by an automotive manufacturer, or the engineering of a next-generation microprocessor architecture 2. Due to their scope, platform projects require substantial cross-functional coordination, significant capital allocation, and moderate-to-high risk tolerance.
Breakthrough Projects
Breakthrough projects, alternatively referred to as radical or quantum innovations, demand revolutionary changes to both the product and the underlying operational processes 12. These initiatives deliberately deviate from the firm's established architectures and utilize untried technologies or highly disruptive business models. The objective is to establish entirely new markets, redefine industry standards, or dramatically alter the trajectory of competition. Breakthrough projects inherently carry the highest degree of execution risk and commercial uncertainty 1. They require heavy resource investment over extended timelines, and they typically demand dedicated, isolated teams working outside the standard operational hierarchy to prevent the company's existing culture from suppressing the radical nature of the work 15.
Research and Advanced Development
Research and Development (R&D) projects are fundamentally distinct from commercial product development. These initiatives do not seek to deliver an immediate, market-ready product. Instead, they focus on generating the foundational scientific knowledge, the "know-how and know-why" of novel materials, advanced algorithms, or new physical principles 12. The proprietary knowledge generated by these advanced development efforts is systematically translated into future breakthrough and platform projects. The timeline for commercializing R&D is highly variable and unpredictable, requiring management to view these investments as long-term corporate insurance rather than near-term revenue drivers.
Partnered Projects
Partnered projects encompass strategic alliances, joint ventures, or collaborative development agreements with external organizations 2. Firms utilize this classification when they identify a strategic market opportunity but lack the specific internal technological assets, distribution capabilities, or regulatory access required to execute the initiative independently. Partnered projects allow the firm to share the financial and technical risk burden, though they introduce complex variables related to cross-organizational governance, intellectual property management, and cultural alignment 2.
Balancing Disruptive and Sustaining Innovation
The primary strategic utility of the Aggregate Project Plan lies in its ability to serve as the operational execution mechanism for complex innovation theories. Most notably, the framework provides a structured methodology for organizations to balance sustaining innovations with disruptive innovations, directly addressing the vulnerabilities outlined by Clayton Christensen in his seminal 1997 work, The Innovator's Dilemma 6.
The Divergence of Innovation Trajectories
Christensen's theory establishes a critical dichotomy between two distinct forms of technological advancement. Sustaining innovations focus on improving existing products or services to better serve the needs of incumbent customers operating in established, highly profitable markets 67. These improvements occur along performance vectors that mainstream consumers already prioritize, such as faster processing speeds, higher resolution displays, or improved fuel efficiency 8. Within the construct of the Aggregate Project Plan, sustaining innovations map directly to derivative and platform projects. Historical analysis demonstrates that incumbent market leaders almost invariably win battles of sustaining innovation. Their organizational structures, resource allocation procedures, and cost models are exquisitely tuned to serve their most demanding customers with superior performance, giving them the capital and motivation to fiercely defend their market share against challengers 8.
Disruptive innovations operate according to entirely different economic rules. A disruptive innovation is not a breakthrough technology designed to make a high-end product perform better. Instead, it begins as a product or service that underperforms against traditional metrics 689. However, it offers a novel value proposition by being significantly cheaper, structurally simpler, or highly convenient 89. Disruptive technologies enter the market through one of two pathways. The first is low-end disruption, which targets overserved customers who do not require, and are unwilling to pay for, the full performance capabilities demanded by the high end of the market 7. The second pathway is new-market disruption, which targets non-consumers who previously lacked the financial capital, technical skill, or access required to use the existing product category 79.
The trajectory of disruption is highly predictable and has been observed across numerous industries. The disruptor enters at the bottom of the market with a low-margin offering. The incumbent firm observes the new entrant but rationally chooses to ignore it, as the margins in that low-end segment are fundamentally unattractive and do not meet the corporate hurdle rate required to justify investment 89. The incumbent instead focuses its capital on sustaining innovations for its most profitable clients. Over time, however, the disruptor steadily improves its underlying technology. Eventually, the disruptive product crosses a performance threshold where it becomes adequate for mainstream customers, at which point the disruptor swiftly displaces the incumbent 679.
Industrial Evidence of Disruption
Christensen identified the computer hard disk drive industry as the "fruit fly" of innovation analysis because its rapid evolution allowed researchers to observe disruptive cycles in real-time 8. The industry progressed from 14-inch mainframe drives to 8-inch drives for minicomputers, and subsequently to 5.25-inch and 3.5-inch drives 8. During each architectural transition, the dominant market leaders were completely displaced. For example, when 8-inch drives were introduced, they offered lower total capacity and a higher cost-per-megabyte than existing 14-inch drives. Mainframe manufacturers, the primary customers of the incumbents, rejected the 8-inch drives outright due to inadequate specifications. However, the emerging minicomputer market found the smaller form factor perfectly aligned with their architectural needs. By the time the 8-inch drive manufacturers improved their capacity to satisfy mainframe requirements, the original 14-inch manufacturers had lost the market 8.
A similar dynamic occurred in the steel industry. Integrated steel mills utilizing massive blast furnaces yielded high-quality structural steel. Upstart mini-mills, utilizing electric arc furnace processing, initially produced low-quality rebar - the lowest margin product in the industry 89. Integrated mills gladly ceded the rebar market to focus on high-margin products like sheet steel. However, the mini-mills possessed a business model that offered a 20% cost advantage, and they relentlessly improved their quality until they systematically captured the market for angle iron, structural beams, and eventually, high-grade sheet metal, forcing several integrated mills into bankruptcy 89.
Utilizing the APP to Neutralize the Innovator's Dilemma
Extensive empirical analysis confirms that incumbent failures in the face of disruption are rarely caused by a lack of engineering capability or an inability to foresee technological trends. In nearly 40% of cases studied, incumbent firms possessed the explicit capabilities to respond to the new threat, but fundamentally failed to deploy them 710. The failure is deeply rooted in resource allocation mechanisms. If an organization evaluates all proposed projects based solely on short-term financial metrics - such as Net Present Value (NPV), Return on Investment (ROI), or high hurdle rates - sustaining initiatives will monopolize 100% of the firm's capital. Derivative and platform projects targeting top-tier clients always project higher immediate returns and lower risk than breakthrough bets aimed at unproven, low-margin segments 4711.
The Aggregate Project Plan neutralizes this structural bias by forcing executive leadership to explicitly define the desired mix of projects before funding individual initiatives. Management commits to ring-fencing a specific percentage of overall capacity for breakthrough and advanced R&D projects. This rigid portfolio allocation ensures that high-risk, potentially disruptive innovations receive guaranteed funding and operational support, protecting them from the gravitational pull of sustaining projects that demand immediate profitability 412. By dedicating these resources, the firm creates a dual operating system that maximizes current market share while simultaneously building the organizational competencies required for the next industrial epoch 1217.
| Innovation Type | Target Customer Segment | Initial Performance Profile | Primary Business Motivation | Corresponding APP Category |
|---|---|---|---|---|
| Sustaining Innovation | Existing, highly demanding mainstream customers. | Superior or equivalent to current market standards. | Defend high profit margins; retain current market share. | Derivative Projects, Platform Projects |
| Low-End Disruption | Overserved customers in the existing market. | Inferior on traditional metrics; adequate on basic utility. | Capture volume in segments deemed unattractive by incumbents. | Breakthrough Projects |
| New-Market Disruption | Non-consumers lacking prior access or capital. | Vastly inferior to traditional metrics, but highly accessible. | Create an entirely new value network and consumption model. | Breakthrough Projects |
Capacity Management and Resource Constraints
While the strategic allocation of project types is the theoretical core of the Aggregate Project Plan, the framework's practical success relies entirely on rigorous capacity management. Without a comprehensive aggregate view, organizations operate under the dangerous assumption that simply approving more projects will automatically result in increased output. Operations management principles definitively prove that overloading a system beyond its capacity exponentially increases lead times and degrades quality.
The Dynamics of Demand and Capacity Planning
In the context of the APP, aggregate planning is defined as the process of aligning demand - the total resource requirements of the approved project portfolio - with capacity - the total available human capital, equipment, and financial resources - over a near- to medium-term horizon spanning three to eighteen months 181314. This medium-term horizon provides sufficient visibility for strategic adjustments while maintaining agility in response to market fluctuations 13.
Achieving equilibrium between demand and capacity is a mathematically precise endeavor. If system capacity frequently exceeds aggregate demand, the organization incurs severe financial waste through idle labor, underutilized machinery, and excessive inventory holding costs 1815. Conversely, if aggregate demand chronically outweighs capacity, the operational system begins to break down. This imbalance triggers a cascade of poor outcomes, including missed delivery milestones, severe strain on human resources, diminishing work quality, and the loss of lucrative market opportunities 18.
To manage these variables, industrial engineers and project management offices utilize three primary aggregate planning strategies: 1. The Level Strategy: The organization establishes a constant production rate and maintains a stable, unchanging workforce level. Fluctuations in demand are absorbed through the accumulation of inventory during slow periods, or the acceptance of customer backlogs and extended delivery times during peak periods 1814. This strategy minimizes human resource costs related to hiring and training but carries severe risks if storage capacity constraints are breached or if customers are unwilling to tolerate backorders 13. 2. The Chase Strategy: The organization dynamically matches capacity to the exact demand of the current project pipeline. This is achieved by rapidly expanding or contracting the workforce through hiring, layoffs, extensive overtime, or reliance on subcontractors and temporary labor 181314. While this minimizes inventory holding costs and eliminates backlogs, it introduces profound operational instability, degrades team morale, and incurs massive administrative costs associated with workforce volatility. 3. The Hybrid Strategy: A mathematical equilibrium that blends both level and chase methodologies. The organization seeks to optimize costs by utilizing a baseline level workforce while absorbing moderate demand peaks through carefully calculated overtime, highly targeted subcontracting, and strategic inventory buffers 18.
Bottleneck Identification and Productivity Decay
In highly technical product development and software engineering environments, human capital is the absolute, inflexible constraint. Decades of research have confirmed the severe penalties associated with task-switching and cognitive overload. Studies by Spitzer in 1939 established empirical forgetting curves, demonstrating that individuals lose significant contextual information when separated from a complex task for even minor intervals 16. Building upon this, the foundational research by Clark and Wheelwright identified a catastrophic drop in value-adding activity when engineers are assigned to more than two concurrent projects 16. When an engineer is spread across three or four initiatives, the administrative overhead of context switching, attending redundant status meetings, and reacquainting themselves with complex codebases or engineering schematics consumes the majority of their available time, driving actual productivity toward zero.
To prevent this systemic collapse, the Aggregate Project Plan must incorporate principles from the Theory of Constraints (TOC). The TOC posits that every complex system contains at least one constraint, or bottleneck, that strictly dictates the maximum throughput of the entire operation 17. In a project environment, a bottleneck is not merely a slow process step; it is frequently a highly specialized key resource, such as a lead systems architect or a senior data scientist.
Modern bottleneck identification requires rigorous analytical tools to measure inter-arrival times between units of work, processing durations, and systemic variability 1617. Organizations adapting manufacturing mathematics to knowledge work track metrics such as Good Quantity (GQ), Scrap Quantity (SQ), and Rework Quantity (RQ) to determine Total Production Quantity (PQ = GQ + SQ + RQ) 1825. By quantifying the exact capacity lost to defects and rework, PMOs can precisely calculate effective capacity under various operating scenarios 13. A foundational rule of the Aggregate Project Plan is that no commitments should be made regarding a project schedule until the availability of all key resources across all active projects has been mathematically confirmed 19. To maintain agility, best practices suggest leaving a buffer of roughly six percent of total engineering capacity strictly uncommitted, allowing the organization to absorb unexpected crises or rapidly capitalize on unforeseen market opportunities without derailing the existing portfolio 12.
The Zombie Project Phenomenon
A direct and costly consequence of failing to implement rigorous capacity constraints is the proliferation of "zombie projects." In the lexicon of project management, a zombie project is an initiative that is technically "undead" - it lacks the viability or strategic alignment required to succeed, yet it remains active in the system, continuously consuming finite resources because management lacks the governance discipline to formally terminate it 2728.
The Pathology of Undead Initiatives
Zombie projects rarely begin as obvious failures; they typically originate as bold, well-intentioned strategic bets 29. However, as broader market conditions shift, underlying technologies evolve, or the original executive sponsor departs the organization, the foundational business case for the project silently evaporates 272829.
Despite delivering no tangible value for months or even years, these initiatives survive due to a confluence of deep-seated organizational dysfunctions. The most prominent driver is the sunk cost fallacy, where leadership remains hesitant to abandon an initiative simply because significant capital has already been expended 2730. This is compounded by a pervasive ambiguity regarding ownership. In highly matrixed environments, there is often no clear business owner empowered with the absolute authority to execute a termination decision 2820. Furthermore, many corporate cultures equate project cancellation with personal incompetence or departmental failure. This fear incentivizes project managers and stakeholders to continually report false progress, stretching roadmaps indefinitely to hide strategic drift, rather than admitting defeat 272829.
Identifying a zombie project requires vigilant oversight. Key warning signs include project goals that have become exceedingly vague or are subject to constant revision, project timelines that stretch indefinitely with promises of "just one more push," status dashboards that remain perpetually yellow or stagnant, and core teams staffed entirely by part-time personnel exhibiting low morale 2829. Furthermore, if team members are unable to articulate the project's purpose or its expected business benefit in a single, coherent sentence, the initiative has likely devolved into a zombie state 2930.
Opportunity Costs and the Clean Close Methodology
The persistence of zombie projects inflicts profound damage on organizational health. Beyond the obvious financial waste, these projects represent a severe opportunity cost. Every hour of engineering talent, every dollar of capital, and every tonne of carbon dioxide (CO2) emissions allocated to an undead project is a resource directly diverted from high-impact, regenerative, or breakthrough initiatives 27. In an era of intense focus on Environmental, Social, and Governance (ESG) criteria, keeping a zombie project alive is not merely inefficient; it is actively irresponsible, as it wastes physical materials and carbon budgets on outcomes that no longer matter to the market or the organization's strategic mission 27.
The Aggregate Project Plan serves as a structural defense mechanism against zombie projects by enforcing a hard, mathematical ceiling on resource capacity. Because the APP maps all active projects against a strictly finite pool of engineering hours and capital, the introduction of a new, highly prioritized initiative forces a direct confrontation with the existing portfolio. To fund the new project, lower-value initiatives must be explicitly paused or canceled 512.
To execute these cancellations without destroying organizational trust, leading enterprises employ a strict "clean close" methodology. A clean close removes the emotional stigma of failure, reframing the cancellation as a strategic, necessary recalibration. The process requires leadership to explicitly announce the termination to halt the spread of rumor-driven anxiety, rapidly reallocate the freed talent to high-priority initiatives to protect employment stability, and conduct rigorous post-mortem reviews 27282921. To adhere to the "No Surprises Rule" in executive governance, these post-mortems are often diplomatically rebranded as "Project Rescue Planning" meetings, allowing the team to document lessons learned and capture knowledge without fear of retribution 21. By normalizing project closure, organizations ensure that activity is never mistaken for true momentum.
| Healthy Project Indicators | Zombie Project Symptoms |
|---|---|
| Strategic Alignment: Clear, documented link to current organizational OKRs and ESG targets. | Strategic Drift: Objectives are vague, outdated, or disconnected from current corporate priorities. |
| Governance: Single, highly engaged executive sponsor with explicit decision-making authority. | Ambiguity: Passive stakeholder interest; no one willing to champion or defend the project if challenged. |
| Measurement: Tracks leading indicators of business outcomes and value realization. | Measurement: Tracks mere activity volume; milestones stretch indefinitely; dashboards stagnate. |
| Resource Allocation: Fully funded with dedicated, focused teams operating within capacity limits. | Resource Drain: Staffed by fractured, part-time teams exhibiting low morale; budget bleeds continuously. |
| Lifecycle Analysis: Clear exit criteria and willingness to terminate if the business case invalidates. | Sunk Cost Trap: Project survives entirely on the justification of prior investments already made. |
Portfolio Risk Management and Financial Benchmarks
As organizations scale their operations, risk management must evolve from a tactical, project-centric focus to a strategic, portfolio-wide discipline. Traditional project risk management is constrained by the boundaries of a specific project charter, where managers focus exclusively on mitigating threats that impact an isolated critical path 33. Project Portfolio Risk Management (PPRM), conversely, operates at the enterprise level, recognizing that risks interconnect, compound, and cascade across the entire aggregate plan.
Scaling Risk Assessment Across the Portfolio
Portfolio risk management evaluates how a delay in one derivative project affects the resource availability for a critical platform project, or how a cost overrun in a breakthrough initiative impacts the funding for the broader portfolio 33. These enterprise-level threats are fundamentally distinct from execution risks and encompass broad categories such as resource bottlenecks, strategic misalignment, financial interdependencies, and technological integration failures 3334.
To scale risk management across hundreds of concurrent projects, PMOs must establish a universally standardized risk taxonomy. This ensures that a threat classified as a "critical risk" in the IT division adheres to the same severity parameters as a "critical risk" in the manufacturing division, allowing executive leadership to compare aggregate risk exposure objectively 33. Assessment utilizes standardized risk matrices, typically confined to 3x3, 4x4, or 5x5 grids to plot the probability of an event against its potential severity, preventing unnecessary analytical complexity 35.
In modern financial and operational environments, this fundamental matrix approach is heavily augmented by advanced quantitative models. Organizations increasingly integrate sophisticated metrics to understand worst-case scenarios, including Maximum Drawdown analysis, which measures the potential impact of a severe market contraction on the portfolio, and Value-at-Risk (VaR) modeling, which quantifies the maximum potential financial loss over a specific timeframe at a given confidence level 34. Additionally, Beta-Adjusted Returns are utilized to measure portfolio performance relative to systemic, unavoidable market risks 34.
Financial Modeling and ROI Benchmarks
Evaluating the financial viability of an aggregate plan requires moving beyond simplistic cost-versus-output calculations. While Net Present Value (NPV) - the difference between the present value of future cash inflows and outflows - is a widely recognized metric for individual initiatives, it struggles to contextualize portfolios containing projects of vastly different scales 22. Financial analysts typically elevate to the Profitability Index (PI). By dividing the present value of future cash flows by the initial investment, PI standardizes the return ratio, allowing leaders to evaluate the entire aggregate portfolio as if it were a single, cohesive investment vehicle 22. To ensure discipline, companies establish rigorous hurdle rates, derived from the firm's Weighted Average Cost of Capital (WACC), which serve as the absolute minimum return threshold a project must project to justify absorbing aggregate capacity 22.
The financial incentive to tightly integrate aggregate project planning with corporate responsibility is profound. Groundbreaking research published in the Project ROI 2025 update analyzed over 600 academic and private sector studies to conclusively settle the debate regarding sustainable business practices. The data indicates that organizations implementing rigorous portfolio management aligned with corporate responsibility and sustainability can boost overall firm value by up to 36% 37. Furthermore, these well-governed portfolios drive profitability increases of up to 21%, boost sales by 20%, and enhance direct shareholder returns by up to 6% 37.
Achieving these returns requires the establishment of strict pre-project baselines and the continuous tracking of leading indicators. For instance, in scaled agile environments, teams utilize a "Confidence Vote" metric prior to execution. If the aggregate vote averages below 3 on a standard 1-5 scale, it serves as an empirical, leading indicator that the execution plan - and therefore the projected financial ROI - is statistically at risk before a single dollar of capital is deployed 38.
Lean Portfolio Management Adaptation
The original Aggregate Project Plan framework was conceptualized in the early 1990s, an era dominated by physical manufacturing and highly sequential, phase-gated development lifecycles. However, as the global economy has transitioned toward software, digital services, and continuous delivery models, the core tenets of the APP have been adapted and integrated into Lean Portfolio Management (LPM).
The Structural Shift from Projects to Products
Traditional Project Portfolio Management (PPM) relies heavily on strict hierarchical control and rigid, annual budgeting cycles. In this traditional model, business cases are approved individually, and transient teams are assembled specifically to execute a distinct, time-bound project. Success is measured by tracking lagging indicators of output: whether the project was delivered on time, within the established budget, and strictly adhered to the predetermined scope 1739. However, this model breaks down in highly volatile, complex environments because organizations frequently deliver 100% of the planned scope on time and on budget, yet achieve absolutely none of the intended business value 39.
Lean Portfolio Management, popularized by enterprise architectures like the Scaled Agile Framework (SAFe), fundamentally alters this structure. Instead of organizing people around transient projects, LPM organizes funding and personnel around continuous, long-lived "Value Streams" and cross-functional Agile Release Trains (ARTs) 1740. The focus shifts entirely from measuring output to measuring outcomes. Rather than tracking project completion percentages, LPM utilizes Objectives and Key Results (OKRs) to evaluate whether the continuous flow of work is actually validating the business hypotheses that justified the initial investment, moving the needle on strategic goals 39.
Managing Flow and WIP Limits
A critical intersection between the traditional Aggregate Project Plan and Lean Portfolio Management is the absolute enforcement of capacity constraints. While traditional PPM often suffers from unlimited job approvals that overload the system, LPM regulates the intake of work using strict Kanban systems and Work In Process (WIP) limits 1739. By monitoring advanced flow metrics - such as Cycle Time, Throughput, and overall WIP - portfolio managers gain real-time visibility into the operational health of the value streams, ensuring that the system is never pushed beyond its mathematical capacity 39.
| Structural Dimension | Traditional Project Portfolio Management (PPM) | Lean Portfolio Management (LPM) |
|---|---|---|
| Funding Allocation | Capital is allocated to individual, discrete projects based on highly detailed, upfront business cases. | Capital is allocated to continuous Value Streams; budgets are adjusted dynamically based on ongoing learning. |
| Planning Horizon | Rigid, annual planning and budgeting cycles that resist mid-year realignment. | Gradual, incremental planning synchronized with frequent delivery cadences (e.g., Program Increment planning). |
| Organizational Structure | Strict hierarchy; resources are siloed by function and matrixed across multiple transient projects. | Networked, cross-functional Agile Release Trains (ARTs) dedicated full-time to specific value streams. |
| Primary Success Metrics | On-time delivery, budget compliance, and scope completion (Output-focused). | Business Value Achievement, Flow Metrics, and OKR alignment (Outcome-focused). |
| Work Intake Control | Infinite demand; unlimited project approvals leading to overloaded systemic capacity. | Strict demand management regulated by Kanban systems and hard Work In Process (WIP) limits. |
173940
Technological Enablement and Market Dynamics
The sophisticated mathematical requirements of the Aggregate Project Plan - calculating complex resource allocations, identifying bottlenecks through inter-arrival times, running Monte Carlo risk simulations, and balancing multi-year financial portfolios - cannot be executed using static spreadsheets. Consequently, the discipline of project management has evolved in tandem with the rise of enterprise-grade Strategic Portfolio Management (SPM) software 1841.
Global Expansion of the SPM Market
The software infrastructure required to manage global corporate portfolios represents a massive, rapidly expanding sector of the technology economy. In 2023, the global project management software market was valued at USD 7.29 billion. Driven by the critical need to reduce organizational disparities, manage remote workforces, and optimize resource allocation, the market is projected to reach USD 27.29 billion by the year 2032, expanding at a robust Compound Annual Growth Rate (CAGR) of 15.8% 42.
This explosive growth is reflected across all major global regions. In Europe, the project management software market generated USD 1,747.3 million in revenue in 2023, and analysts project a CAGR of 15.3% through the year 2030, heavily influenced by advanced digitalization initiatives in the United Kingdom and Germany 23. The Asia-Pacific region demonstrates an even more aggressive trajectory. Valued at USD 1,644.78 million in 2024, the APAC market is forecast to expand at a CAGR of 18.0% through 2031 44.
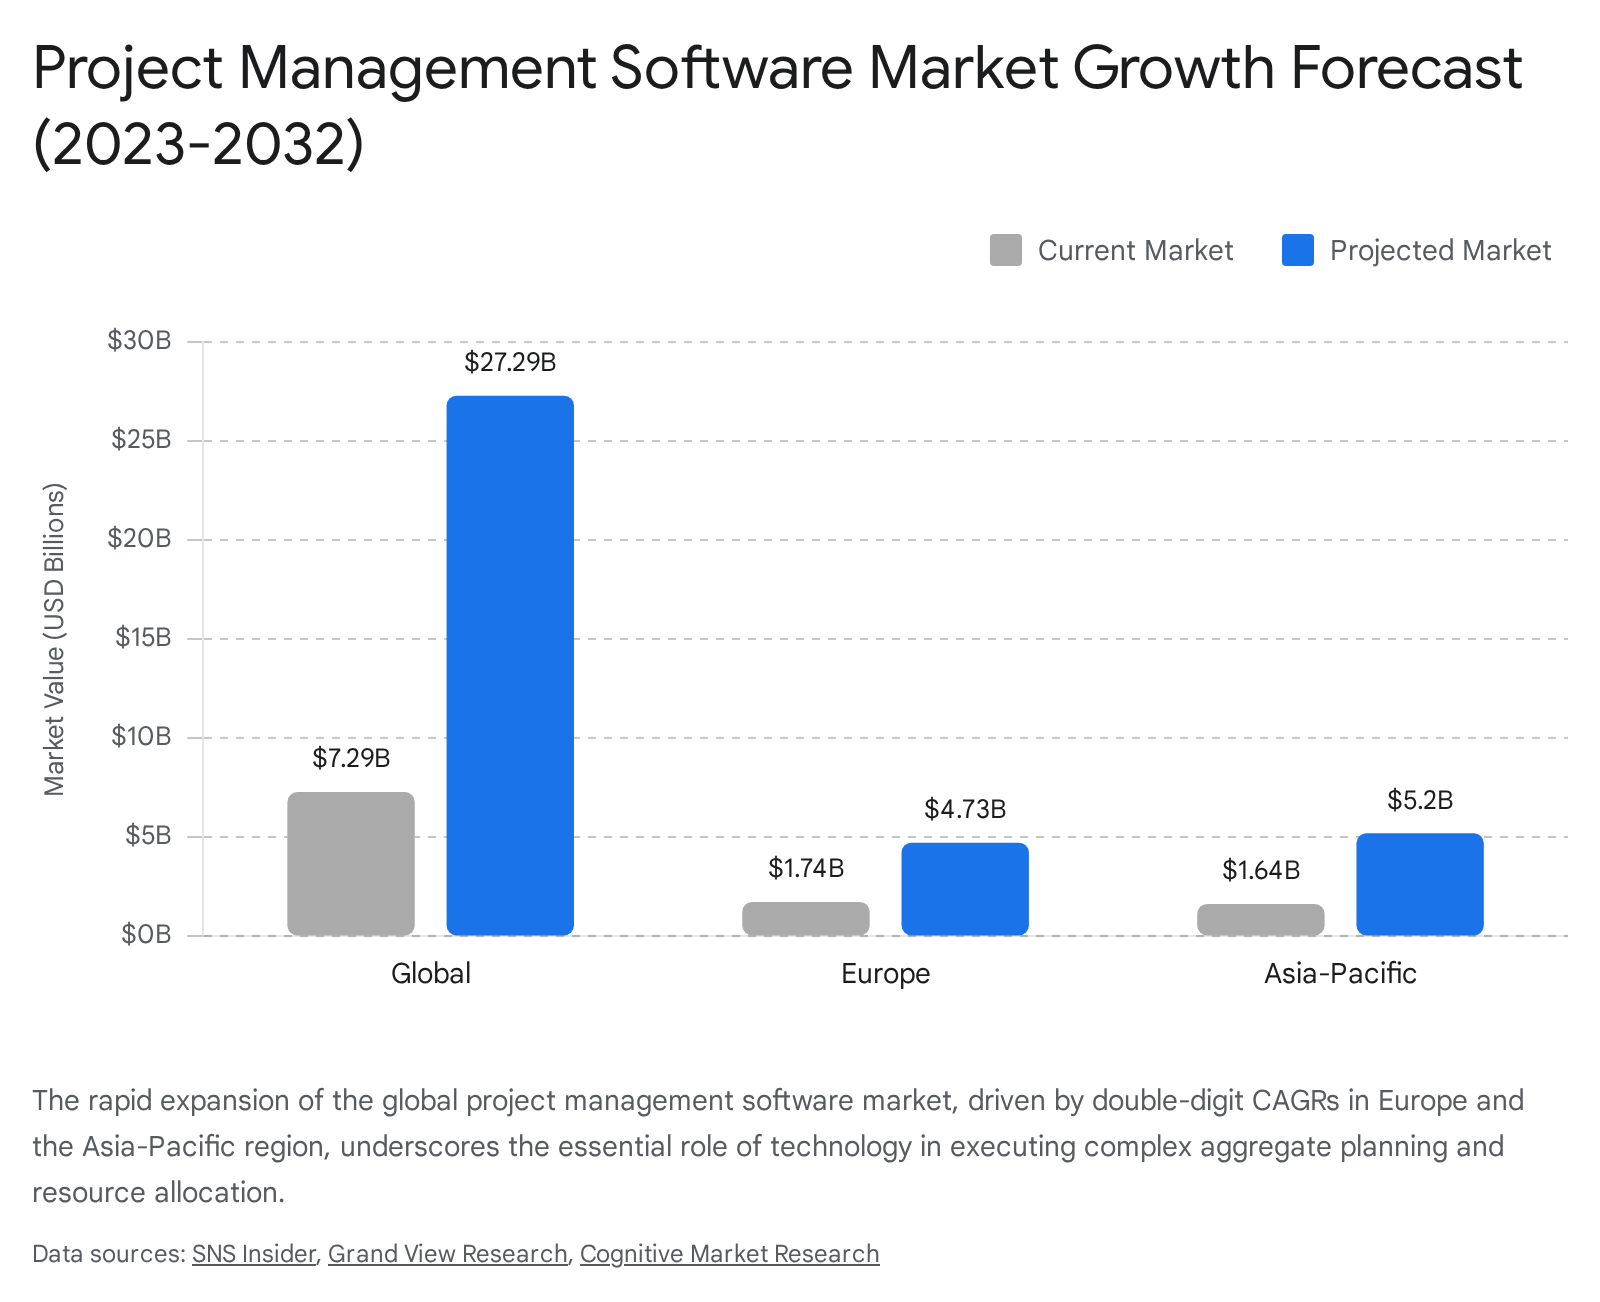
This regional acceleration is primarily fueled by rapid infrastructure development and digital transformation within the Construction, Healthcare, and Information Technology sectors, where organizations require sophisticated platforms to coordinate complex supply chains and intricate product lifecycles 44.
Advanced Software Capabilities
Modern Strategic Portfolio Management platforms - including industry leaders such as Smartsheet, Monday.com, Wrike, Asana, and Planisware - provide the computational power necessary to implement the Aggregate Project Plan 183341. These platforms shift operations away from siloed data by providing unified, portfolio-level visibility, allowing executives to track cross-project resource allocations down to fractional percentages to absolutely prevent over-allocation and burnout 4124.
Crucially, these systems automate the complex task of capacity management through advanced algorithms. When demand exceeds capacity, software tools can autonomously execute resource leveling, which systematically extends specific task or project deadlines to accommodate hard limitations in the workforce 46. Alternatively, the systems can perform resource smoothing, which mathematically evens out human workloads by redirecting assignments to high-priority activities utilizing available float time, ensuring the critical path of the project remains completely uninterrupted 46.
Furthermore, the integration of Artificial Intelligence (AI) into SPM platforms has revolutionized portfolio risk management. Dedicated AI agents continuously scan the aggregate data environment, performing scenario planning, predicting capacity bottlenecks before they manifest, and highlighting when project velocity drops off track 203324. By continuously surfacing stalled work, flagging strategic misalignment, and identifying accelerating risk trends, these platforms empower organizations to make data-driven decisions to dynamically reallocate capital or execute clean closures of zombie projects with unprecedented speed and confidence 2033.
Implementation Case Studies and Governance Challenges
The theoretical elegance of the Aggregate Project Plan is thoroughly validated by empirical application, yet historical case studies reveal that successfully deploying the framework requires immense executive discipline.
The PreQuip Audit: Resolving Capacity Collapse
In their foundational 1992 research, Wheelwright and Clark documented the severe operational crisis at a scientific instruments manufacturer pseudonymously named "PreQuip" 4. Driven by aggressive market competition, PreQuip's executive leadership had developed a habit of approving nearly every proposed development project, assuming that a larger pipeline equated to higher innovation output. Upon conducting a comprehensive audit of their development environment, the leadership team was alarmed to discover 30 massive projects actively underway simultaneously 4.
To quantify the crisis, analysts measured the exact engineering capacity of the firm against the total resource requirements of the 30 active projects. The firm possessed a theoretical maximum capacity of 960 engineering months per year. However, the data revealed that maintaining the 30 projects on schedule, combined with non-project development duties, meant the firm had overcommitted its development resources by a factor of three over its entire three-year planning horizon 4. This catastrophic overallocation ensured that products were invariably late to market, as engineers were trapped in a continuous cycle of operational firefighting rather than value creation 14.
By rigorously implementing an Aggregate Project Plan, PreQuip's management was forced to categorize the 30 projects, eliminate low-value initiatives, and sequence the remaining projects chronologically to fit within the hard limit of 960 engineering months. This process restored sanity to the development environment, significantly improved resource utilization, and fundamentally transformed the company's ability to deliver products predictably 412.
Kirkham Instruments: The Necessity of Executive Governance
While the PreQuip case demonstrates the mathematical necessity of the APP, a subsequent case study analyzing "Kirkham Instruments" highlights the severe cultural and governance challenges associated with implementation 25. Kirkham Instruments recognized that its disparate business units were advancing far too many uncoordinated, overlapping initiatives, resulting in a systemic lack of prioritization 25.
Management attempted to deploy an Aggregate Project Plan alongside innovation funnels and phase-gate reviews to balance their short-term and long-term project mix 25. However, the implementation faltered due to profound organizational resistance. The core problem was a failure of top management. Executive leadership failed to enforce hard resource boundaries across the fiercely independent business units, allowing division heads to continue hoarding resources for their favored derivative projects 25. Furthermore, the firm failed to align incentive structures with the new portfolio strategy and provided inadequate training to project managers regarding the new capacity constraints 25.
The Kirkham Instruments case definitively proves that the Aggregate Project Plan is not merely a mathematical exercise or an administrative tool; it is a profound change-management initiative. Without uncompromising executive governance, strict enforcement of capacity ceilings, and a culture willing to terminate unaligned projects, the framework cannot overcome the entrenched departmental politics that drive resource overallocation 25.
Conclusion
The Aggregate Project Plan remains a foundational mechanism for bridging the critical divide between high-level corporate innovation strategy and practical, day-to-day operational execution. By forcing organizations to comprehensively categorize their initiatives, confront their absolute capacity constraints, and deliberately balance their portfolio across a spectrum of risk profiles and technological complexity, the framework systematically eliminates the chaotic resource dilution that inherently causes project failure.
Most importantly, the APP provides the structural, mathematical discipline required to survive the innovator's dilemma. By explicitly ring-fencing resources for breakthrough initiatives and advanced R&D, organizations can systematically fund the disruptive innovations necessary to secure long-term market dominance, effectively shielding these vital future bets from the overwhelming gravitational pull of short-term financial incentives. As global markets grow increasingly complex and the margins for error compress, the foundational principles of aggregate planning - relentless strategic prioritization, uncompromising capacity management, and the courageous elimination of zombie projects - are essential for sustained industrial competitiveness.