What Is Risk/Reward Ratio in Trading and How to Calculate It
Consider the everyday decision of jaywalking across a busy, multi-lane highway. If the objective is to pick up a discarded penny from the median, the potential catastrophic risk to life and limb far outweighs the trivial reward, making the action profoundly irrational. Conversely, if the objective is to retrieve a bag containing one million dollars, the calculus shifts entirely; the risk, while still severe, is offset by a massive, asymmetrical reward that fundamentally alters the decision-making process. Financial markets operate on this exact same spectrum of calculated exposure.
What is the risk/reward ratio in trading, and how is it calculated? The risk/reward ratio is a mathematical comparison between the maximum potential capital loss of a trade and its expected profit. It is calculated by identifying the entry price, establishing a stop-loss price to strictly cap downside exposure, defining a take-profit price target, and subsequently dividing the total monetary risk by the total potential reward. This fundamental metric allows investors to objectively quantify whether the potential upside of a market position mathematically justifies the financial exposure before committing any capital to the live market. 12
This report provides an exhaustive, evidence-based exploration of the risk/reward ratio and its role in systematic capital preservation. Drawing upon established financial institutions, regulatory guidance from the Securities and Exchange Commission (SEC) and the Financial Industry Regulatory Authority (FINRA), and peer-reviewed behavioral finance research from 2023 onwards, the analysis deconstructs the mathematical framework of trade expectancy. Furthermore, it details the mechanics of execution using specific order types, examines the psychological impact of modern digital trading platforms, and explores how risk metrics must adapt across diverse asset classes from equities to decentralized cryptocurrencies.
How Does the "Insurance Deductible" Analogy Explain Risk and Reward?
To understand the core philosophy of the risk/reward ratio, one can look to the insurance market - specifically, the mechanism of the insurance deductible. When an individual purchases a homeowner's or auto insurance policy, they are essentially choosing a future budget constraint that dictates their liquidity in the event of an adverse event. 1 In this framework, choosing a higher deductible is equivalent to retaining a larger portion of the risk. By accepting a higher deductible, the individual significantly reduces their upfront premium cost, thereby lowering the ongoing cost of maintaining the insurance. Conversely, choosing a lower deductible severely reduces the financial risk in the event of an accident, but requires paying a proportionately higher upfront premium to the underwriter. 2
The market prices this transfer of risk efficiently. Behavioral finance research notes that consumers frequently view insurance not merely as a hedge, but almost as an investment. They often opt for the smallest possible deductible, paying premiums that are far in excess of the actuarially fair value, simply to avoid financial anxiety. 3 In effect, people pay a premium for psychological comfort, willingly accepting a mathematically suboptimal risk/reward scenario to eliminate the pain of a moderate out-of-pocket loss. 3
In financial markets, establishing a risk/reward ratio operates on the exact same premise of transforming, retaining, and pricing risk. 6 An investor structuring a trade is effectively underwriting a policy on a financial asset. The stop-loss order acts as the deductible - the absolute maximum out-of-pocket expense the investor is willing to absorb if the market moves against the position. The potential profit target represents the anticipated insurance payout. Just as an insurance company calculates the mathematical probability of a claim against the premium collected, a financial trader must weigh the probability of an asset reaching a profit target against the size of the accepted deductible. 26
If a trader sets an extremely tight stop-loss, mimicking a low insurance deductible, they will be stopped out frequently by normal, everyday market volatility. This is analogous to paying a high frequency of small premium costs, which slowly erodes capital. 78 If they set a very wide stop-loss, they give the trade substantial room to breathe and avoid frequent minor losses, but they expose their portfolio to a catastrophic loss if the fundamental thesis of the trade is entirely wrong. 78 The concept of insurance is paramount in strategies like trend following, where the risk that must be managed - either directly through an options straddle premium or indirectly through a wide stop-loss - is market whipsaw. Investors who pay an upfront premium explicitly limit their risk, transforming severe whipsaw risk into a known, quantified cost. 6
What is the Risk/Reward Ratio, and How Do You Calculate It?
The mathematical calculation of the risk/reward ratio is structurally straightforward, yet it forms the absolute foundation of institutional risk management and longevity in the markets. The ratio is derived by dividing the potential loss of a position by its potential gain. 9
To execute this calculation, an investor must pre-determine three distinct price coordinates on a chart before any capital is deployed. The first is the entry price, which is the exact price at which the asset is purchased for a long position, or sold short for a bearish position. 29 The second is the stop-loss price, representing the predetermined exit point where the trade idea is technically invalidated and the maximum acceptable loss is realized. 910 The third is the take-profit, or target price, which is the anticipated exit point where the asset will be sold to realize a gain, typically based on historical technical resistance or fundamental valuation models. 910
The formal mathematical formula is expressed simply as the quotient of the potential loss over the potential gain. For a standard long position, where an investor buys an asset with the expectation that its price will rise, the variables are defined distinctly. The total risk is the difference between the entry price and the stop-loss price. The total reward is the difference between the take-profit price and the entry price. 91112
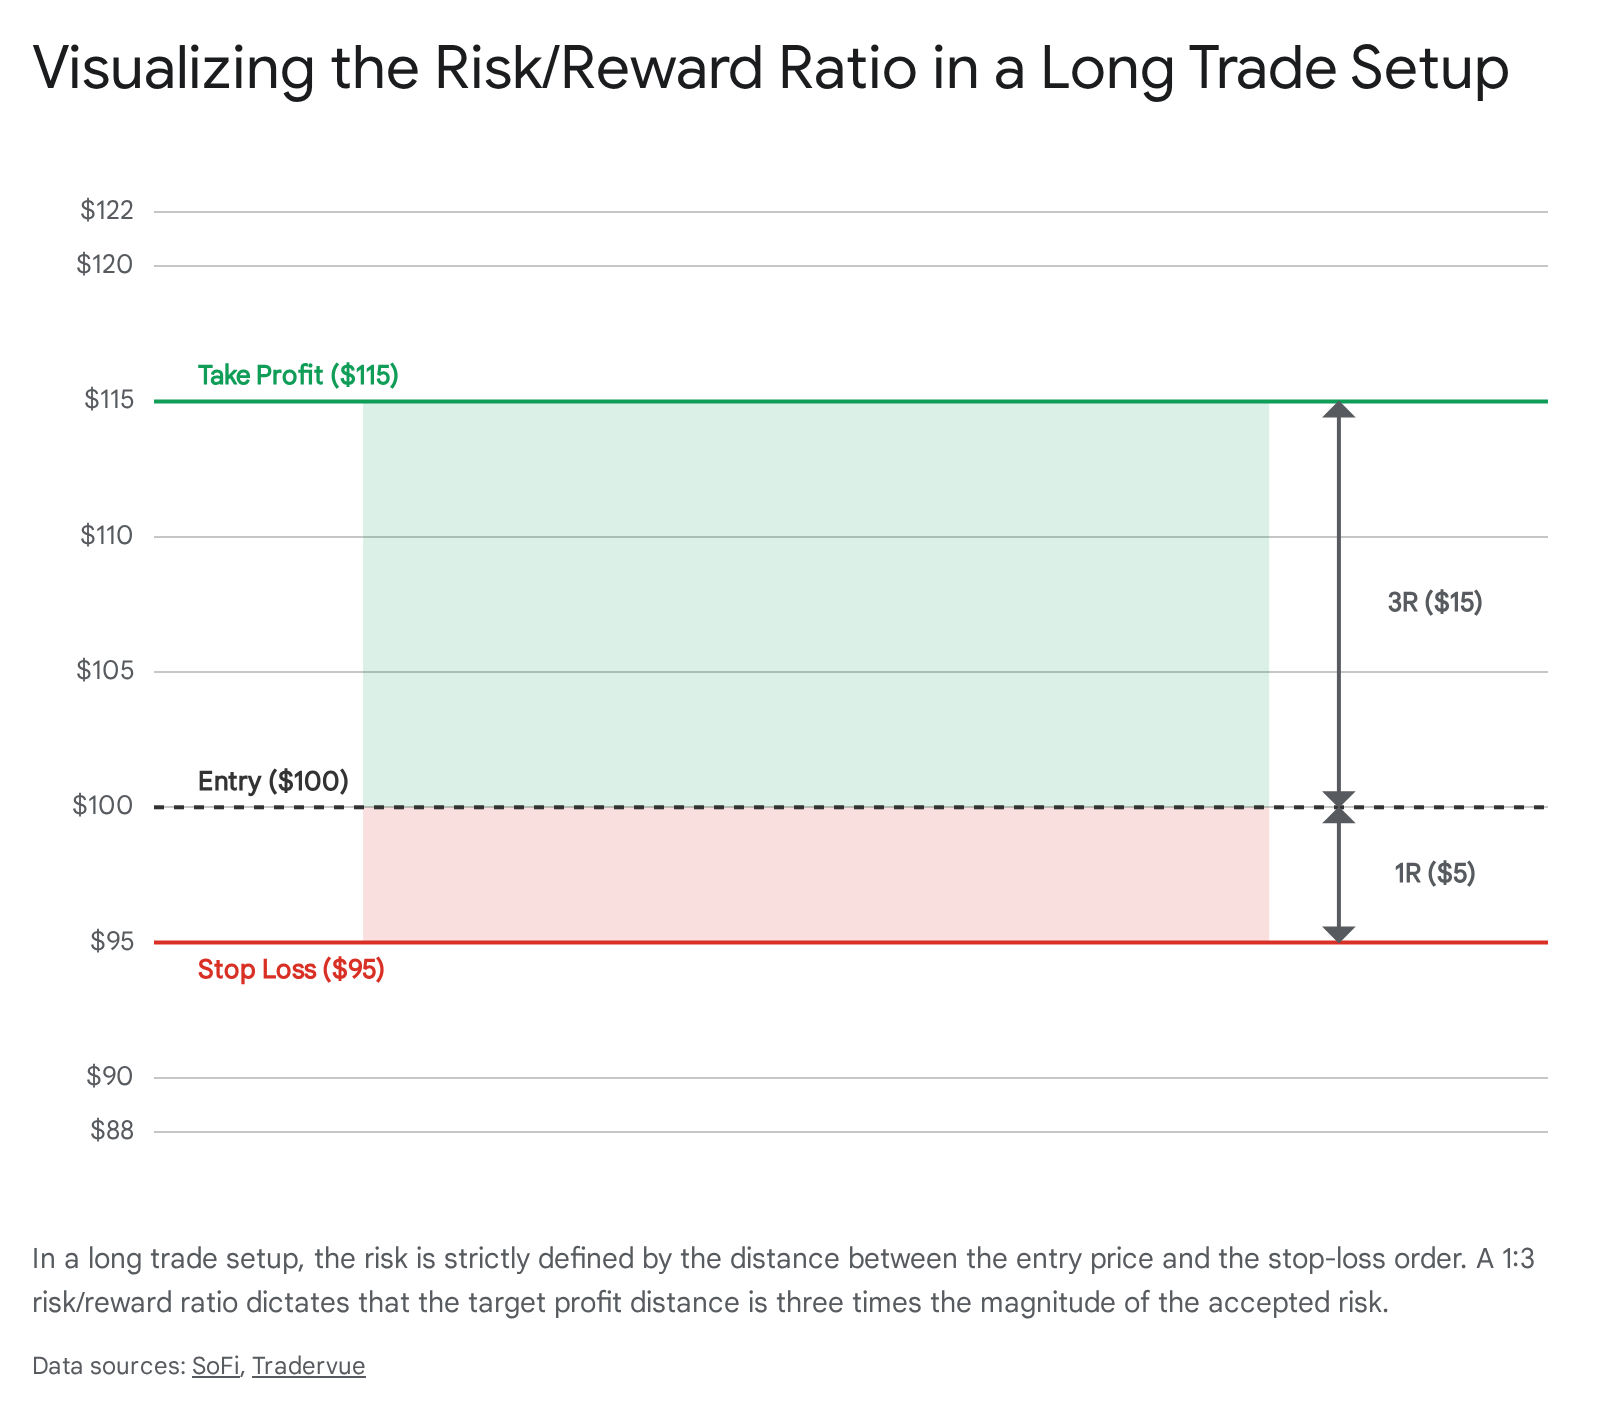
Consider a practical example of equity investment. Assume an investor wishes to purchase shares of a technology company. Through technical analysis of support and resistance levels, the investor decides to enter the market at exactly $100 per share. To protect against sudden downside volatility, a stop-loss order is placed at $95. Simultaneously, based on historical resistance patterns and average true range, a take-profit target is set at $115. 1113
In this scenario, the risk is $5 per share, calculated by subtracting the $95 stop-loss from the $100 entry price. The potential reward is $15 per share, calculated by subtracting the $100 entry from the $115 target. By dividing the $5 risk by the $15 reward, the resulting risk/reward ratio is 1:3. 1113 The investor is explicitly risking one unit of capital to potentially gain three units. If the investor buys 100 shares, scaling the trade up, the total monetary risk becomes $500, and the total potential reward scales to $1,500. 11
The visual description of a trade setup provides an immediate spatial understanding of market risk. When viewing a stock chart, the current execution price represents a point of equilibrium. The physical distance downwards to the stop-loss represents the defined risk zone, while the distance upwards to the target represents the reward zone. In a highly optimized trade, the reward zone spans a significantly larger visual area on the chart than the risk zone, instantly communicating positive expectancy. 1415
To refine these spatial zones, professional traders utilize metrics like Maximum Adverse Excursion (MAE) and the Average True Range (ATR). The ATR measures historical market volatility, ensuring a stop-loss is placed outside the boundaries of normal, everyday price fluctuations, thus preventing the trade from being prematurely stopped out by standard market noise. 7816 Maximum Adverse Excursion tracks the statistically determined worst-case historical loss during a specific holding period, allowing a trader to backtest whether their chosen stop-loss would have survived past price action. 16 Furthermore, these price coordinates must be integrated into proper position sizing. Industry best practice dictates that the total monetary risk represented by the distance to the stop-loss should never exceed 1% to 2% of the trader's total account equity, ensuring that even a prolonged streak of losses will not result in catastrophic capital ruin. 1618
How Does the Win Rate Interact With the Risk/Reward Ratio?
A pervasive and damaging misconception among retail investors is that a high win rate - the percentage of trades that close profitably - is the sole determinant of a successful trading strategy. 1920 However, a high win rate is mathematically irrelevant and potentially deceptive without the anchoring context of the risk/reward ratio. It is entirely possible to win 80% of trades and still rapidly deplete an account if the financial losses sustained on the remaining 20% are disproportionately large. 2021
The true, objective metric of trading success is Expectancy, sometimes referred to as Expected Value. Expectancy calculates the average monetary amount a trader can expect to win or lose per individual trade over an extended period, aggregating both the probability of winning and the size of the payouts. 2223 The formula for trade expectancy multiplies the win rate by the average win size, and subtracts the product of the loss rate multiplied by the average loss size. 2223
If an investor boasts a 70% win rate but utilizes an inverted 1:0.5 risk/reward ratio, where they routinely risk $200 to capture small $100 gains, the expectancy calculation reveals a mathematically deteriorating portfolio. Over the course of ten trades, the seven winning trades generate $700 in profit. However, the three losing trades generate $600 in losses. The net profit is a meager $100. Once platform commissions, slippage, bid-ask spreads, and taxes are factored in, this supposedly high-win-rate strategy is functionally generating a negative return. 192021
Conversely, implementing an asymmetrical risk/reward ratio allows an investor to be wrong the majority of the time and still remain highly profitable. A trader employing a strict 1:3 risk/reward ratio mathematically only needs to be correct on 25% to 26% of their trades to break even. 192425 If a trader risks $100 to make $300 and wins only three out of ten trades, the three wins generate $900 in profit. The seven consecutive losses generate only $700 in aggregate loss, resulting in a net profit of $200 despite a dismal 30% win rate. 14
This mathematical reality is counterintuitive to human psychology, which naturally craves the validation of frequent wins. However, probability dictates extreme streakiness. Even with a humble 55% win rate, a trader will statistically encounter streaks of five or more consecutive losses multiple times a year. 26 Without a robust risk/reward ratio to absorb these inevitable losing streaks, the trader will mistakenly abandon a strategy that actually possesses a positive mathematical edge. 26
To conceptualize the critical relationship between risk and reward, financial analysts utilize a breakeven matrix. This matrix outlines the absolute minimum win rate required to prevent capital erosion across various risk/reward setups, demonstrating how shifting the ratio dramatically alters the required accuracy of the trader. 9192125
| Risk/Reward Ratio | Capital at Risk | Target Reward | Minimum Required Win Rate to Break Even | Trade Quality Assessment |
|---|---|---|---|---|
| 2:1 | $200 | $100 | 66.6% | Extremely high risk; requires exceptional directional accuracy; highly vulnerable to minor volatility and streakiness. 2127 |
| 1:1 | $100 | $100 | 50.0% | Equivalent to a coin flip or basic casino odds; requires greater than 50% win rate simply to overcome transactional fees. 212428 |
| 1:1.5 | $100 | $150 | 40.0% | Acceptable parameters for short-term scalping or high-frequency mean reversion strategies. 1114 |
| 1:2 | $100 | $200 | 33.3% | The widely accepted industry standard minimum for beginner retail investors and swing traders. 92125 |
| 1:3 | $100 | $300 | 25.0% | Highly favorable asymmetry; allows for long losing streaks while maintaining strong positive mathematical expectancy. 192425 |
| 1:5 | $100 | $500 | 16.6% | Exceptional asymmetry; typical of long-term trend following strategies, though generally paired with overall lower win rates. 15 |
As the matrix illustrates, an investor adhering to a baseline 1:2 ratio can afford to be wrong on up to 60% of their market entries and still generate positive net profits over time. 19 This immutable mathematical reality underscores precisely why rigorous risk management, rather than attempting the impossible task of perfect market prediction, is the primary focus of successful institutional trading desks. 128
Is There a Universal Ideal Risk/Reward Ratio?
While the breakeven matrix makes higher ratios appear intrinsically and universally superior, a pervasive misconception in retail education is that an "ideal" ratio exists for all market participants. Many entry-level trading guides tout a 1:3 ratio as a mandatory, inflexible threshold. However, rigid adherence to a 1:3 rule can be severely counterproductive if it does not align organically with the underlying market structure and the specific trading strategy being deployed. 1428
Setting arbitrary price targets simply to fulfill the mathematical requirement of a 1:3 ratio, without any regard for technical resistance levels, moving averages, or historical volatility, often results in the target never being reached. 212829 If an asset realistically possesses only a 5% upside based on historical price channels and heavy resistance, placing a target at 15% simply to mathematically justify a 5% stop-loss ensures a near-zero probability of success. 2128 The risk/reward ratio dictates the structural quality of the trade setup, but it absolutely does not dictate the fundamental probability of the asset ever reaching that target price. 1130 A massive potential reward is useless if the market physics prohibit the asset from traveling that far.
Behavioral finance and market microstructure research indicate that the optimal ratio is entirely dependent on the prevailing market regime. Trend following strategies, which are designed to capture massive, prolonged directional moves over months or years, typically exhibit very low win rates, often hovering between 30% to 40%. Because they experience frequent small losses due to market whipsaws, they absolutely require highly asymmetrical risk/reward ratios, such as 1:3, 1:5, or higher, to offset the sheer volume of losing trades and remain profitable. 2631 Conversely, mean reversion and scalping strategies aim to capture small, highly predictable price oscillations within a confined trading range. These strategies typically yield very high win rates, often 60% to 80%. Because these setups execute quickly and rely on high statistical probability rather than massive distance, they can successfully and profitably operate on much tighter ratios, such as 1:1 or 1:1.5. 142131
Furthermore, broader market conditions are rarely static. Comprehensive studies evaluating major equity indices from 1990 to 2023 reveal distinct "regime non-stationarity." Markets cycle unpredictably between trending regimes and mean-reverting, range-bound regimes. 314 A trading system rigidly optimized with a strict 1:3 ratio may perform exceptionally well in a strong, trending bull market but fail catastrophically during a low-volatility, mean-reverting regime, where distant price targets are never met and stop-losses are continually triggered by sideways chop. 314 Therefore, professional traders must adjust their risk/reward parameters dynamically based on current market volatility, employing regime detection algorithms to shift between trend and mean-reversion tactics as the underlying asset class characteristics evolve. 9314
What Practical Tools Enforce Risk and Reward Execution?
Calculating a theoretical risk/reward ratio in a spreadsheet is a purely cognitive exercise; enforcing that ratio in a live, highly volatile market requires precise mechanical tools. The SEC's Office of Investor Education and Advocacy emphasizes the critical importance of utilizing specific automated order types to manage risk and execute trades without hesitation. 56 Without these mechanical tools, human emotion - specifically loss aversion and the fear of missing out - inevitably overrides mathematical logic, prompting traders to hold losing positions hoping they recover, or to cash out winning positions prematurely out of fear. 317
A stop-loss order is the most essential risk management instruction an investor can utilize. It is a directive given to a broker to automatically close a position once the asset reaches a specific, predetermined adverse price level. 5837 It acts as the ultimate circuit breaker, mechanically removing human emotion from the painful act of accepting a financial loss. 938
However, investors must carefully distinguish between different technical variations of stop orders, as they carry vastly different execution risks. A basic Stop-Market Order is designed to guarantee an exit. When the asset touches the designated stop price, the order instantly converts into a "market order," instructing the broker to sell the asset immediately at the very best available current price. 5379 While this guarantees execution, it fundamentally does not guarantee the final sale price. 537 In fast-moving, highly volatile markets, or during a sudden liquidity vacuum known as a flash crash, severe price slippage can occur. An order triggered at $50 might ultimately fill at $45 if all buyers vanish, meaning the actual monetary risk realized was far greater than the theoretical risk calculated in the ratio. 54041
To explicitly counter the severe risk of slippage, traders utilize a Stop-Limit Order, which combines two distinct mechanisms. It requires the investor to set a stop price to trigger the event, and a subsequent limit price which sets the absolute minimum acceptable sale price. 54142 For example, if an investor sets a stop price of $50 and a limit price of $49, the order activates when the market hits $50, but it will only execute if the stock can be sold for $49 or higher. 942 While this provides strict, unwavering price control, it completely removes the guarantee of execution. If the stock price gaps violently downward past the $49 limit, the order is bypassed entirely and remains unfilled, leaving the investor holding a rapidly plummeting asset. 5374143
For ultimate protection, some brokers in specific markets offer a Guaranteed Stop-Loss. This ensures the position is closed exactly at the specified price, regardless of market gapping or extreme slippage. Because the broker assumes the underlying market risk of the gap, they charge a premium cash fee if the guaranteed stop is triggered, treating the risk transfer much like an insurance premium. 40 Finally, a Trailing Stop is a dynamic variation designed to lock in acquired profits while maintaining downside protection. Instead of a fixed, static price, the stop is set at a specific percentage or dollar amount below the current market price. As the asset's price rises, the trailing stop automatically rises with it, securing gains. If the asset reverses and falls by the specified trailing amount, the stop is immediately triggered. 164144
To enforce the reward half of the mathematical ratio, investors utilize take-profit limit orders. A limit order is an instruction to buy or sell a security at a strictly specified price or better. 640 For a long position, a sell-limit order is placed above the current market price at the exact target determined during the initial risk/reward calculation. 9 Unlike stop-market orders, limit orders absolutely guarantee the execution price, but they do not guarantee execution itself. The asset must reach the limit price, and there must be sufficient market liquidity and buyers at that exact price to completely fill the order. 643 Using limit orders securely automates the profit-taking process, actively preventing the common psychological error of holding onto a winning position too long out of greed, only to watch the profits evaporate as the market reverses into a loss. 4045
How Do Modern Trading Apps Obscure Risk/Reward Metrics? (2023+ Context)
The proliferation of zero-commission mobile trading platforms has rapidly democratized access to financial markets, bringing millions of new retail participants into the ecosystem. However, extensive behavioral finance research conducted in 2023 and 2024 by international regulatory bodies, including the UK's Financial Conduct Authority (FCA) and the Ontario Securities Commission (OSC), reveals a troubling reality: the interface design of these applications often actively undermines rational risk/reward calculations. 101112
Regulators have identified the widespread, intentional use of "Digital Engagement Practices" (DEPs) - commonly referred to as gamification techniques. DEPs encompass UI features such as frequent push notifications detailing urgent market news, aggressively flashing price tickers, points-and-prize draws, integrated social feeds, and public performance leaderboards. 101113 These features are heavily engineered to maximize daily user engagement, but empirical data shows they systematically corrupt positive-expectancy trading strategies by overwhelming analytical thought with emotional stimulus. 12131415
A landmark 2024 FCA online experiment involving over 9,000 consumers decisively demonstrated that exposure to DEPs directly caused a significant increase in both trading frequency and the overall riskiness of the trades selected by users. 101352 The detrimental effects were particularly pronounced among younger, male, and less experienced investors who possessed lower baseline financial literacy. 135253 Similarly, a 2024 study conducted by the OSC and the Behavioural Insights Team (BIT) found that simply exposing retail investors to a "top-traded" leaderboard increased their likelihood of buying and selling those specific, highly volatile stocks by 14%, clearly demonstrating herd behavior and automation bias driven by the interface rather than underlying fundamentals. 11131516
From a strict risk/reward perspective, gamified environments decouple the investor from the mathematics of probability. Behavioral finance research identifies several specific ways DEPs induce negative-expectancy overrides that destroy capital over time: 31
First, these platforms actively obscure the expectancy math. By emphasizing social validation through "copy trading" functionalities and gamified rewards like digital confetti, platforms shift the investor's focus away from cold risk/reward calculation toward emotional stimulus and fear of missing out (FOMO). 111317 A rigorous 2025 multi-exchange study analyzing 100,236 copy trading outcomes revealed that while major platforms advertised enticingly high win rates (e.g., Binance at 66.5% and MEXC at 57.79%), the aggregate followers engaging in the copy trading actually lost significant money, showing an aggregate follower loss of -210,040 USDT on one platform. The average losses absorbed by the retail followers vastly exceeded the average wins, creating a negative mathematical expectancy that was entirely masked by the platform's deceptive focus on the raw win rate rather than the risk/reward skew. 56
Second, the design induces severe overtrading and impulsivity. Instant mobile access and continuous push notifications exacerbate "information overload," prompting impulsive, rapid-fire decisions that bypass strategic planning. 17 This highly emotional state leads to disastrous manual overrides, such as widening a stop-loss mid-trade because the user cannot accept being wrong, thereby converting a contained, mathematically sound 1R loss into a catastrophic, account-damaging 3R loss. 31 As noted in algorithmic system architecture theory, applying negative-expectancy emotional overrides to an otherwise positive-expectancy system systematically destroys the portfolio's mathematical edge. 31
Finally, academic studies utilizing latent class analysis have drawn strong, concerning correlations between the design of certain high-risk trading apps - particularly those offering Contracts for Difference (CFDs) and binary options - and disordered gambling behaviors measured by tools like the South Oaks Gambling Screen (SOGS). 1214 By framing financial speculation as an interactive game rather than a rigorous risk-management business, the apps encourage highly destructive trading styles characterized by dangerously short holding periods coupled with massive, inadequate capital sizing. Tellingly, regulatory mandates require CFD providers to post disclaimers, which reveal that a staggering 74% to 89% of retail accounts consistently lose money trading these leveraged products. 1257 In response to these findings, regulatory bodies like the FCA have formally warned firms that the new Consumer Duty framework requires trading apps to enable effective, properly informed investment decisions, placing the burden squarely on brokers to ensure their UI designs do not actively impair retail risk management. 105253
How Does Risk/Reward Differ Across Asset Classes?
The core mathematical principles of risk and reward are universally applicable, but their practical, day-to-day application varies drastically depending on the specific asset class being traded. Inherent liquidity, historical volatility, and official market hours dictate exactly how wide stop-losses must be placed and how aggressively target limits can be set. 1114
Equities (Stocks)
In the traditional equities market, risk/reward setups must actively account for the severe danger of execution gaps. Because the major stock markets close overnight, significant fundamental news events - such as unexpected earnings reports, macroeconomic data releases, or geopolitical shocks - can easily cause a stock to open the next morning at a price vastly different from its previous close. 3841 If an investor holds a stock at $100 with a strict stop-loss order placed at $95, and the company surprisingly announces bankruptcy overnight, the stock may open for trading the next day at $60. The stop-loss is immediately converted to a market order and fills at $60, meaning the actual risk realized by the investor was 800% larger than the planned risk calculated in their ratio. 3841
To mitigate this uncontrollable overnight risk, active equity traders often restrict their exposure by closing all open positions before the market closes, engaging in day trading, or strictly avoiding holding assets through highly volatile scheduled earnings calls. Furthermore, equity investors must account for routine corporate actions, such as dividend payouts and stock splits, which artificially alter the stock price and can accidentally trigger stop orders if the trader's software platform does not automatically adjust for these events. 3841 Over the very long term, equities have historically offered a higher risk premium - roughly 6.6% compared to 4.4% for 10-year U.S. Treasury bonds - rewarding long-term buy-and-hold investors for enduring this volatility, but short-term traders must navigate these gaps meticulously. 1859
Cryptocurrencies
The cryptocurrency market presents a radically different environment because it operates continuously, 24 hours a day, 7 days a week, completely eliminating the overnight gapping risk inherent in traditional equities. However, this advantage is heavily offset by the asset class's extreme, inherent price volatility. 4 Cryptocurrencies, driven heavily by retail sentiment and algorithmic trading, can easily experience 10% to 20% price swings within a single, brief intraday session. 4
If a cryptocurrency trader attempts to use the tight, 1% or 2% stop-losses typical of forex or large-cap equities, they will be violently "stopped out" by normal, everyday market noise long before the trade has a chance to develop in their favor. 84 Therefore, crypto trading requires significantly wider stop-losses. To maintain a mathematically favorable 1:2 or 1:3 risk/reward ratio while accommodating a wide stop-loss, the target profit must be set exponentially higher. This means crypto swing trades often require capturing massive, multi-week cyclical trends rather than small intraday scalps. 4 Research into optimization algorithms for cryptocurrency trading further reveals that the topology of parameters is highly unstable; algorithms like the Tree-structured Parzen Estimator (TPE) often outperform traditional evolutionary algorithms because the parameters required for survival must adapt to rapid, extreme regime non-stationarity unique to digital assets. 4
Options Trading
Options trading introduces complex, non-linear risk/reward dynamics that differ entirely from holding the underlying asset. Unlike buying a stock where the downside risk is determined by the distance to a stop-loss, options strategies allow for strictly defined, absolute risk mathematically built into the purchase of the contract itself. 19 Advanced multi-leg options strategies are specifically engineered to manipulate the risk/reward ratio to fit a highly specific market thesis regarding volatility and time decay.
A Long Butterfly Spread, for example, is a strategy that combines buying and selling multiple call or put options at equidistant strike prices. It is specifically designed to profit from neutral price action and low volatility. The maximum risk is strictly limited to the upfront net cost (the debit) paid to enter the trade, including commissions. The maximum profit is achieved only if the underlying stock pins exactly at the center strike price on the precise day of expiration. The risk/reward ratio in this setup can be highly favorable, potentially risking $1.25 to make $3.75, but the probability of the stock landing exactly at the required price is statistically low, requiring precise execution and acceptance of small dollar-value returns heavily impacted by commission drag. 2021
Conversely, a Short Iron Butterfly Spread aims to capture premium by selling options, profiting when the stock remains within a neutral boundary. The maximum profit is strictly limited to the upfront credit received from the buyer, while the maximum risk - realized if the stock moves violently in either direction beyond the protective strikes - is defined by the distance between the strikes minus the initial credit received. In this scenario, the win rate is mathematically much higher because the stock can land anywhere within a broad range, but the risk/reward ratio is often inverted, potentially risking $3 to make just $1. This inverted ratio demands rigorous, emotionless discipline to cut losses early if the stock unexpectedly begins to trend, as a single maximum loss can wipe out the profits from multiple previous winning trades. 1922
Bottom Line
The risk/reward ratio is not a magical predictive trading strategy; it is a fundamental, defensive capital preservation tool. It objectively quantifies the geometric relationship between accepted maximum loss and anticipated future gain, forcing investors to pre-define their financial exposure before engaging with the inherent unpredictability of the financial markets. 1314
While novice retail investors often obsess over the illusion of finding a trading strategy with a flawless, impossibly high win rate, institutional finance relies squarely on the mathematics of expectancy and portfolio survival. 192026 By adhering to a consistently asymmetrical risk/reward ratio - such as 1:2 or 1:3 - investors ensure that their inevitable, routine losses are kept small and manageable, while their victories scale efficiently enough to more than offset those losses over the long term. 1921
However, the efficacy of this mathematical ratio relies entirely on disciplined, robotic execution. The theoretical math breaks down immediately if stop-loss and limit orders are not utilized to mechanically enforce the parameters in the live market. 3840 Furthermore, as highlighted by recent, extensive regulatory research into the gamification of zero-commission trading apps, the modern digital landscape is actively designed to bypass cognitive risk assessment. These platforms utilize intense social pressure, flashing interfaces, and gamified dopamine loops to encourage impulsive, negative-expectancy behavior that enriches the broker at the expense of the user. 101213 To survive and achieve consistent profitability in long-term trading, investors must meticulously marry the mathematical discipline of the risk/reward ratio with a profound awareness of their own behavioral biases, while adapting their parameters to the unique structural mechanics of the specific asset classes they trade.