Relative Importance of Position Sizing and Trade Selection
The architecture of investment returns rests on two distinct but deeply intertwined pillars: trade selection and position sizing. Trade selection, often referred to as security selection or the generation of alpha signals, is the process of identifying market inefficiencies, mispricings, or trends that yield a mathematical edge. Position sizing, conversely, is the portfolio construction mechanism that dictates how much capital is allocated to each identified opportunity. While vast institutional resources are dedicated to discovering alpha through alternative data and complex forecasting models, quantitative evidence increasingly demonstrates that the translation of a theoretical edge into realized, compounded wealth is overwhelmingly determined by position sizing methodologies.
This analysis examines the mathematical, empirical, and institutional dimensions of position sizing relative to trade selection. By dissecting the mechanics of expectancy, the mathematics of the Kelly Criterion, the existential threat of risk of ruin, the integration of machine learning in dynamic allocation, and the empirical outcomes of systematic portfolio management, the research provides a comprehensive framework for understanding how capital allocation limits or amplifies predictive accuracy.
The Mathematics of Trade Selection
In professional portfolio management, the distinction between picking the right trades and sizing them correctly is often likened to the difference between batting average and slugging percentage 12. Trade selection dictates the frequency of correct market predictions, while position sizing dictates the magnitude of capital growth derived from those predictions. The interplay between these two forces defines a strategy's ultimate viability.
Expectancy and the Fundamental Edge
The fundamental prerequisite for any investment strategy is a positive mathematical edge, expressed through positive expectancy. Trade selection systems - whether driven by fundamental valuation, macroeconomic forecasting, or quantitative statistical arbitrage - seek to identify conditions where the probability of a gain multiplied by the magnitude of that gain exceeds the probability of a loss multiplied by the magnitude of that loss.
Expectancy is formalized by the equation calculating the win rate multiplied by the average win, minus the loss rate multiplied by the average loss 3. Without a positive expectancy, no position sizing algorithm can generate long-term profits. A strategy with a negative mathematical edge will eventually result in the total depletion of capital, a mathematical certainty that position sizing can only delay, not prevent 34. Therefore, trade selection acts as the necessary admission ticket to capital compounding. Elite hedge funds invest heavily in data acquisition, alternative data pipelines, and machine learning infrastructure precisely to secure this foundational edge, aiming for elevated Information Ratios (IR) and Information Coefficients (IC) 16.
The relationship between the Information Coefficient (the correlation between predictions and actual returns) and the Information Ratio (risk-adjusted excess return) demonstrates the value of trade selection at scale. Utilizing the Fundamental Law of Active Management, the Information Ratio is equal to the Information Coefficient multiplied by the square root of breadth (the number of independent bets) 1. A casino roulette wheel offers a statistical edge of approximately 2.7% (an IC of 0.027) on a red/black bet 1. On a single spin, the variance is massive, but across one million spins, the Information Ratio expands to over 27.0, illustrating that a small trade selection edge becomes statistically insurmountable when applied across a sufficiently large opportunity set 1.
Win Rate Variations and Payoff Asymmetry
A common fallacy in retail and discretionary portfolio management is an overreliance on the win rate as the primary metric of trade selection quality 7. Empirical research into market microstructure and stop-loss design indicates that win rates are highly malleable and inversely correlated with payoff asymmetry 78.
Strategies engineered for high win rates frequently achieve these outcomes by truncating the right tail of the return distribution. This is accomplished by taking profits prematurely while allowing losses to widen or by utilizing exceptionally wide stop-loss parameters 8. Mean-reversion and market-making strategies typically operate in this high-win-rate, low-payoff regime 3. Conversely, classic trend-following strategies generally operate with low win rates (often between 35% and 45%) but feature extreme positive payoff asymmetry, achieving superior long-term expectancy despite frequent individual trade failures 3.
The breakeven win rate for any strategy is mathematically defined by its reward-to-risk (payoff) ratio, demonstrating that raw accuracy is meaningless without the context of payout magnitude.
| Reward-to-Risk Ratio | Required Breakeven Win Rate | Implied Strategy Style |
|---|---|---|
| 0.5 : 1 | 66.7% | Extreme Mean Reversion / Scalping |
| 1.0 : 1 | 50.0% | Standard Equity / Coin Flip Dynamics |
| 1.5 : 1 | 40.0% | Swing Trading / Fundamental L/S |
| 2.0 : 1 | 33.3% | Advanced Swing / Macro |
| 3.0 : 1 | 25.0% | Trend Following / Tail Hedging |
| 5.0 : 1 | 16.7% | Convex Trend / Option Long Volatility |
As long as the trade selection protocol produces an edge that clears the breakeven threshold, the raw win rate becomes subordinate to the capital allocation strategy 8. Tight stop-loss rules, while often viewed as disciplined risk management, can systematically harm investor outcomes by artificially depressing the win rate without providing a commensurate increase in the payoff ratio, thereby truncating exposure to favorable return distributions at the portfolio level 7.
Alpha Decay and Signal Quality
The reliance on trade selection is further complicated by the phenomenon of alpha decay. Financial markets are highly adaptive, and the predictive power of a specific trading signal diminishes as information is absorbed by market participants and acted upon by competing algorithms. Research modeling the effect of alpha decay and transaction costs on multi-period optimal trading strategies confirms that the present value of a signal is insufficient for sizing; the speed at which the signal's effectiveness wanes must be explicitly modeled 9.
Furthermore, signals published in academic literature or popularized by broad market adoption experience severe out-of-sample degradation. Studies estimate that portfolio returns are up to 26% lower out-of-sample and 58% lower post-publication due to publication-informed trading and data mining effects 9. This transient nature of predictive edge underscores why elite systematic funds prioritize robust, dynamic position sizing engines capable of modulating capital allocation in real-time as signal quality inevitably degrades 910.
The Mechanics of Portfolio Survival
Before capital can compound, it must survive. The most profound disconnect between theoretical trade selection models and applied portfolio management is the underestimation of path dependency. An algorithm that proves highly profitable over a ten-year backtest holds no utility if it forces the portfolio into liquidation during year two.
Risk of Ruin Formulations
Risk of ruin answers an existential question in quantitative finance: regardless of a strategy's positive expectancy, what is the mathematical probability that an adverse sequence of returns will destroy the portfolio before the edge can be realized? 31112.
For a strategy with equal-sized wins and losses (a symmetric 1:1 payoff ratio), the calculation relies on the win rate and the number of risk units the capital base holds (Total Capital divided by the Capital Risked per Trade) 312. As the capital allocated per trade increases, the number of risk units decreases, and the probability of ruin rises exponentially, rather than linearly 13. This nonlinear relationship constitutes mathematical proof that even the most accurate trade selection mechanism can be destroyed by aggressive position sizing.
The interplay between win rate, payoff ratio, and risk percentage creates rigid boundaries for survival. Data visualizing these probabilities indicates that catastrophic portfolio ruin is highly sensitive to nominal increases in allocation. For instance, holding a constant 2:1 payoff ratio, a strategy possessing a positive expectancy (such as a 40% win rate) faces a negligible 2.0% risk of ruin when sizing at 5% per trade, but a highly dangerous 14.2% risk of ruin when sizing at 10% per trade.
| Win Rate | Payoff Ratio | Capital Risked per Trade | Probability of Total Portfolio Ruin |
|---|---|---|---|
| 40.0% | 2.0 | 5% | 2.0% |
| 40.0% | 2.0 | 10% | 14.2% |
| 45.0% | 1.5 | 5% | 3.6% |
| 45.0% | 1.5 | 10% | 19.2% |
| 50.0% | 1.5 | 5% | 0.1% |
| 50.0% | 1.5 | 10% | 3.7% |
The data confirms that manipulating the position size acts as the primary lever for altering the existential risk profile of the portfolio. Professional traders typically aim for a risk of ruin well below 1.0%, effectively eliminating the possibility of account destruction by capping per-trade risk at 1% to 2% 31112.
Sequence of Returns and Drawdown Recovery
Traders routinely underestimate the risk of ruin because human cognition tends to rely on average outcomes rather than worst-case path dependencies 3. A portfolio with a 55% win rate will, by mathematical definition, experience losing trades 45% of the time. Over a sufficient sample size of thousands of transactions, losing streaks of seven to ten consecutive trades are a statistical certainty 3.
The critical variable during these inevitable sequences is the drawdown percentage, which introduces severe asymmetry into portfolio recovery. If a manager risks 10% of portfolio equity per position, a highly probable seven-trade losing streak results in a drawdown exceeding 50%. Due to the multiplicative nature of compounding, a 50% drawdown requires a 100% subsequent gain merely to restore the original equity high 1314. Conversely, restricting risk to 2% per trade limits the exact same sequence to a highly recoverable 13% drawdown 3. In institutional practice, this path dependency means that any position sizing framework that permits mathematically unrecoverable drawdowns functionally nullifies the underlying alpha model.
The Arithmetic Versus Geometric Return Gap
The fundamental discrepancy separating trade selection research from optimal position sizing is the difference between arithmetic means and geometric compounding. Trade selection research typically evaluates efficacy by optimizing for arithmetic expected returns across a dataset 14. However, investment capital does not compound arithmetically; it compounds geometrically, subjecting the portfolio to volatility drag (frequently termed the volatility tax) .
If a strategy produces an arithmetic average gain of 5% per trade through highly volatile swings (e.g., gains of 33% and 29% offset by losses of 24% and 19%), the multiplicative compounding of those specific return paths may actually yield a negative geometric return, resulting in a net loss of capital . Because the geometric return is approximately equal to the arithmetic return minus half the variance, the primary function of position sizing is to moderate the variance penalty, ensuring that a theoretical arithmetic edge successfully translates into long-term geometric wealth creation 14.
Capital Allocation via the Kelly Criterion
The theoretical ceiling for maximizing geometric compounding through position sizing is governed by the Kelly Criterion, originally formulated by John Kelly at Bell Labs in 1956 1416. Drawing upon information theory, the Kelly Criterion represents the mathematically optimal fraction of a capital base to allocate to a series of bets to maximize the asymptotic rate of logarithmic wealth growth 141617.
Formulating the Kelly Fraction
For discrete, binary outcomes with known probabilities, the Kelly formula calculates the optimal fraction of the portfolio to wager by subtracting the ratio of the loss probability to the payoff ratio from the win probability 312. However, in modern quantitative finance handling continuous return distributions, the univariate Kelly fraction is approximated by the ratio of expected excess return to the variance of returns 1416.
In a multi-asset portfolio, the Kelly criterion generalizes into a matrix formulation where the vector of optimal portfolio weights is equal to the inverse of the return covariance matrix multiplied by the vector of expected returns 18. This multi-asset formulation highlights a profound structural insight frequently overlooked in financial literature: the optimal position sizing vector is mathematically identical to the Ordinary Least Squares (OLS) estimator 18. When historical returns encode factor exposures, the inverse covariance matrix and the OLS design matrix are structurally identical computations 18. Consequently, the covariance matrix dictates not merely the absolute sizing of a position, but the fundamental trade-off between signal quality, portfolio diversification, execution feasibility, and systemic risk .
Asymptotic Properties and the Overbetting Hazard
The Kelly Criterion guarantees that, in the limit of infinite trades, an investor sizing positions precisely at the Kelly optimal fraction will achieve greater terminal wealth than an investor using any other alternative sizing protocol, while minimizing the asymptotic expected time to reach specific wealth targets 1417. However, the framework possesses a lethal operational vulnerability: it assumes perfect foresight regarding the input parameters and is exquisitely sensitive to estimation error 32.
If a portfolio manager overestimates their theoretical edge or underestimates the true volatility of the asset, the mathematical output will prescribe a position size strictly greater than the true optimal Kelly fraction. Betting beyond the true Kelly fraction actively degrades the geometric growth rate while exponentially increasing portfolio variance. If position sizing reaches exactly twice the Kelly fraction, the geometric growth rate drops to zero. Any sizing protocol that exceeds twice the Kelly fraction guarantees ultimate portfolio ruin with a probability approaching one, even if the underlying trade selection possesses a massive positive expectancy 142.
Institutional Modifications to Optimal Sizing
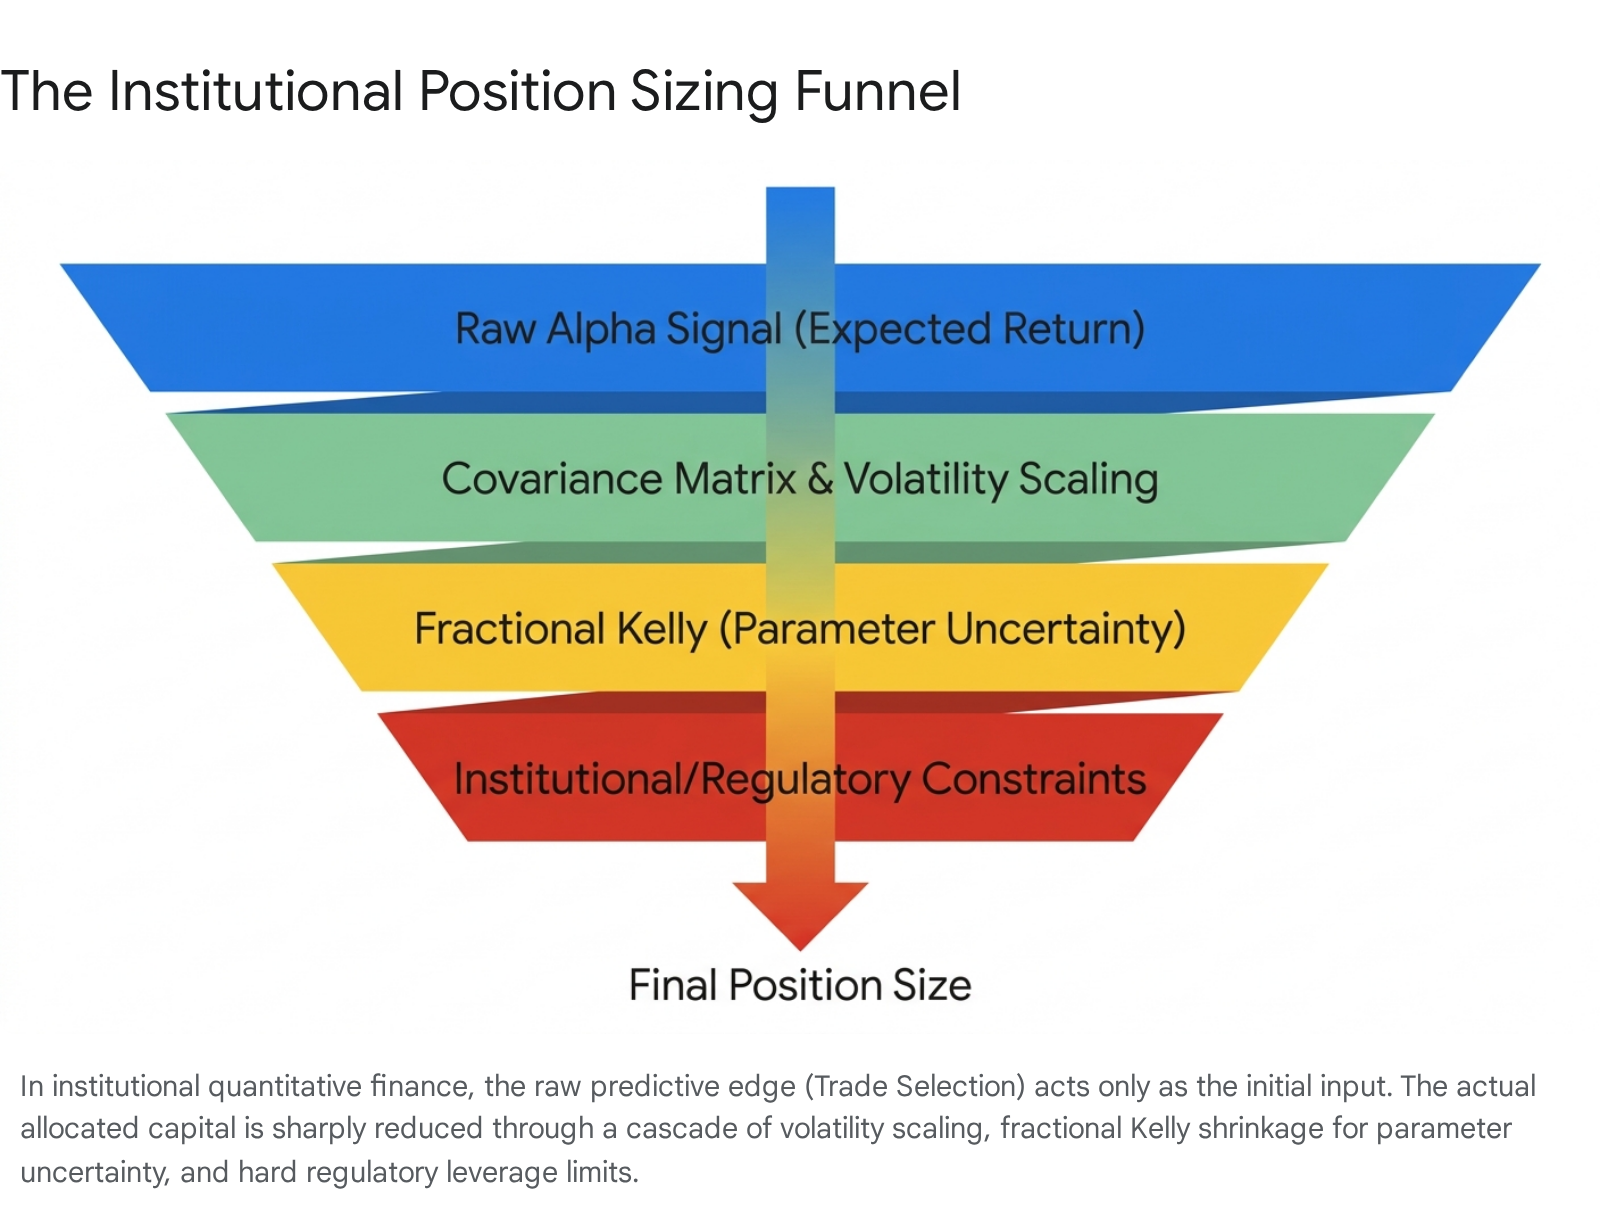
Because accurate ex-ante estimation of expected returns and covariance matrices is notoriously difficult - and because financial time series exhibit fat tails, non-stationarity, and rapid regime shifts - no sophisticated institutional asset manager trades at "Full Kelly" 31418. The institutional response is the "Fractional Kelly" framework, which blends the mathematically optimal Kelly output with cash buffers to construct a portfolio that trades off absolute maximum theoretical growth for vastly improved security and strictly regulated drawdowns 172.
Parameter Uncertainty and Fractional Kelly
The application of the Kelly Criterion in active equity portfolios, particularly concentrated strategies managing unstable alpha estimates and shifting factor correlations, demands explicit constraint layers 14.

Institutional quant funds widely recognize that estimation errors in expected returns dominate errors in variances and covariances by significant margins 14. The standard practitioner heuristic is "Half-Kelly" or "Quarter-Kelly." Utilizing Half-Kelly retains approximately 75% of the theoretical maximal growth rate while simultaneously reducing variance by 50% and dramatically mitigating the probability of catastrophic drawdowns 1417.
In practice, funds such as AQR Capital Management and Man Group incorporate uncertainty directly into their sizing models 18. The deeper the statistical mistrust in the variance of the estimator, the deeper the haircut applied to the allocated position size 18. The historical failure of Long-Term Capital Management (LTCM) and the August 2007 Quant Meltdown share a common root cause: extreme overconfidence in the estimated covariance matrix, leading to unconstrained optimal position sizing without adequate fractional haircuts for parameter uncertainty 18.
Risk-Constrained and Bayesian Shrinkage Adjustments
Beyond simple fractional multipliers, modern institutions apply risk-constrained and Bayesian Kelly extensions. Bayesian shrinkage involves treating unknown probabilities as random variables, artificially pulling uncertain alpha estimates toward a long-term base rate or equilibrium 14. This mathematical dampening ensures that anomalous short-term signals do not result in massively concentrated position sizing.
Furthermore, academic research demonstrates that sizing should penalize drawdowns directly rather than relying solely on variance as a proxy for risk. The risk-constrained Kelly framework converts drawdown survival into an explicit mathematical optimization constraint, generating an allocation that maximizes logarithmic growth strictly subject to the condition that the probability of breaching a predefined drawdown limit (e.g., 20%) remains below a specified confidence threshold 1421. This approach bridges the gap between theoretical wealth maximization and the practical reality of institutional fund mandates, where breaching a drawdown threshold results in client redemption rather than long-term compounding 141821.
Empirical Evidence in Active Management
The theoretical dominance of position sizing over trade selection is strongly corroborated by empirical studies of professional asset managers. Because most active equity portfolio managers begin their careers as fundamental analysts focused entirely on security selection, they frequently lack formal, systematic frameworks for portfolio construction when elevated to portfolio management roles. Consequently, discretionary managers often default to intuition, heuristic sizing, or pure equal weighting, leaving substantial alpha unrealized 12.
The Alpha Theory Longitudinal Study
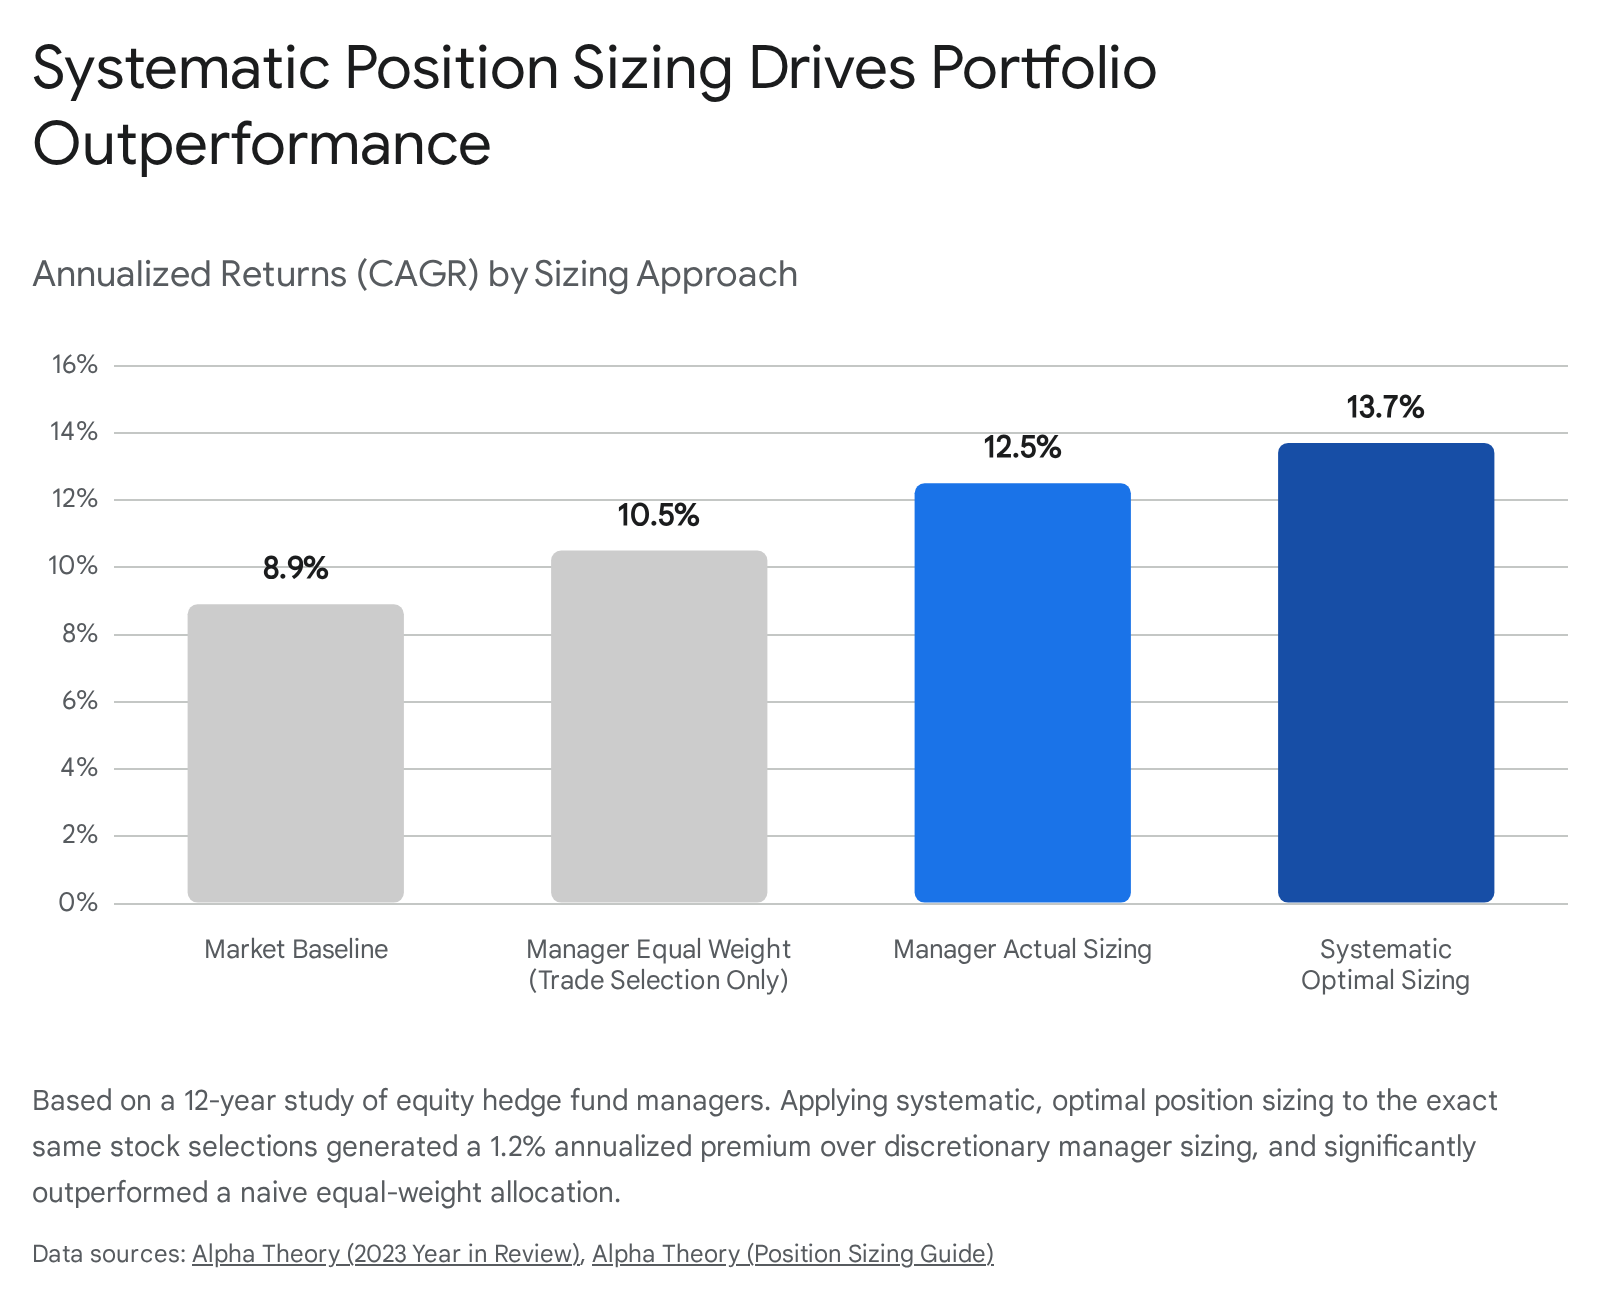
A sweeping twelve-year longitudinal study (2012 - 2023) conducted by Alpha Theory analyzed proprietary data from approximately 200 equity hedge fund managers, decomposing their returns into distinct stock selection, discretionary position sizing, and systematic position sizing components 122. The analysis utilized Return on Invested Capital (ROIC) to normalize varying leverage profiles across the industry 22.
The findings emphatically prove that systematic position sizing drives the vast majority of relative outperformance in professional contexts: * Selection Skill Exists: The managers outpaced a naive market equal-weight index by 1.6% annually, demonstrating valid and persistent trade selection skill 1. * Discretionary Sizing Adds Value: The managers' actual sized portfolios outperformed their own equal-weighted selections by an additional 2.0% annually, meaning their discretionary conviction sizing was accretive to returns 1. * Optimal Sizing Dominates: When the exact same stock selections were subjected to a systematic, rules-based position sizing framework (incorporating probability-weighted price targets and mathematically derived conviction scores), the portfolio outperformed the managers' discretionary sizing by an additional 1.2% annually, resulting in a Compound Annual Growth Rate (CAGR) of 13.7% versus 12.5% 1.

Over the observed period, sizing decisions accounted for a staggering 60% of the managers' outperformance relative to a naive baseline 1. Furthermore, optimal position sizing beat the managers' actual ad-hoc sizing in 11 of the 12 years (a 92% win rate), compounding to cumulative returns that were more than double the industry average (268% cumulative return for optimal versus 130% for actual sizing) 22. This data explicitly confirms that while picking good stocks is essential, sizing them efficiently mathematically separates exceptional geometric growth from mediocre returns 1.
Asset Under Management Constraints and Sizing Alpha
Research conducted by Novus analyzing hedge fund regulatory filings corroborates these dynamics across scale. While smaller managers frequently generate higher absolute returns due to their agility in less liquid micro-cap equities, managers with larger Assets Under Management (AUM) consistently generate higher specific "position-sizing alpha" 23. As a fund's asset base grows, the capacity to rely purely on discovering obscure, high-alpha trades diminishes due to liquidity constraints. To maintain performance, larger managers must transition toward sophisticated portfolio optimization techniques, generating excess returns by systematically concentrating capital in their highest-conviction ideas while rigorously hedging portfolio-level covariances 23.
Machine Learning and Dynamic Position Sizing
The boundary separating discrete trade selection from position sizing is increasingly dissolving with the integration of deep learning and reinforcement learning (RL) in institutional trading architectures. Historically, machine learning was utilized purely in the prediction layer (e.g., utilizing random forests to identify non-linear alpha signals for trade selection). Modern frameworks treat portfolio construction as an ongoing control problem.
Reinforcement Learning in Portfolio Construction
Advanced architectures, such as the Hierarchical Signal-to-Policy (HSTP) frameworks deployed by firms like Man Group AHL, utilize Proximal Policy Optimization (PPO) algorithms to handle dynamic portfolio optimization directly 3426. Within these continuous action spaces, an RL agent does not simply generate a binary buy/sell signal; it learns to continuously rebalance percentage weights across the portfolio in response to shifting market states 45.
These RL agents optimize for multi-period objectives, maximizing cumulative risk-adjusted returns (such as the Mean-CVaR objective) while simultaneously internalizing the frictional costs of trading and the penalty of drawdowns 428. By separating the return prediction layer from the risk-aware allocation layer, these architectures ensure that a strong predictive signal does not result in an oversized position if the agent detects underlying macroeconomic fragility 4.
Epistemic Uncertainty and Regime-Conditional Sizing
Pioneering research by systematic funds like Two Sigma focuses heavily on regime-conditional covariance estimation. Instead of relying on a static, long-term covariance matrix - which understates correlations during crises and overstates them during recoveries - machine learning classifiers continuously detect the current market state (e.g., Crisis, Worry of Inflation, Steady Growth) and condition the position sizing matrix accordingly .
Furthermore, advanced models deploy epistemic uncertainty gating to protect capital. When a cross-sectional equity ranker encounters market environments drastically dissimilar to its training data, its predictive uncertainty spikes. Rather than using this uncertainty as a continuous scaling denominator, cutting-edge frameworks deploy discrete regime gates. If the epistemic uncertainty exceeds a safe threshold, the system halts deployment entirely or aggressively caps the tail-risk position sizes, acting as a structural guardrail during severe sector rotations 29. Empirical tests demonstrate that integrating these volatility-driven and risk-aware extensions substantially improves Sharpe ratios and out-of-sample survival 30.
The Drawdown Dichotomy Ratio
Recent advancements in position sizing research have also sought to quantify the specific structural risks of highly complex sizing algorithms, such as grid and Martingale systems. The introduction of the Drawdown Dichotomy Ratio (DDR) - calculated as the Maximum Equity Drawdown divided by the Maximum Balance Drawdown - provides a precise scalar metric to measure the gap between floating, unrealized risk and realized risk in aggressive sizing systems 6. Analysis utilizing this metric reveals a fundamental principle of modern systematic trading: while machine learning improves the probability of the trade selection, the position sizing structure dictates survival, and advanced metrics like DDR quantify exactly how much structural risk remains in the portfolio 6.
Structural and Regulatory Constraints on Position Sizing
Regardless of how theoretically pristine an optimal sizing formula is, real-world portfolio allocation is harshly bounded by market microstructure, liquidity ceilings, and strict regulatory frameworks. Institutional sizing algorithms must optimize within these non-negotiable boundaries.
Market Impact and Implementation Shortfall
Execution realities dictate that the size of a position cannot practically exceed the market's capacity to absorb the transaction without shifting the underlying price. As systematic strategies attract more capital, they encounter severe alpha decay and market impact 32. A massive theoretical edge derived from trade selection can vanish entirely if the execution of an oversized order drives the bid-ask spread against the fund.
Consequently, algorithmic execution systems - such as Volume-Weighted Average Price (VWAP), Time-Weighted Average Price (TWAP), and Implementation Shortfall algorithms - are deployed specifically to slice large, optimally sized positions into randomized micro-orders, masking institutional intent and mitigating slippage 34. An optimal Kelly calculation that dictates a $50 million position is irrelevant if the average daily volume of the asset is only $5 million.
Global Leverage Restrictions and Margin Rules
Capital availability and regulatory mandates severely constrain maximum position sizing, frequently overriding theoretical optimization. In the United States, Regulation T establishes rigid initial margin requirements, generally restricting retail and standard institutional investors to 50% leverage (2:1) on marginable equities 3536. More sophisticated market participants rely on Portfolio Margin, a risk-based framework governed by FINRA that stress-tests interconnected positions against theoretical price shifts, allowing for dynamically optimized margin requirements on hedged portfolios 36.
Globally, regulatory bodies have aggressively capped leverage limits to protect market participants from the devastating effects of the risk of ruin.
| Regulatory Body / Region | Asset Class | Maximum Permitted Leverage | Policy Framework |
|---|---|---|---|
| ESMA (European Union) | Major Currency Pairs | 30:1 | CFD Product Intervention 377 |
| ESMA (European Union) | Non-Major FX, Gold, Indices | 20:1 | CFD Product Intervention 377 |
| ESMA (European Union) | Individual Equities | 5:1 | CFD Product Intervention 377 |
| ESMA (European Union) | Cryptocurrencies | 2:1 | CFD Product Intervention 377 |
| FSA (Japan) | Domestic Equities | 3:1 | Financial Instruments & Exchange Act 39 |
| SEBI (India) | Equity Derivatives (Trading Members) | ₹7,500 Crore or 15% OI | Future Equivalent (FutEq) Limit 4041 |
| SEBI (India) | Category III AIFs | 2:1 (200% Gross Exposure) | Alternative Investment Fund Rules 42 |
In India, the Securities and Exchange Board of India (SEBI) has overhauled position sizing constraints for equity derivatives. To prevent market manipulation and systemic concentration, SEBI imposes dynamic position limits, recently raising Trading Member limits to the higher of ₹7,500 crore or 15% of total market-wide open interest, while transitioning client limit calculations to a delta-based Future Equivalent (FutEq) methodology to precisely track true risk exposure 4041. Category III Alternative Investment Funds (AIFs) in India, which execute hedge-fund-style strategies, are strictly capped at 200% gross exposure 42.
These hard regulatory ceilings ensure that, even if an aggressive statistical arbitrage calculation dictates massive leverage to exploit a micro-inefficiency, the operational and legal realities of market structure strictly forbid it.
Behavioral Influences on Execution
The failure to execute optimal position sizing is not merely a quantitative shortfall; it is deeply rooted in human behavioral psychology and cognitive constraints. Empirical studies into the behavior of retail investors and discretionary portfolio managers reveal systematic deviations from rational capital allocation.
The "Disposition Effect" - the tendency for investors to rapidly sell winning positions to lock in gains while stubbornly holding losing positions to avoid realizing a loss - structurally inverts positive expectancy 43. This behavior is driven by asymmetric rank preferences; when investors face poorly performing portfolios, their attention to extreme outcomes is exacerbated, leading them to liquidate their best-performing assets prematurely 43. This psychological bias guarantees a low reward-to-risk ratio, ensuring that even highly accurate trade selection ultimately results in a negative geometric growth rate.
Furthermore, the recent proliferation of Large Language Models (LLMs) and AI-assisted trading tools has introduced an "illusion of understanding" among market participants. As complex narratives regarding macroeconomic signals and derivatives are seamlessly generated, investors often experience an inflation of perceived cognitive control, leading to overconfidence 8. This overconfidence frequently manifests in aggressive, oversized positions that ignore fundamental Kelly constraints, demonstrating that without rigorous, systematic boundaries, enhanced trade selection technology can paradoxically increase the probability of catastrophic ruin 8.
Conclusion
The tension between trade selection and position sizing resolves not as a dichotomy, but as a hierarchical dependency in portfolio engineering. Trade selection serves as the engine of an investment strategy; it determines whether the portfolio possesses the mathematical edge required to move forward. Without positive expectancy, no sophisticated sizing algorithm can stave off eventual depletion 3.
However, position sizing acts as the transmission, steering, and braking systems of the portfolio. It translates the raw, abstract power of theoretical edge into the tangible geometric compounding of wealth, navigating path dependency, volatility drag, covariance shifts, and inevitable losing streaks.
As demonstrated by both theoretical proofs (such as the Kelly Criterion and risk of ruin mathematics) and vast empirical datasets (from Alpha Theory, AQR, and Man Group), sub-optimal trade selection can still generate sustainable wealth if managed with exquisite position sizing and rigorous risk controls. Conversely, flawless trade selection combined with excessive or erratic position sizing will face mathematically guaranteed destruction the moment statistical variance introduces an adverse sequence of returns. Ultimately, while picking the right trades initiates the investment process, sizing them correctly dictates its survival and success.