Reasons retail active traders underperform buy-and-hold strategies
Introduction to Retail Trading Dynamics
The comparative efficacy of active trading versus passive investment strategies represents a foundational inquiry within financial economics. A passive buy-and-hold strategy relies on purchasing a diversified portfolio of assets and retaining them over a long-term horizon, effectively ignoring short-term volatility to capture the broader equity risk premium 123. This approach aligns with the Efficient Market Hypothesis (EMH), which posits that asset prices reflect all available information, rendering attempts to consistently time the market largely futile 1. Conversely, active retail trading involves the frequent buying and selling of securities - often holding positions for days, hours, or minutes - with the objective of generating alpha by exploiting short-term market fluctuations and perceived mispricings 23.
Extensive academic literature, longitudinal brokerage data, and regulatory microstructure analyses consistently demonstrate that the vast majority of retail active traders severely underperform a simple, passive buy-and-hold benchmark 345. This underperformance is not the result of a singular strategic error, but rather the consequence of a multifaceted trilemma. First, retail investors are systematically constrained by deeply ingrained cognitive and emotional biases that drive suboptimal decision-making, such as overtrading and the premature realization of gains 678. Second, retail traders face severe structural and informational asymmetries when competing against institutional participants equipped with microsecond execution latency and proprietary alternative data 9101112. Finally, active strategies suffer from the mathematical erosion of frictional costs, primarily the compounding detriment of short-term capital gains taxes, bid-ask spreads, and routing inefficiencies 15131714.
Empirical Evidence of the Performance Gap
Foundational Equity Market Research
The most salient finding in the literature of household finance is that the average long-run performance of individual investors is remarkably poor, even prior to the deduction of trading costs 3. The foundational empirical framework for understanding retail underperformance was established by Barber and Odean (2000), who analyzed the trading records of over 60,000 households at a large discount brokerage firm between 1991 and 1996 51915.
The study revealed a stark divergence between trading frequency and net portfolio performance. During the study period, the broader value-weighted market index returned 17.9% annually. The average retail household earned an annualized net return of 16.4%, turning over approximately 75% of its portfolio annually 1915. However, the most active quintile of traders - those averaging at least 9.6% turnover per month, or over 115% annually - earned a net annualized geometric mean return of only 11.4% 3516.
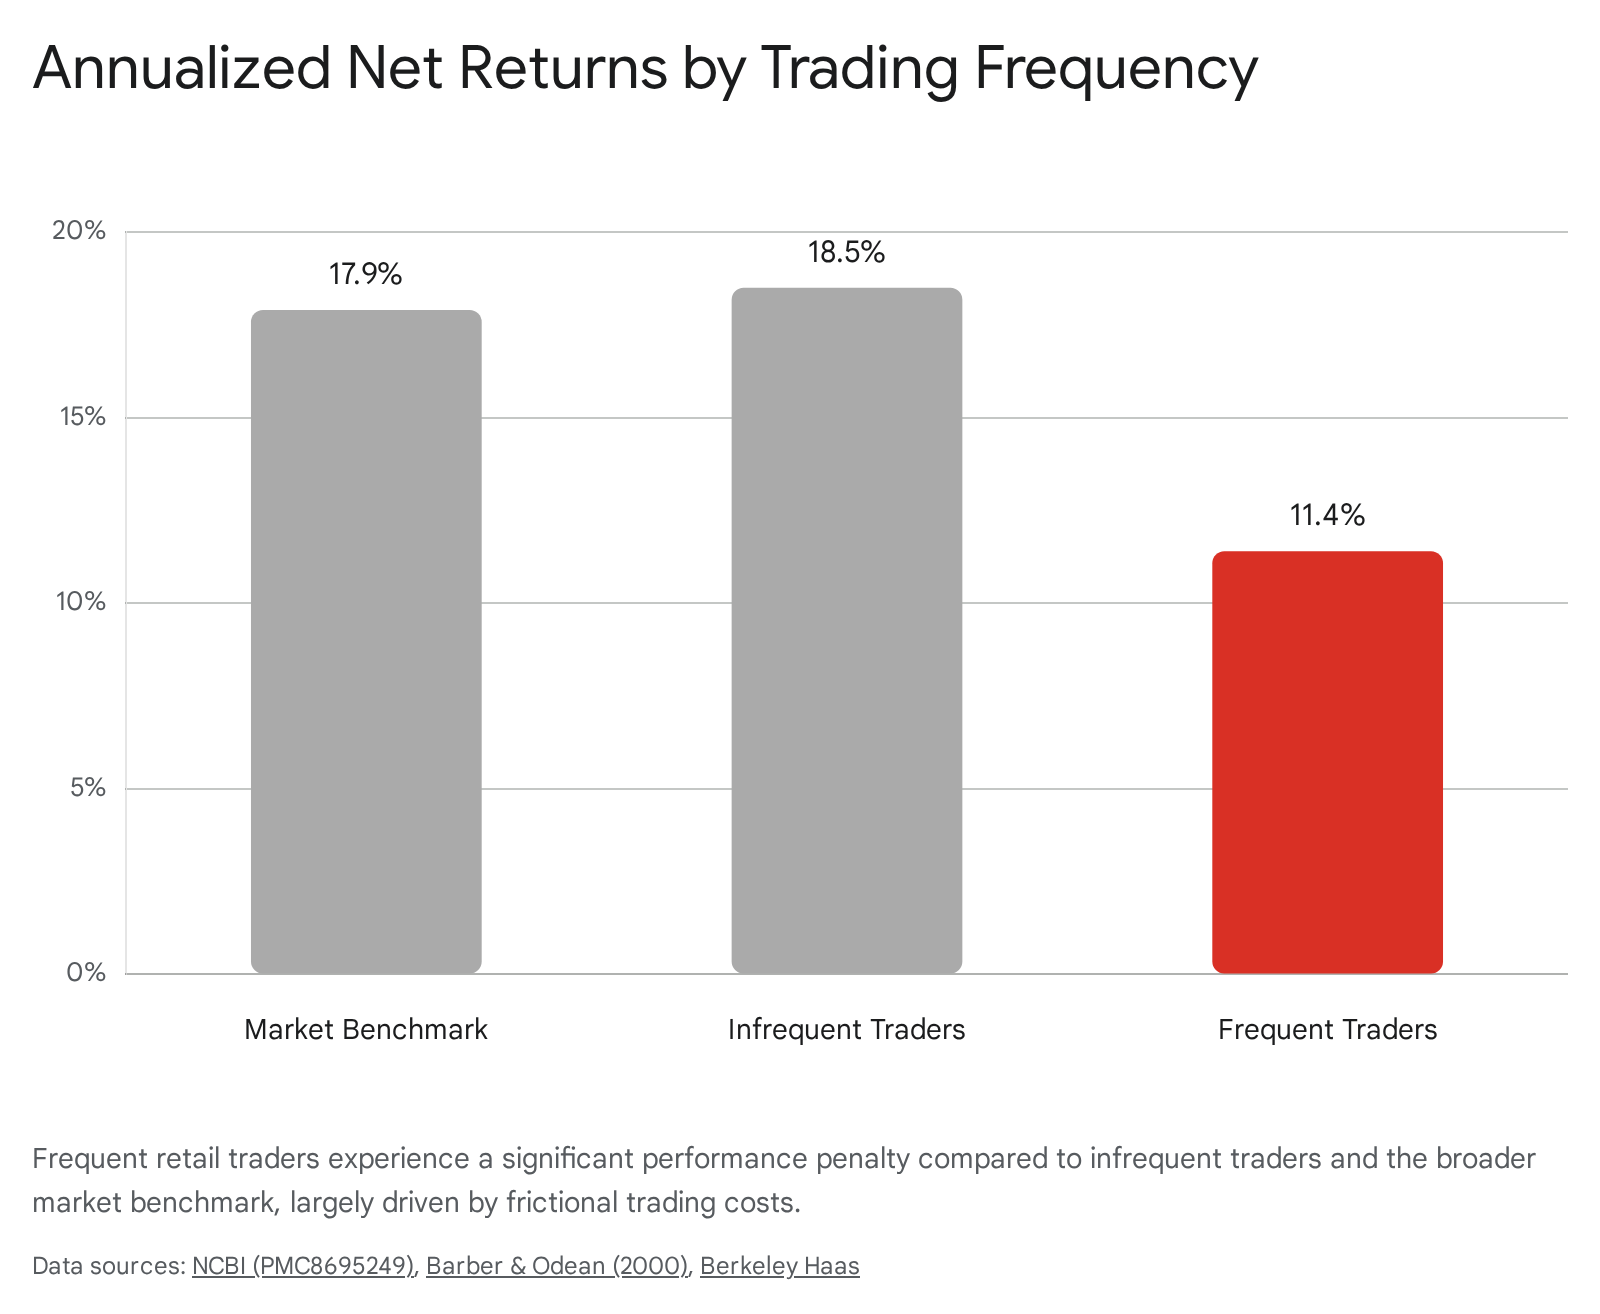
In theoretical models of market equilibrium, such as the Grossman-Stiglitz framework, active traders must earn substantially higher expected gross returns (before costs) merely to compensate for their elevated transaction costs and achieve parity with passive investors 3. The Barber and Odean data demonstrated that retail traders completely fail to clear this hurdle. The gross returns of frequent retail traders were virtually identical to those of infrequent traders, meaning the entirely of their excess trading activity generated zero alpha and only served to degrade net performance through accumulated fees and spread costs 31915.
Subsequent global studies have confirmed the persistence of this phenomenon across different geographic markets and time periods. For instance, research analyzing the Colombian stock market found that retail investor returns were deeply negative across all quintiles of trading frequency, yielding risk-adjusted alphas between -0.34% and -0.37% per month on a gross basis, before plunging further into negative territory after costs 3. Similarly, an exhaustive longitudinal study tracking over 450,000 day traders on the Taiwan Stock Exchange from 1992 to 2006 found that active trading resulted in aggregate negative performance, with unprofitable traders accounting for 72% to 80% of total trading volume in the market 2217.
Regulatory Data on Leveraged Derivative Markets
The statistical evidence of retail underperformance becomes even more pronounced in highly leveraged, short-term derivative markets, specifically Contracts for Difference (CFDs), spread betting, and retail foreign exchange (Forex). Because these products magnify the mathematical impact of bid-ask spreads and margin financing, global financial regulators mandate stringent risk disclosures from brokerages offering them, providing highly transparent and continuously updated data on retail failure rates.
In the United Kingdom, the Financial Conduct Authority (FCA) requires regulated brokers to prominently display the percentage of retail accounts that lose money. As of 2025 disclosures, the major UK brokers report retail loss rates ranging from 71% to 79% 1825. The FCA has noted that approximately 80% of customers lose money when investing in CFDs, prompting the regulator to restrict specific marketing practices, prohibit binary options, and enforce strict leverage limits under policy statement PS18/19 1819. Furthermore, the FCA documented instances where retail investors relying on unregulated social media influencers ("finfluencers") experienced catastrophic losses, with over 90,000 individuals losing approximately £75 million over a four-year period at a single offshore firm 1819.
Similar regulatory audits in the European Union and Australia corroborate these figures. The European Securities and Markets Authority (ESMA) reported that across different EU jurisdictions, 74% to 89% of retail trader accounts lose money on CFD trading, with average account losses ranging from €1,600 to €29,000 1827. In Australia, a comprehensive sector-wide review by the Australian Securities and Investments Commission (ASIC) covering the 2023 - 2024 financial year found that 68% of retail CFD investors lost money. This resulted in net retail losses exceeding $458 million, which included $73 million simply in financing and transaction fees, across 133,674 accounts 28202122.
| Regulatory Body | Geographic Region | Market Segment | Documented Retail Loss Rate | Reference Data Period |
|---|---|---|---|---|
| FCA | United Kingdom | CFDs & Spread Betting | 71% - 79% | 2025 Broker Disclosures 1825 |
| ESMA | European Union | CFDs & Forex | 74% - 89% | ESMA Internal Analysis 1827 |
| ASIC | Australia | CFDs | 68% (85% for options CFDs) | 2023 - 2024 Financial Year 202122 |
These leveraged environments exacerbate the underlying mathematical reality of active trading. Leverage multiplies transactional costs and bid-ask spread erosion, requiring an exceptionally high win rate or asymmetric risk-reward ratio merely to achieve breakeven. According to ASIC, even trades that initially generate a gross profit can have their returns entirely eroded by the associated overnight funding costs and trading spreads required to maintain the leveraged position 282232.
The Options Market Profitability Debate
The underperformance of retail traders has recently been scrutinized following a systemic shift away from traditional equity trading toward complex, short-dated derivatives. Driven by the democratization of mobile trading platforms, total U.S. options contract volume surged past 11 billion contracts in 2023, and hit over 12 million contracts traded in 2024 333435. A primary catalyst for this volume explosion is the proliferation of zero-day-to-expiration (0DTE) options. Today, 0DTE options account for roughly 43% of average daily options volumes, with retail investors responsible for over half of all short-dated contract trading 333423.
The academic consensus regarding the profitability of retail options trading remains highly contested. Several prominent studies, notably Bryzgalova, Pavlova, and Sikorskaya (2023) [BPS], argue that retail options traders experience massive, systemic losses 2438. Using Option Price Reporting Authority (OPRA) data and single-leg improvement mechanisms (SLIMs) as a proxy for retail flow, BPS calculates that retail traders suffer deeply negative returns 243839. BPS also documented a phenomenon termed the "dividend play" arbitrage, wherein retail traders routinely fail to optimally exercise American call options prior to an underlying stock's ex-dividend date. Market makers capture this unharvested intrinsic value, effectively extracting a risk-free windfall due to retail investors' lack of sophisticated option-pricing knowledge 38.
Conversely, researchers utilizing proprietary exchange data - such as analyses based on the Cboe Options Exchange - argue that retail losses in options may be vastly overstated. The Cboe research contends that the BPS methodology relies on flawed assumptions. Specifically, BPS estimated trade direction using the historical "quote rule," which misclassified a significant portion of trades, and computed holding period performance using midpoint prices prior to expiration rather than actual expiration settlement values 2425. When using corrected Cboe data that includes precise trade direction flags and expiration values, retail customer trades were found to be marginally profitable, generating an estimated average net profitability of $0.34 million per day between January 2020 and June 2023 24.
| Methodology Feature | Bryzgalova, Pavlova, Sikorskaya (2023) | Cboe Exchange Research (2024/2025) |
|---|---|---|
| Data Source | OPRA (Public Feed) | Proprietary Cboe Exchange Data 2425 |
| Trade Direction Inference | "Quote Rule" Estimation | Exact Exchange Flags 24 |
| Performance Calculation | NBBO Midpoint Prior to Expiration | Actual Expiration Settlement Values 24 |
| Conclusion on Retail Returns | Deeply Negative | Marginally Profitable ($0.34M/day) 24 |
Despite this methodological debate, both sides agree on the behavioral profile of the modern retail options trader: their portfolios exhibit extreme short-termism and remain severely under-diversified. Retail options trading is highly concentrated in broad index products (which represent up to 93% of their notional volume) and characterized by rapid intraday speculation rather than long-term hedging, leaving retail capital continually exposed to variance drag 3926.
Cognitive and Emotional Biases
The divergence between rational economic theory - which assumes market participants act to maximize utility through optimal information processing - and actual retail trading outcomes is largely explained by behavioral finance. Retail investors are systematically hindered by deeply ingrained cognitive errors and emotional biases that induce irrational trading patterns 68.
The Disposition Effect and Loss Aversion
The disposition effect, rooted in Kahneman and Tversky's Prospect Theory, is one of the most pervasive behavioral anomalies in retail finance. It describes the propensity of investors to prematurely sell assets that have increased in value ("winners") to lock in a guaranteed profit, while stubbornly holding onto assets that have decreased in value ("losers") to avoid the psychological pain of realizing a loss 6727.
Prospect Theory dictates that "losses loom larger than gains," meaning the emotional impact of a financial loss is significantly more intense than the satisfaction derived from an equivalent gain 678. Consequently, when a retail trader's position falls into a deficit, they often exhibit risk-seeking behavior, holding the depreciating asset in the irrational hope that the market will reverse 6. This behavior directly violates the fundamental quantitative trading maxim to "cut losses short and let winners run" 7. By truncating the right tail of the return distribution (artificially limiting gains) and exposing themselves to the full magnitude of the left tail (prolonging outsized losses), active retail traders structurally guarantee long-term underperformance relative to a passive portfolio that captures uninterrupted compound growth 727.
The disposition effect is further compounded by mental accounting. Investors frequently peg an asset to its original acquisition price, evaluating its current worth solely based on whether it sits above or below that arbitrary mental anchor, rather than objectively assessing the asset's future expected return 678. This refusal to accept losses also prevents retail investors from engaging in tax-loss harvesting, thereby missing opportunities to offset capital gains and improve their net portfolio efficiency 6.
Overconfidence and the Illusion of Control
Overconfidence bias leads individuals to overestimate their analytical abilities, the accuracy of their private information, and their capacity to predict future market movements, while simultaneously underestimating systemic risk 68. In the context of retail investing, overconfidence is universally identified as the primary psychological catalyst for excessive trading volume 727.
Retail traders frequently conflate random variance or broad macroeconomic beta with personal skill. The Self-Serving Bias exacerbates this dynamic; investors attribute profitable trades to their own intellect and strategic acumen, while externalizing failures by blaming market manipulation, unpredictable news events, or "bad luck" 67. This reinforced illusion of control prompts retail traders to construct under-diversified portfolios and engage in highly speculative, high-turnover trading strategies 68. Active traders must earn higher expected gross returns to compensate for their elevated trading costs. Overconfident investors continually fail to meet this threshold, mistaking a high volume of market activity for a high probability of market success 316.
Attention-Driven Asset Selection
Retail traders are disproportionately influenced by external stimuli, exhibiting strong attention-based buying behaviors. Institutional algorithms continuously screen thousands of equities based on quantitative metrics and fundamental valuations. In contrast, retail investors face a severe cognitive constraint on their attention 62829.
Because retail investors generally lack the margin capabilities or risk appetite to short-sell securities, their decision-making is asymmetrical. When picking a stock to buy, the opportunity set theoretically includes all stocks in the market. However, because they cannot process all market data, their buying decisions are limited almost exclusively to the specific subset of stocks that manage to capture their focus through news cycles, social media trends, or sudden volume spikes 629. Consequently, retail buying is heavily concentrated in "attention-grabbing" assets - such as meme stocks or highly volatile technology equities. Academic research demonstrates that stocks experiencing peak retail attention and high retail order imbalances are frequently overvalued at the time of purchase and subsequently suffer dismal long-term returns 62829.
Frictional Costs and the Mathematics of Compounding
Even if a retail active trader could perfectly overcome all behavioral biases and execute a mathematically sound strategy, they must contend with the corrosive drag of frictional costs. In active trading, gross performance must substantially outpace the market average simply to achieve net parity with a buy-and-hold approach 316.
The Compounding Burden of Tax Drag
In taxable brokerage accounts, the frequency of trading fundamentally alters the mathematics of compound interest due to "tax drag" 131714. Most retail investors erroneously view taxes as a one-time transactional cost. However, the true cost of taxation is the permanent removal of working capital from the portfolio, creating a lasting gap in compounding potential 17.
The IRS categorizes capital gains based on holding periods. Profits from assets held for longer than one year qualify for preferential long-term capital gains rates (0%, 15%, or 20%), whereas profits from assets held for one year or less are taxed as short-term capital gains, matching the investor's ordinary income tax bracket 151317. When a buy-and-hold investor retains a position, the unrealized gains remain fully invested, compounding entirely tax-free until the ultimate point of liquidation 1730. Conversely, when an active trader closes a profitable position to rotate into a new asset, the realized short-term capital gains tax immediately reduces their investable principal.
Consider a hypothetical scenario comparing two investors holding a $100,000 equity position with $80,000 in unrealized gains. If the buy-and-hold investor retains the asset and it grows by 10% annually, the full $100,000 compounds. If an active trader sells the asset, they incur an immediate tax liability - for example, $16,000 assuming a 20% tax rate. The active trader now has only $84,000 to reinvest. To match the untaxed 10% annual return of the buy-and-hold investor over the next decade, the active trader's new investment must earn approximately 11.9% per year 17.
| Investor Profile | Initial Value | Realized Gain | Tax Paid (Assuming 20%) | Net Reinvestable Capital | Required Annual Return for 10-Year Breakeven |
|---|---|---|---|---|---|
| Buy-and-Hold Investor | $100,000 | $0 (Deferred) | $0 | $100,000 | 10.0% 17 |
| Active Trader | $100,000 | $80,000 | $16,000 | $84,000 | ~11.9% 17 |
This required excess performance of nearly 200 basis points annually must be achieved strictly through superior asset selection. Over prolonged periods, this constant capital extraction severely limits terminal wealth. Models demonstrate that a hypothetical $100,000 portfolio held over 40 years could forfeit up to 62% of its potential total return to taxes if subjected to high-turnover active management, compared to a tax-efficient, low-turnover portfolio 1430.
Bid-Ask Spreads and Turnover Costs
The advent of "zero-commission" brokerages created an illusion that trading is entirely free. However, while flat-rate transaction fees were eliminated, retail investors still pay the bid-ask spread - the difference between the highest price a buyer is willing to pay and the lowest price a seller is willing to accept 2331.
The spread acts as a hidden toll on every single transaction. Active traders utilizing high-turnover strategies (e.g., day trading, swing trading, and intraday options trading) subject their capital to the spread multiple times per week. Even in highly liquid equities where the spread is just a few pennies, the cumulative erosion of principal is immense. For an investor turning over 250% of their portfolio annually, the aggregate spread costs represent a massive hurdle rate that their stock-picking acumen is highly unlikely to overcome 16.
Structural and Informational Asymmetries
Beyond psychological constraints and frictional costs, retail active traders operate at a severe structural disadvantage compared to institutional participants. The modern market microstructure is a highly fragmented, technologically sophisticated ecosystem where massive capital expenditure directly correlates with informational, analytical, and execution advantages 1247.
The Information Acquisition Gap
The modern financial market is driven by data speed and granularity. Traditional data sources - such as SEC filings, quarterly earnings reports, and macroeconomic indicators - are processed instantaneously by institutional algorithms, effectively eliminating any exploitable edge for manual retail traders reading public news feeds 1232.
To generate true alpha, institutions rely heavily on alternative data. Hedge funds purchase satellite imagery to track vehicle density in retail parking lots, utilize advanced natural language processing (NLP) models to gauge real-time social media sentiment, and analyze aggregated credit card transaction flows to accurately forecast revenue reports weeks before they are publicly disclosed 1132. This level of data acquisition requires massive financial and technological infrastructure.
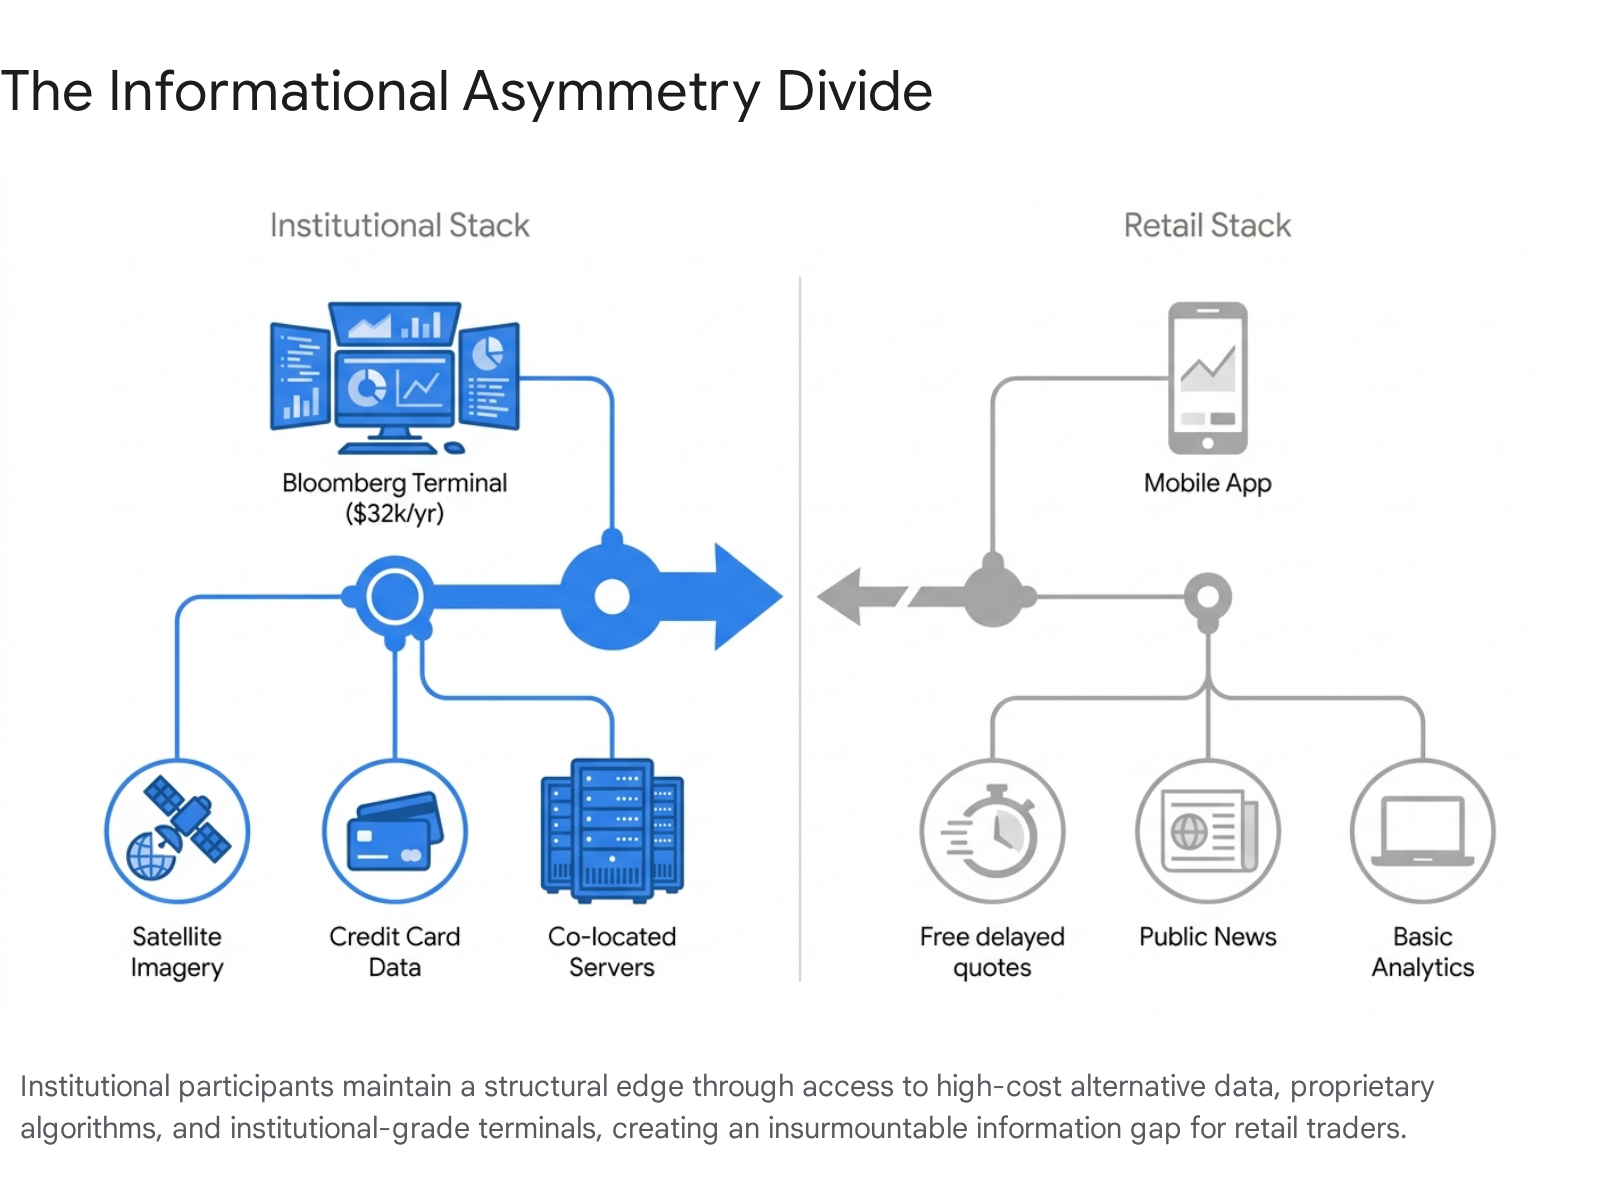
The cost barrier alone segregates the market. A single Bloomberg Terminal, the industry standard for real-time financial data, analytics, and global news aggregation, costs between $28,000 and $32,000 per user, per year 49335152. Alternative institutional data feeds from providers like Refinitiv Eikon similarly cost over $22,000 annually 5253. Retail traders rely on free screeners, delayed quotes, and consumer-grade mobile applications, leaving them perpetually reliant on information that has already been priced into the market 1252. When retail investors attempt to actively trade based on publicly available news, they suffer from adverse selection, as they are effectively trading against institutional counterparties who initiated their positions milliseconds after the data was published 5434.
| Market Participant | Primary Data Source | Typical Hardware / Execution Infrastructure | Estimated Annual Data Cost |
|---|---|---|---|
| Institutional Trader | Alternative Data, Bloomberg Terminal, Real-Time Market Depth | Co-located Servers, FPGA chips, NLP Algorithms | >$30,000 per seat + alternative data fees 12493352 |
| Retail Trader | Traditional Data, Public News, Free Screeners | Consumer ISP, Mobile Application, Web Browser | $0 - $500 1252 |
Execution Latency and High-Frequency Trading
Execution speed represents an unassailable moat for institutional investors. High-frequency trading (HFT) firms account for an estimated 50% to 60% of total U.S. equity trading volume 12. These firms invest heavily in co-location services - paying to place their physical servers inside the same data centers as the exchange matching engines. By utilizing dedicated fiber-optic or microwave networks, HFT firms reduce their execution latency to the microsecond or nanosecond level 1256.
Retail execution speed is constrained by consumer internet routing protocols, physical distance from exchanges, and the processing time of retail brokerage infrastructure. This results in execution times measured in milliseconds or seconds 12. This latency disparity allows HFT algorithms to detect patterns in incoming retail orders and execute proprietary trades ahead of them, capturing micro-mispricings and altering the liquidity landscape before the retail order can be filled. While retail traders can utilize basic automated bots or limit orders to protect themselves, they remain vulnerable to the rapid withdrawal of liquidity - often referred to as "ghost liquidity" - by institutional algorithms during periods of market stress 1256.
Payment for Order Flow and Market Segmentation
The modern retail trading landscape was radically altered by the advent of "zero-commission" brokerages. However, the elimination of front-end commissions merely shifted the cost of trading to the back end through a practice known as Payment for Order Flow (PFOF) 3531.
Under the PFOF model, retail brokerages do not route their clients' market and marketable limit orders directly to public exchanges (like the NYSE or Nasdaq). Instead, they route the orders to off-exchange wholesale market makers (such as Citadel Securities or Virtu Financial) 91031. Wholesalers pay brokerages for the exclusive right to execute this retail order flow. They do so because retail flow is predominantly "uninformed" - it consists of small, uncorrelated trades driven by noise, emotion, or behavioral biases rather than proprietary fundamental analysis 1035.
When executing trades on a public exchange, market makers face heavy adverse selection; if they take the other side of a massive institutional order, the price is highly likely to move against them immediately after the trade (high price impact) 1036. Conversely, retail flow carries significantly lower adverse selection risk, allowing wholesalers to capture a much wider "realized spread" - the actual profit the market maker retains 91035. While wholesalers are mandated by the SEC under the National Best Bid and Offer (NBBO) rules to provide price improvement relative to public exchanges, the routing of retail flow away from public lit markets ensures that retail traders rarely interact directly with natural institutional liquidity 93147. As a result, the retail execution environment is structurally designed to extract the spread margin from the retail trader to subsidize the zero-commission model.
The Impact of Platform Gamification
To sustain the PFOF revenue model, modern brokerages must ensure continuous, high-volume retail trading. This has led to the widespread adoption of Digital Engagement Practices (DEPs) and the gamification of the investment process. Retail mobile applications now utilize behavioral nudges - such as leaderboards, confetti animations for completed trades, social copy-trading metrics, and aggressive push notifications detailing price trends 37383940.
Empirical research on gamified platforms demonstrates that these features effectively increase user engagement, but at a severe cost to retail execution quality. The Ontario Securities Commission (OSC) conducted a controlled experiment revealing that participants exposed to social interaction feeds and copy-trading conditions increased their trading volume in promoted stocks by 12% and 18%, respectively, compared to a control group 39. Gamification increases trading volume by heightening dopamine responses and encouraging social comparison, which demonstrably leads to elevated risk tolerance and the amplification of the disposition effect 3740.
A comprehensive analysis of 142 app updates across major U.S. retail brokers found that the introduction of gamified features cumulatively increased retail trading volume by 22.53%. However, this hyper-engagement decreased retail returns by 27.32% while increasing return volatility 41. Ironically, this gamified behavior forces retail traders to act more noisily and irrationally, rendering their order flow less toxic and highly profitable for the institutional market makers who absorb it 41.
The Exception: Distinguishing Skill from Luck
While the aggregate empirical data overwhelmingly proves that active retail trading destroys wealth relative to a buy-and-hold approach, financial literature does acknowledge the existence of a minuscule subset of retail traders who exhibit genuine, persistent skill 22.
Determining skill in financial markets requires separating true alpha from statistical variance (luck). Because market returns are inherently noisy, short-term success is mathematically meaningless; a retail trader can drastically outperform the market over a one-year period purely through variance and survivorship bias 4265. Robust academic frameworks utilize metrics like the Sharpe Ratio over extended time horizons to filter luck from skill. Studies indicate that an investor must consistently maintain a high Sharpe Ratio (e.g., >0.60) over three to five years before the probability of their outperformance being attributed to talent rather than chance exceeds 80%. For absolute certainty, 10 to 20 years of continuous data is required 4265.
Research analyzing decades of data from the Taiwan Stock Exchange provides the most rigorous assessment of retail day trading skill. The study tracked over 450,000 individual day traders from 1992 to 2006. Out of this massive cohort, only roughly 4,000 traders (less than 1%) demonstrated consistent profitability net of fees over the long term 22. These rare, skilled individuals succeeded by trading in "hard-to-value" stocks - small-cap equities with high volatility and severe information asymmetry - where pricing inefficiencies were most prevalent 2243. They acted as sophisticated liquidity providers, deeply understood the mechanics of the limit order book, and avoided the behavioral traps of overtrading highly liquid, efficient large-cap equities where institutional algorithms dominate 2243. For the remaining 99% of the retail trading population, the attempt to actively trade resulted in the direct transfer of their capital to institutional market makers and brokerage infrastructure 2217.
Conclusion
The vast underperformance of retail active traders relative to a simple buy-and-hold approach is a structural and mathematical inevitability for the majority of market participants. The attempt to generate short-term alpha requires an individual to overcome an insurmountable trilemma:
- Psychological Biases: Retail traders are biologically and psychologically wired to realize gains prematurely and hold losses indefinitely due to the disposition effect. Concurrently, overconfidence drives them to churn their portfolios at rates that guarantee mathematical degradation.
- Structural Asymmetries: Retail traders lack the capital required to purchase the alternative data, microsecond latency infrastructure, and institutional-grade analytics necessary to uncover true alpha in an highly efficient market. Instead, their "uninformed" order flow is purchased by wholesale market makers who extract realized spreads.
- Frictional Constraints: The compounding mathematics of tax drag, bid-ask spreads, and platform financing fees requires an active trader to generate massive excess returns merely to break even with the passive, uninterrupted compound growth experienced by a buy-and-hold investor.
While the advent of zero-commission mobile platforms has successfully democratized access to the financial markets, it has simultaneously gamified the ecosystem. This incentivizes the exact behaviors - high turnover, short-term directional options betting, and attention-driven asset selection - that empirical research conclusively proves are hazardous to long-term wealth accumulation. For the retail investor, patience, diversification, and the minimization of frictional costs via a buy-and-hold strategy remain the most statistically robust methods for achieving positive long-term returns.