Startup Landing Page Conversion and Design Performance Data
Baseline Conversion Benchmarks and Market Dynamics
The fundamental objective of a startup landing page is to transform visitor attention into quantifiable commercial intent. However, establishing a universal baseline for "good" performance is inherently flawed without isolating the variables of industry vertical, traffic origin, and the specific conversion action. Comprehensive analysis of aggregated performance data reveals that the global median conversion rate for dedicated landing pages across all industries stands at 6.6% 123. This figure, derived from the rigorous testing of over 41,000 landing pages and 57 million conversion events, provides a necessary macro-level anchor 1.
However, looking at the broader digital ecosystem, the median conversion rate for general website pages is considerably lower, sitting at 2.35% 45. The gap between an average website and a dedicated landing page illustrates the value of singular focus and the elimination of extraneous navigational elements. Furthermore, the distribution curve of landing page performance is not linear. While the median rests at 6.6%, the top 25% of landing pages exceed an 11.45% conversion rate, and the top decile of performers consistently push beyond the 15% threshold 45. This discrepancy is rarely a function of raw traffic volume; rather, it is the result of systematic conversion rate optimization (CRO) methodologies applied to form architecture, page latency, and post-click message match.
Sector-Specific Performance Variations
Conversion rates diverge significantly across product categories due to varying levels of purchase complexity, the length of the sales cycle, and the size of the organizational buying committee 46.
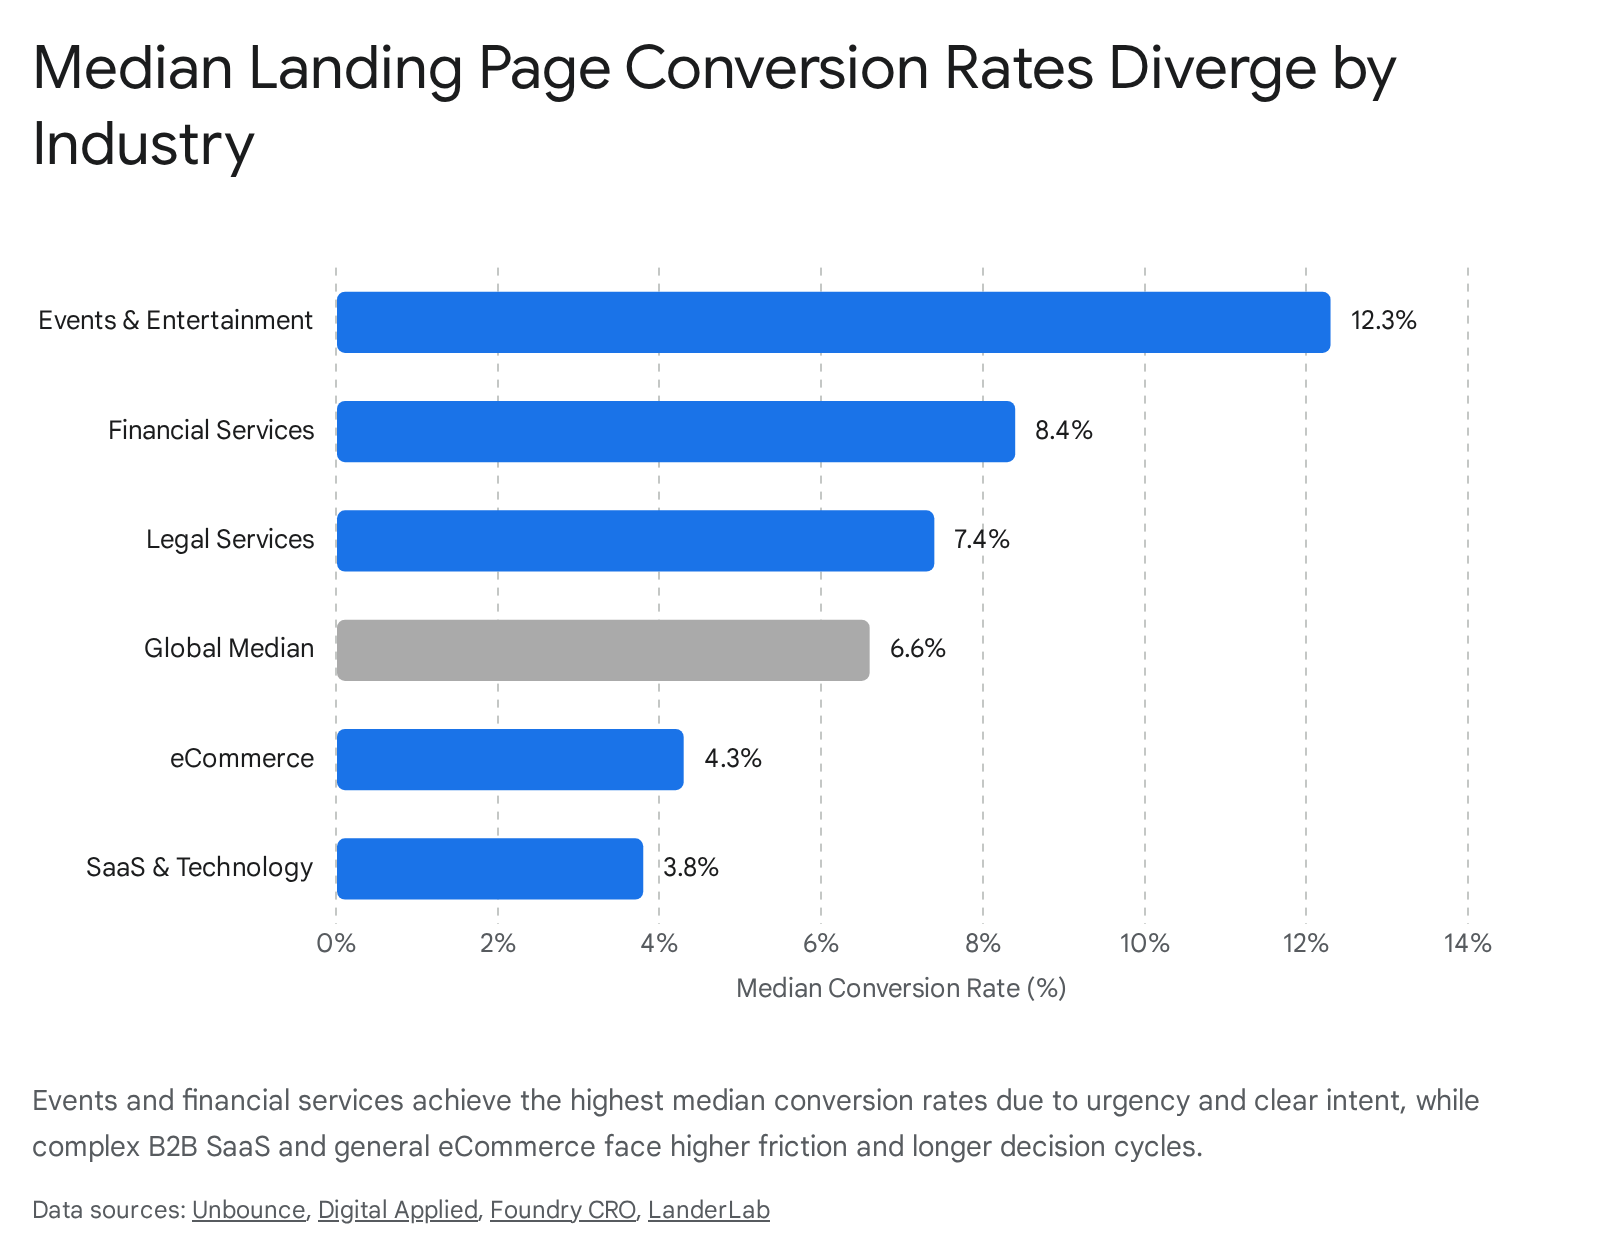
High-urgency consumer sectors and industries dealing with immediate necessity naturally exhibit superior baseline conversion metrics. For instance, landing pages in the events and entertainment sector achieve a median conversion rate of 12.3%, propelled by date-based scarcity and straightforward consumer decision matrices 3.
The financial services sector occupies a highly specialized tier, converting at a median rate of 8.4% 23. This performance - approximately 27% above the global median - reflects the sector's sophisticated targeting capabilities and the necessity for compliance-driven, unambiguous messaging. Regulated industries are structurally forced to be specific about their value propositions, which inadvertently aligns with CRO best practices. Legal services similarly demonstrate robust conversion rates, averaging 7.4%, as user intent is often driven by compulsory, time-sensitive needs 68.
In stark contrast, complex business-to-business (B2B) markets face significant friction. Software-as-a-Service (SaaS) and technology landing pages convert at a median rate of 3.8% 3. Complex B2B SaaS deployments frequently require multi-stakeholder consensus, security reviews, and long-term financial commitments, which suppresses immediate top-of-funnel conversion 6. Similarly, B2B eCommerce converts at just 1.8%, reflecting the cautious approach procurement teams take toward high-value transactions 7.
| Industry Vertical | Median Conversion Rate | Key Driving Factors |
|---|---|---|
| Events & Entertainment | 12.3% | High urgency, strict date-based scarcity, simple decision architecture |
| Financial Services | 8.4% | High consumer intent, strict compliance-driven clarity, advanced targeting |
| Legal Services | 7.4% | Immediate necessity, high-trust requirements, compulsory needs |
| Healthcare | 3.0% - 4.2% | Trust barriers and regulatory compliance requirements moderate initial conversions |
| eCommerce (General) | 2.35% - 4.3% | Highly transactional audience; strong variance based on seasonal discounts |
| SaaS & Technology | 3.8% | High complexity, longer sales cycles, multi-stakeholder evaluations |
| B2B eCommerce | 1.8% | High-value transactions, procurement protocols, cautious buyer behavior |
The Impact of Traffic Channels and AI Search
The origin of the traffic arriving at a startup's landing page fundamentally alters the probability of conversion. Traffic sources map directly to different stages of buyer awareness and commercial intent. Data indicates that email-driven traffic is the undisputed leader in conversion efficacy, averaging a 19.3% conversion rate 26. Visitors arriving via email represent a warm audience that has already opted into communication, placing them securely in the middle-to-bottom stages of the conversion funnel.
Paid search advertising (such as Google Ads) captures high-intent prospects actively seeking specific solutions. Across all industries, paid search yields an average conversion rate of 7.52% to 10.9% 16. However, this rate is highly dependent on keyword specificity; generic search terms convert poorly, while long-tail, high-intent queries yield substantial returns. Paid social channels present a wider variance. Meta platforms (Instagram and Facebook) can convert at 17.9% and 13% respectively for highly targeted direct-to-consumer (D2C) campaigns 1. Conversely, standard organic social media traffic historically converts at a much lower 1.2% to 2.9%, reflecting the passive, browsing nature of social audiences who are rarely in an active purchasing mindset 6.
A critical emerging trend in 2025 and 2026 is the rapid rise of AI-driven search referrals. Traffic arriving from platforms like ChatGPT, Perplexity, and AI Overviews converts at an average rate of 3.49%, demonstrating a 22% lift over traditional organic search (which hovers around 2.86%) 5. ChatGPT referrals alone show conversion rates as high as 3.71% 5. Users arriving from conversational AI interfaces tend to possess significantly higher intent because the AI agent has already synthesized information, answered preliminary questions, and narrowed their consideration set prior to the outbound click.
| Traffic Channel | Average Conversion Rate | Intent Profile and Behavioral Context |
|---|---|---|
| Email Marketing | 19.3% | Warm audience, existing brand relationship, high mid-funnel intent |
| Paid Social (Meta Platforms) | 12.0% - 17.9% | Algorithmic behavioral targeting, high visual engagement, impulse capability |
| Paid Search (Google Ads) | 7.52% - 10.9% | Active query formulation, high solution-seeking intent |
| AI Search Referrals (e.g., ChatGPT) | 3.49% - 3.71% | Pre-qualified consideration set, synthesized preliminary research |
| Organic Search (SEO) | 2.35% - 2.86% | Broad information seeking, mixed funnel stages, exploratory intent |
| General Social Media (Organic) | 1.2% - 2.9% | Passive timeline browsing, low immediate commercial intent |
A persistent mechanical discrepancy also exists between device types. While mobile devices account for the vast majority of web traffic - often representing 65% to 83% of total sessions - desktop conversion rates consistently outperform mobile 15. Desktop landing pages convert approximately 8% to 42% better than their mobile counterparts, depending on the complexity of the industry 15. The mobile-desktop gap has actually widened to 42% by 2026, despite years of mobile-first design initiatives 5. This "mobile paradox" indicates that while users discover products on smartphones, they frequently defer complex evaluation, comparative analysis, and high-friction form submissions to desktop environments 8.
Form Architecture and Cognitive Friction
For lead generation landing pages, the data intake form acts as the primary gateway to the sales pipeline. The architectural design of this form is the highest-leverage interactive surface on the page. Optimization of the form infrastructure yields highly predictable, non-linear impacts on user conversion behavior.
Field Count and the Penalty of Complexity
Extensive A/B testing reveals an inverse correlation between the number of input fields and the overall conversion rate. Analysis of over 1.4 million forms demonstrates that reducing field count is the most reliable mechanism for increasing raw lead volume 4. Single-field forms (typically capturing only an email address) convert at 13.4%. Expanding the form to three fields reduces the conversion rate to 10.1%. At five fields, the rate drops to 7.8%, and at nine fields, it collapses to 3.6% 4.
Crucially, the degradation of conversion probability is not linear. The steepest drop-off in user completion occurs when a form is expanded from four to seven fields 4.
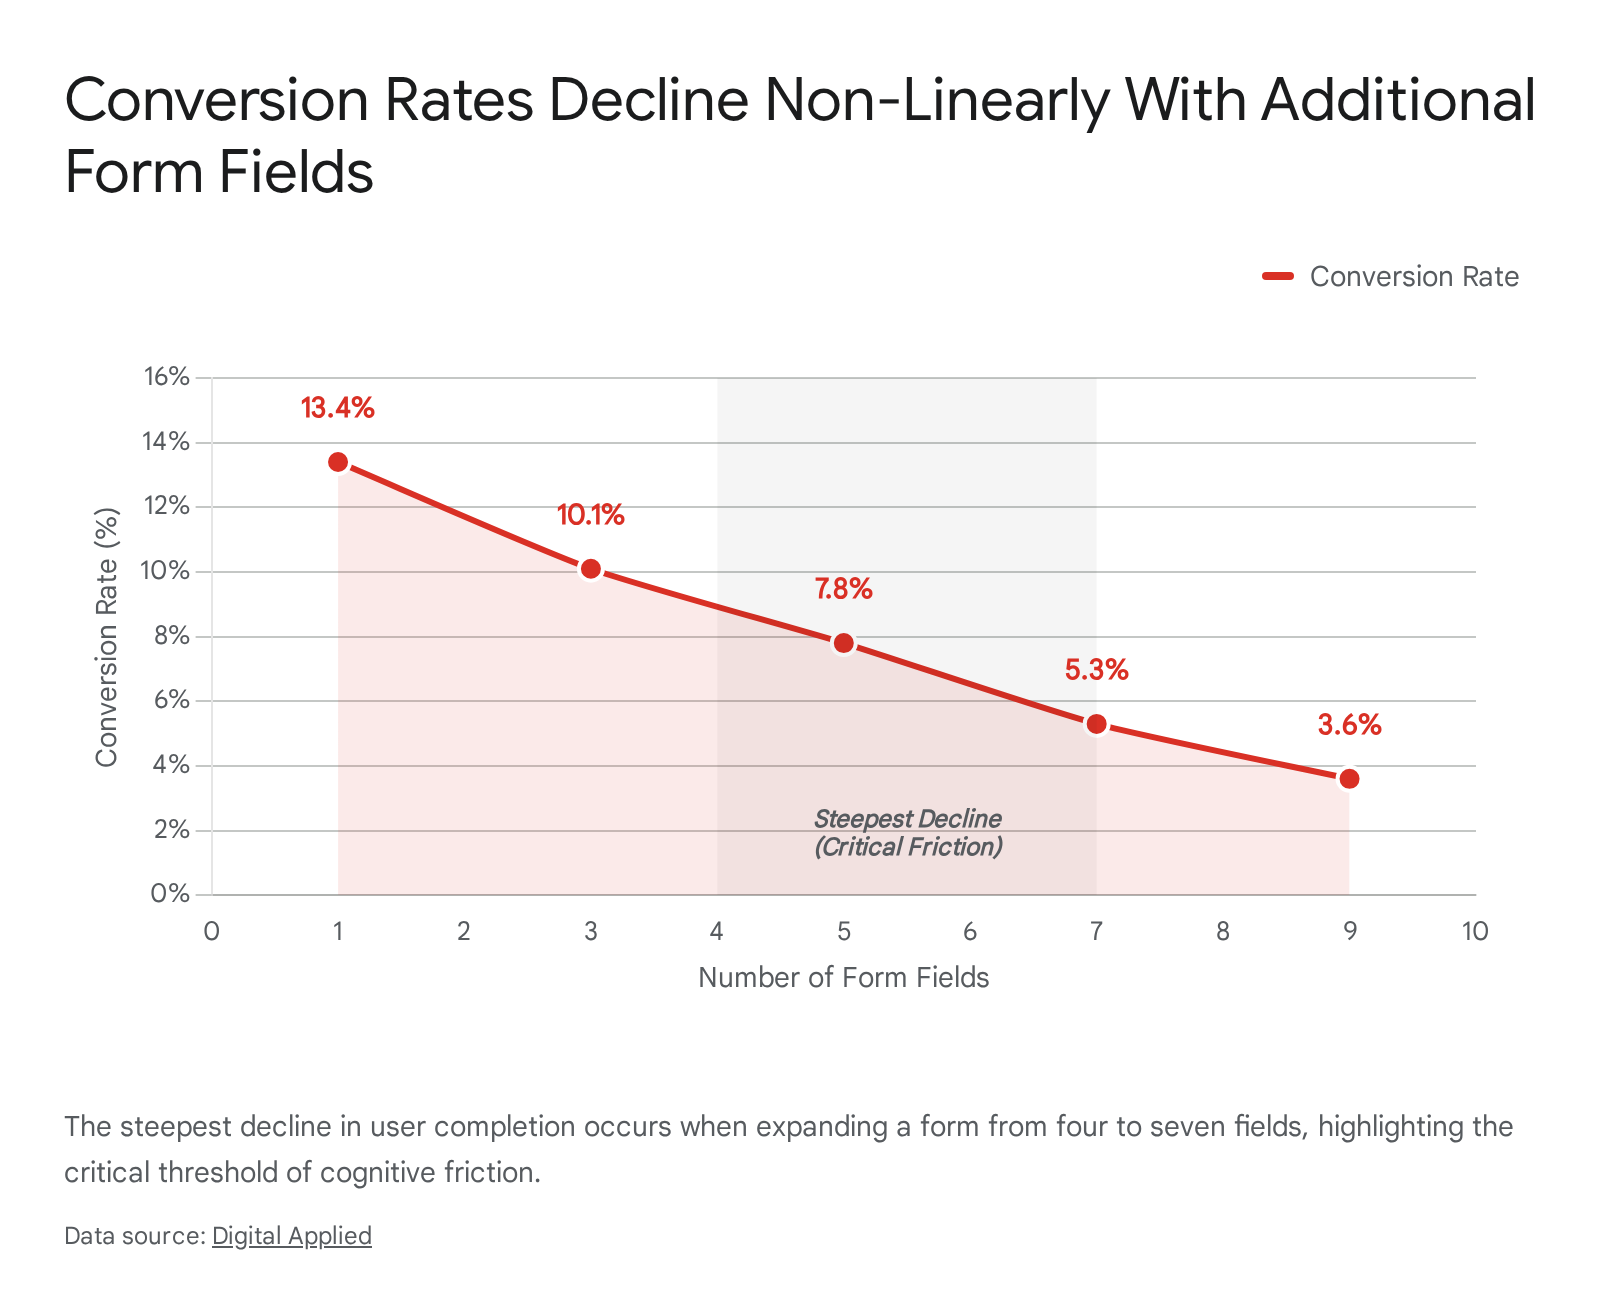
This threshold represents the point at which cognitive friction and privacy concerns outweigh the perceived value of the offer.
Sequential Routing and Progressive Disclosure
Compressing a form by permanently deleting fields is not the only optimization vector. The presentation architecture heavily influences perceived cognitive load. Multi-step forms - where questions are segmented across two or three sequential panes - reliably outperform single-page forms containing the exact same number of total fields 4. On average, deploying a multi-step sequence yields a 21% lift in conversion rates compared to a static vertical form 4.
By utilizing progressive disclosure, the interface asks for low-friction information first (e.g., a simple multiple-choice question regarding the user's primary goal), building behavioral micro-commitments before requesting high-friction personally identifiable information (PII) such as phone numbers or corporate revenue figures. Additionally, integrating conditional logic that dynamically hides irrelevant questions based on previous answers can increase conversions by an additional 11% 4.
Balancing Lead Volume Against the Conversion Gap
While reducing friction universally increases the raw volume of leads, top-performing startups recognize that landing page conversion rate optimization must be balanced against lead quality and downstream sales efficiency. A high conversion rate at the top of the funnel is detrimental if the resulting leads fall outside the Ideal Customer Profile (ICP) and consume valuable operational resources. Current industry data reveals a massive "Lead Conversion Gap": while organizations spend $92 to acquire traffic for every $1 spent on conversion optimization, up to 80% of marketing leads are never successfully followed up by sales due to poor quality or unmanageable volume 11. Only 12% of marketing and sales professionals report being "very satisfied" with their lead-to-sales conversion rates 9.
In specific scenarios, intentionally introducing friction into a landing page form can yield superior business outcomes. A documented A/B test conducted on a B2B software landing page illustrates this counterintuitive principle. The optimization team initially hypothesized that shortening a multi-step form would improve conversion. However, removing fields led to a significant drop in both the absolute conversion rate and the volume of Marketing Qualified Leads (MQLs) 10. When the team tested the anti-hypothesis - adding an extra qualifying step asking users if they currently utilized a competing software solution - the conversion rate actually increased by 20% 10.
This phenomenon occurs because high-quality prospects exhibit different behavioral patterns than low-intent browsers. Strategic friction, such as asking highly relevant qualifying questions, signals to the prospect that the vendor understands their specific operational context. High-quality leads generated through qualified forms convert up to three times more often than low-fit leads downstream 11. Marketers are advised to utilize "lead gen dials": if the sales pipeline is starved for volume, reduce form fields to maximize intake; if the sales team is overwhelmed by unqualified inquiries, dial up friction to prioritize the pipeline and eliminate "dead ends" for the sales force 11.
The urgency of data qualification is compounded by systemic shifts in the lead generation economy. Return rates for bad leads erode profitability by 12% to 15% in mature verticals 12. Furthermore, future projections suggest that by 2030, AI agents will increasingly request leads and negotiate services via API, bypassing traditional landing page forms entirely in an "agentic commerce" market projected to reach trillions globally 12. Startups must therefore build forms that validate intent today, while preparing for programmatic data exchange tomorrow.
Hero Section Optimization and the Speed-Conversion Paradox
The "hero section" - the visual area spanning the top of the webpage before the user scrolls - is the most critical digital real estate on a startup's landing page. Users form initial aesthetic and trust-based opinions about a site within 50 milliseconds 13. Data indicates that optimizing the hero section yields an average conversion lift of 38%, an impact significantly higher than modifications made to any other singular page element 13.
Mitigating the Largest Contentful Paint (LCP) Penalty
There is a frequent operational tension between marketing teams desiring visually striking hero sections and engineering teams prioritizing performance. High-resolution images, auto-playing background videos, and dynamic JavaScript overlays dramatically inflate the Largest Contentful Paint (LCP) metric.
Performance testing across 2.1 million landing page sessions reveals a severe speed-conversion paradox. For every one-second delay in load time beyond 2.5 seconds, conversion rates drop by 7% 24. Pages that render in under 1.5 seconds convert 2.4 times better than pages loading in four seconds 4. Furthermore, every additional 100KB of asset weight in the hero section increases the bounce rate by 1.8% 13.
For paid traffic campaigns, this latency penalty is compounded. Slow pages erode Google Ads Quality Scores, which subsequently raises the Cost-Per-Click (CPC) before a conversion event can even be measured 4. Optimization protocols demand the use of next-generation image formats (WebP, AVIF), responsive loading algorithms, and the deferral of video payloads until critical structural content and the primary CTA have fully rendered 13.
The Efficacy of Hero Imagery versus Video
A persistent debate in startup conversion optimization involves the efficacy of massive hero imagery versus unrefined, minimalistic design aesthetics. A/B testing frequently shows that lean, text-centric hero sections outperform asset-heavy designs. In a multi-site Search Experience Optimization (SXO) study, removing an oversized, visually dominant hero image entirely resulted in users interacting with 20 times more elements on the page, driving a 20.40% increase in request-quote conversions and a 3.79% increase in rental inquiries 14.
Without the visual barrier of a massive stock photo, essential content was pushed higher up the screen, aligning immediately with user intent. Users navigated directly to high-intent actions, and active time on the page actually increased (from 1.2 minutes to 3.1 minutes) because they were engaging with substantive content rather than staring at decorative graphics 14.
The integration of video in the hero section yields highly contextual results. Certain industry benchmarks suggest that video format testimonials and explainer videos can increase product page conversions by an average of 80% to 86% 21519. Explainer videos successfully reduce friction for highly complex B2B SaaS products by demonstrating software workflows that text cannot easily capture. However, for simple commodities, high-urgency services, or comparison-shopping scenarios, video can act as a distraction, delaying the user from reaching the CTA and causing negative conversion impacts 216.
Scroll Behavior and the Performative Scrolling Index
The concept of the "fold" - a remnant of newspaper layout strategy suggesting all critical information must be visible without scrolling - has been heavily scrutinized in contemporary UX research. While data from the Nielsen Norman Group confirms that above-the-fold content still captures 57% of page-viewing time, the notion that users refuse to scroll is a demonstrably false myth 121718. Users are highly accustomed to scrolling, provided the above-the-fold content establishes clear relevance and provides an "information scent" that encourages downward exploration.
The Illusion of the Privacy Placebo
Recent human-computer interaction (HCI) research introduces the concept of the "Performative Scrolling Index" (PSI) to measure how users interact with dense web pages 1920. This research reveals a phenomenon known as the "privacy placebo." This occurs when users execute slow, low-information interactions - such as carefully scrolling through dense privacy policies, lengthy terms of service, or overly long sales copy - without actually improving their comprehension of the material 1920.
Users engage in performative scrolling because it allows them to reconcile two conflicting beliefs: the desire to be a conscientious consumer and the reality that reading boilerplate text is an inefficient use of time 19. The result is an interaction ritual that mimics diligence but ultimately ends in blind acceptance.
In the context of landing pages, this indicates that forcing all elements above the fold artificially can crowd the visual hierarchy, causing cognitive overload. Conversely, utilizing the entire vertical screen area to pace information via progressive disclosure keeps the user engaged. When a landing page relies on ample whitespace and singular focus per scroll depth, users naturally advance down the page to access secondary supporting evidence, testimonials, and detailed feature matrices.
The Efficacy of Social Proof Mechanisms
When website visitors lack certainty regarding a startup's efficacy, they default to psychological heuristics, looking to the behavior of others for behavioral guidance 2122. Implementing social proof effectively shifts the burden of trust from the brand's own marketing claims to the collective experience of its user base.
Validating the Conversion Lift of Social Proof
The integration of authentic customer reviews acts as a powerful conversion multiplier. According to the Spiegel Research Center at Northwestern University, displaying reviews can increase conversion rates by 270%, with the effect being particularly pronounced for higher-priced or complex products where financial risk is elevated 1527. An overarching survey indicates that 98% of consumers read reviews before making a purchase, up from 77% in 2017 27.
The formatting of social proof dictates its impact. Video format testimonials dramatically outperform standard text reviews, delivering up to an 80% improvement in conversion rates 15. The visual and emotional connection generated by seeing a real human articulate a product's value establishes stronger trust signals than written text, which consumers increasingly suspect may be AI-generated or fabricated.
Similarly, User-Generated Content (UGC) natively embedded into landing pages yields a 29% higher web conversion rate compared to pages relying solely on studio-polished marketing assets 15. For SaaS startups targeting enterprise clients, the prominent display of recognizable client logos acts as a primary credibility heuristic. Furthermore, real-time social proof notifications - widgets displaying live customer activity, such as recent purchases or sign-ups - can boost conversions by up to 98% by simultaneously triggering validation and the fear of missing out (FOMO) 15.
The psychological power of social proof is robustly documented. In a 14-week study conducted in a hospital environment, researchers tested seven different signs to encourage hand sanitization, each based on one of Robert Cialdini's principles of persuasion (e.g., Reciprocity, Scarcity, Authority). Out of all variations exposed to over 246,000 visitors, only the signs relying on Authority and Social Proof ("Our hospital visitors disinfect their hands") significantly increased compliance compared to the control 23. This demonstrates the deep-seated human desire to align with "herd behavior."
Trust Seal Fatigue and Negative Social Proof
While social proof is essential, its execution requires precise restraint. A common fallacy in conversion rate optimization is the assumption that stacking multiple trust elements linearly increases consumer confidence. A/B testing reveals a phenomenon of diminishing returns, and in some cases, active suppression of conversion rates due to "trust seal" overuse.
When a landing page is overloaded with dozens of five-star badges, security seals, media logos, and real-time purchase pop-ups, the interface signals desperation rather than authority 27. In various documented tests, optimizer Eric Hansen reported that removing a generic trust seal actually increased conversions by 3.5% 24. Another test by WhichTestWon demonstrated a 12.6% higher conversion rate on a lead form that explicitly removed security badges 24. In a separate user study, removing trust-building testimonials and ratings resulted in an anomalous 74.1% conversion increase, proving that poorly implemented proof can backfire 24.
If a brand is completely unknown, excessive trust seals remind the user that they are in a high-risk environment, inadvertently triggering skepticism. The most effective social proof is selective, contextual, and positioned directly adjacent to high-friction points (such as the payment form or pricing tier selection) to counter specific buyer objections 2127.
Product-Led Versus Sales-Led Growth Models in SaaS
For B2B SaaS startups, the architectural design of the homepage is dictated by the overarching go-to-market strategy: Product-Led Growth (PLG) versus Sales-Led Growth (SLG). In 2026, 58% of B2B SaaS companies operate a product-led motion, with 91% of those planning to increase their investment in the methodology 2526.
Top-of-Funnel Conversion in PLG
The primary metric for PLG landing pages is the free-to-paid conversion rate, which carries a median of approximately 9% 25. However, the specific structure of the trial offering heavily influences top-of-funnel conversion and eventual revenue realization. Freemium models generate high visitor-to-user conversion rates (median 12%) because the barrier to entry is virtually non-existent, but they face lower free-to-paid conversions downstream 25.
Opt-in free trials (no credit card required) average an 18.2% conversion to paid 26. In contrast, opt-out trials (requiring a credit card upfront) achieve a much higher 48.8% conversion rate, albeit at the cost of significantly higher initial landing page friction that severely restricts top-of-funnel visitor volume 26. Products with an Annual Contract Value (ACV) between $1,000 and $5,000 show the strongest median free-to-paid conversion at 10%, while sub-$1,000 ACV products perform exceptionally well in the top quartile, reaching 24% conversion rates 2526.
The Hybrid Motion and Product Qualified Leads (PQLs)
While pure PLG relies on the product to sell itself, the most competitive SaaS companies in 2026 run a hybrid motion: utilizing PLG to land users efficiently, and SLG to expand accounts strategically 3233. In a hybrid model, the landing page is designed to facilitate self-serve adoption while simultaneously identifying high-value targets for sales intervention.
The key to this architecture is the Product Qualified Lead (PQL). A functional PQL system tracks activation milestones and feature adoption patterns to score accounts for sales outreach. Startups that deploy PQL frameworks routinely see conversion rates that are roughly three times higher than those utilizing traditional Marketing Qualified Lead (MQL) funnels 2526. PQL-driven funnels show a 25% to 30% average conversion rate for free trials, compared to single-digit percentages for unscored leads 2633.
According to OpenView SaaS Benchmarks, the hybrid model generates the highest total Annual Recurring Revenue (ARR) and the most efficient capital consumption because it feeds the sales pipeline with PQLs that convert at higher rates and through shorter sales cycles 32. Furthermore, emerging "agent-led growth" models - where AI agents guide the onboarding process - are pushing free-to-paid conversion rates to 25% to 30%, dwarfing the 3% to 8% range of traditional, unassisted PLG motions 33.
| Go-To-Market Model | Target ACV | CAC Payback Period | Primary Growth Lever | Expected Initial Conversion Rate |
|---|---|---|---|---|
| Product-Led Growth (PLG) | $0 - $15K | 3 - 12 months | Product virality, self-serve upgrades | 9% (Free-to-Paid Median) |
| Sales-Led Growth (SLG) | $25K - $500K+ | 12 - 24+ months | Sales headcount, outbound reps | 1.5% - 4% (Visitor to Demo) |
| Hybrid / Agent-Assisted | Blended | Highly Efficient | PQLs routed to Account Executives | 25% - 30% (PQL to Paid) |
Cultural Variations in User Experience and Localization
Global startups cannot rely on a monolithic approach to landing page architecture. User experience conventions, visual processing habits, and conversion rate baselines vary dramatically across different geographic and cultural markets.
Structural Divergence: Western Minimalism versus East Asian Density
A fundamental divergence exists between Western (North American and European) and East Asian digital design philosophies. Western UX heavily prioritizes minimalism, whitespace, strict typographical hierarchy, and progressive disclosure 2728. The underlying assumption in Western design is that reducing cognitive load by showing one primary action at a time accelerates decision-making and funnels the user efficiently toward a single CTA.
Conversely, East Asian web design - particularly in markets like China, Japan, and South Korea - embraces high information density, complex grid layouts, vibrant colors, and multifunctional interfaces (often culminating in "super apps") 273629. This is not a lack of design sophistication, but a reflection of distinct cultural and linguistic contexts. Logographic writing systems (like Chinese characters) convey significantly more semantic meaning per visual unit than phonetic alphabets. Additionally, the lack of capitalization or italicization in these scripts means designers rely heavily on color, saturation, and layout proximity for emphasis rather than font weight 2728.
Asian users do not inherently view dense pages as cluttered; rather, they view them as efficient communication dashboards that eliminate the need to click through multiple pages to find information 2829. A Western landing page deployed in East Asia may be perceived as empty, lacking crucial detail, and therefore untrustworthy. Conversely, an Asian platform's density may overwhelm a Western user. Academic research presented at the CHI Conference on Human Factors in Computing Systems analyzed these preferences in the context of hotel landing pages between Taiwan and the Netherlands, confirming that cultural backgrounds shape visual preferences and dictate how information must be structured to secure conversions 30.
However, the rapid success of apps like RedNote (Xiaohongshu) among Western users suggests that digital consumers are highly adaptable; they can learn to navigate denser interfaces if the core utility is strong enough 27.
The Localization Revenue Gap
The failure to account for these UX and cultural differences results in substantial financial losses. A 2026 survey of 500 global business leaders revealed a severe "localization revenue gap," where poor localization costs businesses an average of 20% of their potential international revenue annually 31. While 85% of leaders acknowledge that localization is important, only 28% consider their efforts to be "very strong" 31.
These cultural differences, combined with varying economic conditions, result in significant regional conversion rate disparities. E-commerce conversion benchmarks indicate that the United Kingdom leads major Western markets with an average conversion rate of 2.6% to 4.1% 40. The United States averages between 1.96% and 2.3%, and Germany sits at 2.22% 40. In contrast, markets like Italy demonstrate much lower baseline conversion rates, averaging 0.99% 40. Startups utilizing a blended global conversion average as a Key Performance Indicator (KPI) will inevitably miscalculate the health of their localized campaigns.
The Influence of Aesthetic Polish on Conversion
A persistent philosophical divide in startup conversion optimization centers on the efficacy of polished, high-fidelity corporate design versus unrefined, brutalist, or even "ugly" aesthetics. Counterintuitively, empirical A/B testing frequently demonstrates that less polished, straightforward landing pages outperform aesthetically perfect designs.
The "Ugly Sells" Philosophy
Research from conversion optimization agencies like KlientBoost notes that "ugly" landing pages succeed because they strip away distracting visual flair, forcing the user's attention entirely onto the core value proposition and the call-to-action 32. Polished designs can sometimes trigger banner blindness; if a hero image looks too much like a generic stock photo or a high-end corporate advertisement, the user's natural skepticism is elevated.
The effectiveness of less polished advertisements leans heavily on "authenticity signaling" and "cognitive fluency" 32. A design that feels slightly raw or unrefined often appears more genuine, mirroring user-generated content rather than corporate marketing. In a specific case study by Conversion Design, a founder refused a visual overhaul because of the "ugly sells" adage, noting that marketing colleagues had previously cut their conversion rates in half by deploying overly polished redesigns 42.
This dynamic is equally prevalent in advertising. "Ugly" Facebook ads frequently cut through the clutter of polished creative elements, boosting scroll-stopping power because their unrefined vibe enhances brand trust and disrupts expected visual patterns 43.
When Best Practices Fail
The reliance on universally accepted "best practices" is a frequent trap for startup marketers. A/B testing repeatedly uncovers anomalies that defy conventional design wisdom.
For example, image sliders (carousels) are almost universally derided by UX optimizers as conversion killers. However, in a documented test for Device Magic, replacing a video with a slider resulted in a 30% increase in conversions 24. In another extreme case, a banner slider featuring 17 images managed to secure conversions on the 15th image, defying all logical expectations regarding user patience 24.
Similarly, the "single CTA" rule is considered foundational to landing page design. Yet, a Danish e-commerce site increased conversions by 17% by adding a second CTA above the primary "add to cart" button, and Get Response saw a 158% increase in trial sign-ups by placing a "FREE trial" button immediately adjacent to their primary "Buy Now" CTA 24. Furthermore, while using photos of human faces to build empathy is a standard practice, the eyewear brand Felix + Iris experienced a 72% higher conversion rate when they completely removed the photo of a person, realizing the face was distracting from the actual product 24.
These anomalies underscore a principle articulated by Lean Startup pioneer Eric Ries: "Without split-testing, your product tends to get prettier over time. With split-testing, it tends to get more effective" 44. Obsessing over minuscule aesthetic decisions - such as Google's infamous test of "41 shades of blue" or debating border thicknesses - is ultimately futile if the core offer does not resonate 44. Testing must focus on radical shifts in value proposition and friction, rather than mere decoration.
Artificial Intelligence and Predictive Experimentation
The methodologies governing landing page optimization are currently undergoing a structural shift driven by machine learning, large language models (LLMs), and algorithmic prediction.
The Velocity of AI-Driven A/B Testing
Traditional A/B testing is inherently constrained by traffic volume and the human capacity to isolate variables. Across the industry, only 13% of standard A/B tests produce a statistically significant winning variant, with 9% producing a significant loss, and the remaining 78% resulting in inconclusive outcomes 4. This severe inefficiency means startups frequently burn traffic and capital testing minor variables that fail to move the commercial needle, resulting in high opportunity costs.
The integration of AI-driven experimentation platforms is resolving these constraints. AI systems can conduct multivariate testing at a scale previously impossible, detecting complex interaction effects between multiple page elements simultaneously (e.g., how a specific headline performs only when paired with a specific hero image format and button color) 5.
Consequently, organizations utilizing AI testing infrastructure reach statistical significance 31% faster - securing valid test results in an average of 14 days compared to 21 days for traditional tools 5. Furthermore, AI models identify winning variations that human analysts miss 18% of the time. Because the speed advantage compounds, startups running AI-driven tests can execute more experiments per quarter, resulting in significantly faster compounding improvement to their baseline conversion rates 5. By 2025, it is projected that 30% of companies will use AI to improve their testing processes, up from just 5% in 2021 7.
Neuromarketing and Saccadic Optimization
Moving beyond basic A/B tests, advanced platforms are deploying neuromarketing principles and predictive analytics to alter interfaces based on human neurological processing. A 2026 report confirmed that the neuromarketing industry surpassed $9.1 billion, with 63% of marketers planning to increase their investment in the technology 45.
Using tools like wearable EEG devices and facial coding software, researchers map natural saccadic eye movements to optimize visual flow. In documented tests, restructuring an above-the-fold visual hierarchy based on these natural eye movement patterns boosted conversions by 28% 45. Eye-tracking allows marketers to pinpoint micro-moments of distraction or disengagement that traditional click-tracking metrics cannot catch, proving that small tweaks in pacing, layout, and visual flow profoundly change how a marketing narrative is neurologically received 45.
As the digital landscape evolves, the highest-converting startup landing pages will transition away from being singular, static documents. Instead, they will operate as dynamic, programmatic interfaces that adjust friction, information density, social proof, and visual flow in real-time, tailoring the user experience perfectly to the inferred intent and psychological profile of the individual visitor.