Social Determinants of Human Longevity
The study of human longevity has traditionally emphasized genetic predispositions, clinical healthcare access, and advancements in medical technology as the primary drivers of life expectancy. However, comprehensive epidemiological research increasingly demonstrates that the distribution of longevity gains is fundamentally governed by social, economic, and psychological determinants. While average global life expectancy rose from 67 years in 2000 to 73 years in 2019, this aggregate metric obscures profound disparities both between and within nations 1. Furthermore, longevity increases have not been uniformly matched by proportionate increases in healthspan - the period of life spent free from chronic disease and disability. Across 183 World Health Organization (WHO) member states, the gap between life expectancy and health-adjusted life expectancy climbed from 8.5 years in 2000 to 9.6 years globally by 2019 2. This indicates that while populations are living longer, a greater absolute portion of late life is increasingly burdened by morbidity.
The social determinants of longevity encompass a complex network of factors, including macroeconomic resource distribution, neighborhood opportunity, exposure to chronic psychological stress, and the strength of social integration. Structural inequities alter the trajectory of biological aging, while psychosocial factors - ranging from community cohesion to an individual's internalized sense of purpose - serve as measurable protective mechanisms.
Global Socioeconomic Stratification and Lifespan Inequality
At the global macro-level, national wealth classifications and macroeconomic resources are the primary predictors of premature mortality. Progress in reducing lifespan inequality - defined as the statistical variance in age at death within and across populations - has stalled or reversed in numerous low-income demographics. Tracking lifespan inequality alongside average lifespan is essential for identifying health disparities and ensuring equitable health gains across populations 3.
Data derived from the 2024 United Nations World Population Prospects reveals that lifespan inequality remains highly stratified, with national life expectancies ranging from approximately 33 years in countries experiencing extreme poverty and conflict to over 83 years in high-income nations 3. A 2024 Lancet Public Health report commissioned by the WHO identified a 22-year gap in life expectancy between Sub-Saharan Africa and the North Atlantic region (defined as North America and Europe) 4. Approximately 80% of this life expectancy gap is driven by 15 priority health conditions, with over half of the mortality difference attributed to infectious diseases and maternal, newborn, and child health complications 4.
In populations facing extreme poverty and fragile health infrastructure, mortality is not compressed into older age brackets; rather, disproportionately high rates of death occur at the youngest ages. In 35 low- and lower-middle-income countries, the average age at death for the lowest lifespan quintile (the youngest 20% to die) remains under one year of age 3. From 1950 to 2023, lifespan inequality actually increased by 12 years in low-income countries, as longevity gains were concentrated among the wealthiest or most resilient cohorts while the most vulnerable continued to experience high infant and youth mortality 3.
Cross-National Disparities Among High-Income Nations
Even among high-income nations within the Organisation for Economic Co-operation and Development (OECD), wealth alone does not guarantee uniform longevity gains. The United States exhibits a marked longevity disadvantage relative to its peer nations despite spending substantially more per capita on healthcare. In 2024, U.S. life expectancy at birth reached 79.0 years, remaining 3.7 years below the comparable OECD country average of 82.7 years 56. Comparable high-income nations such as Switzerland and Japan boast life expectancies of 84.4 and 84.0 years, respectively, yielding a longevity gap of over five years compared to the United States 678.
Educational attainment operates as a significant protective factor within these national statistics. Across 23 OECD countries, the gap in life expectancy between high- and low-education individuals averages 8 years for men and 5 years for women at age 25 9. In the United States, inequalities in longevity by education level have expanded significantly, contributing heavily to the nation's lagging aggregate life expectancy 10. A comparative analysis of 2023 data between the United States and the United Kingdom found a 2.7-year gap in overall life expectancy (78.6 years in the U.S. versus 81.3 years in England and Wales), driven entirely by four preventable causes of death: cardiovascular disease, drug overdoses, motor vehicle crashes, and gun violence 11. The disparity in cardiovascular death alone represents 57% of the total life expectancy difference between the two nations, indicating that population-level health behaviors and structural safety policies directly mediate longevity outcomes 11.
| Country | 2023 Harmonized Life Expectancy (Years) | Gap vs. United States (Years) | Healthcare Spending Per Capita (USD PPP, 2023) |
|---|---|---|---|
| Japan | 84.0 | + 5.6 | $5,640 |
| Switzerland | 84.1 | + 5.7 | $9,688 |
| France | 82.9 | + 4.5 | $7,136 |
| Canada | 81.6 | + 3.2 | $7,013 |
| United Kingdom | 81.2 | + 2.8 | $6,023 |
| OECD Average | 82.7 (2024 est.) | + 3.7 | Varies |
| United States | 78.4 | 0.0 | $13,432 |
Table 1: Life expectancy and healthcare spending comparisons across select high-income nations, utilizing harmonized OECD and World Bank data sources. 567.
Sub-National Stratification in the United States
National averages consistently obscure severe sub-national disparities driven by systemic inequality, residential segregation, and regional economic distress. The stratification of lifespan within the United States provides a clear epidemiological model for how geographic and racial characteristics interact to dictate longevity outcomes.
The Ten Americas Framework
A comprehensive 2024 analysis published in The Lancet partitioned the U.S. population into ten mutually exclusive groups - termed the "Ten Americas" - based on race, ethnicity, county-level geographic location, metropolitan status, income, and historical residential segregation 1213. The analysis of mortality data from the National Vital Statistics System spanning 2000 to 2021 revealed that the life expectancy gap between the highest-performing and lowest-performing groups nearly doubled over two decades, growing from 12.6 years in 2000 to 20.4 years in 2021 121415.
Asian Americans (categorized as America 1) recorded the highest life expectancy throughout the study period, peaking at 86 years in 2019 and maintaining an average of 84.0 years in 2021 1516. Conversely, American Indian and Alaska Native (AIAN) populations living in the West (America 10) experienced the lowest longevity. Their life expectancy declined precipitously from 72.3 years in 2000 to 63.6 years in 2021 1617. This 63.6-year life expectancy places the AIAN Western population on par with national averages in nations such as Afghanistan and the Democratic Republic of the Congo 171819.
The variations observed across the Ten Americas emphasize that neither race nor income alone dictates longevity; their intersection with geography and systemic resource allocation is the primary driver. For instance, Black Americans living in rural, low-income counties in the South (America 9) and those in highly segregated metropolitan areas (America 7) historically reported the lowest life expectancies, yet experienced significant gains between 2000 and 2010 due to long-term improvements in educational attainment and reductions in HIV/AIDS mortality 141520. By the mid-2010s, the gap between Black and White life expectancy had narrowed to historic lows, before progress stagnated due to rises in overdose deaths and was subsequently eroded by the disproportionate impacts of the COVID-19 pandemic 1415.
| Ten Americas Grouping | Demographic Description | Life Expectancy (2000) | Life Expectancy (2021) |
|---|---|---|---|
| America 1 | Asian individuals | 83.1 years | 84.0 years |
| America 2 | Latino individuals in other counties | ~ 81.0 years | ~ 83.0 years |
| America 3 | White (majority), Asian, and AIAN in other counties | ~ 77.0 years | ~ 77.2 years |
| America 4 | White individuals in non-metropolitan/low-income Northlands | ~ 76.0 years | Data Varies |
| America 5 | Latino individuals in the Southwest | ~ 76.5 years | 80.4 years |
| America 6 | Black individuals in other counties | ~ 72.0 years | Data Varies |
| America 7 | Black individuals in highly segregated metropolitan areas | 70.6 years | Data Varies |
| America 8 | White individuals in low-income Appalachia/Mississippi Valley | ~ 73.0 years | 71.8 years |
| America 9 | Black individuals in non-metropolitan/low-income South | 70.5 years | 72.5 (2019) |
| America 10 | AIAN individuals in the West | 72.3 years | 63.6 years |
Table 2: Estimated life expectancy trends across the "Ten Americas" demographic groupings, demonstrating the expansion of the longevity gap. 121315161720.
Educational and Economic Overlaps
Disparities also permeate within specific racial demographics based on regional economics. White individuals living in non-metropolitan, low-income Northlands (America 4) and those in low-income Appalachia and the Lower Mississippi Valley (America 8) face significant longevity deficits. The life expectancy gap between higher-income White groups and low-income White groups in Appalachia expanded from 2.8 years in 2000 to 5.6 years by 2021 12.
Interestingly, the data indicates that absolute income does not perfectly correlate with longevity outcomes, highlighting the nuance of social determinants. For example, America 3 (White majority, Asian, and AIAN individuals in other counties) possessed the highest income in most years and the highest proportion of high-school graduates, yet consistently ranked fourth or fifth in overall life expectancy prior to 2020 1620. Meanwhile, Latino populations generally exhibit higher average life expectancies than their income levels and educational attainment would traditionally predict - a phenomenon often termed the "Hispanic Paradox." However, this advantage is highly geographically sensitive; Latino Americans in the Southwest (America 5) have noticeably lower life expectancy (80.4 years) than Latino Americans residing in other regions (83.0 years) 17. The Ten Americas framework conclusively demonstrates that systemic marginalization, chronic underfunding of regional health services, lower educational attainment, and environmental vulnerability coalesce to shorten lifespans by decades within the borders of a single high-income nation.
Physiological Mechanisms of Social Disadvantage
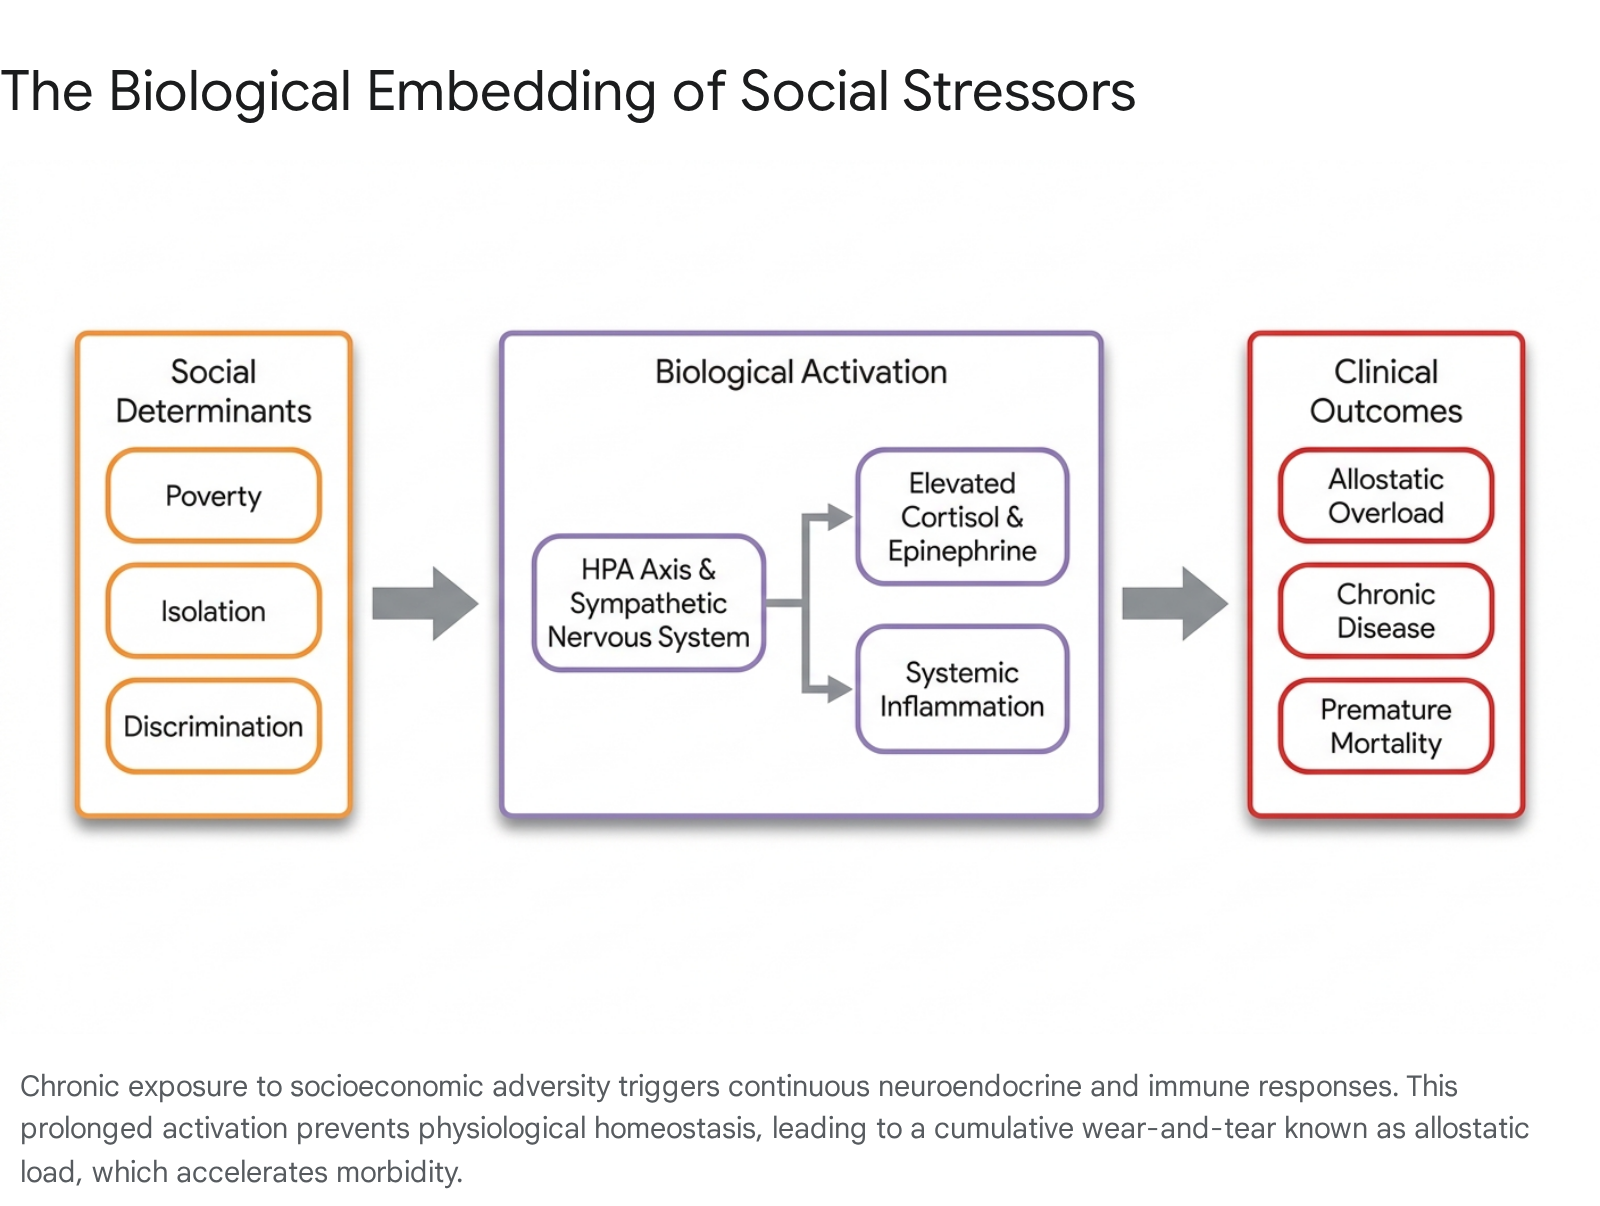
The robust epidemiological data identifying longevity disparities raises a fundamental biological question: by what physiological pathways do social disadvantages - such as poverty, racism, and lack of education - translate into cellular degradation and early mortality? The primary mechanism identified by biological and public health researchers is allostasis, measured cumulatively as allostatic load.
Allostatic Load and Biological Embedding
Allostasis refers to the body's physiological adaptation to external challenges in an attempt to regain homeostasis, involving the complex activation of the neuroendocrine, autonomic, and immune systems 2122. When an individual faces chronic, unrelenting psychosocial stressors - such as housing instability, systemic discrimination, financial insecurity, or the persistent threat of violence - the continuous activation of these systems leads to profound physiological wear and tear, termed allostatic load (AL) 212324.
The concept was pioneered to explain the poorer health outcomes experienced by marginalized groups, specifically mapping how experiences of systemic racism and poverty alter biological functioning 25.
Allostatic load is quantified through a composite index of biomarkers, which typically includes elevated resting cortisol, epinephrine, norepinephrine, systolic and diastolic blood pressure, low-density lipoprotein (LDL) cholesterol, hemoglobin A1c, and inflammatory markers such as C-reactive protein (CRP) 222426. High AL indicates severe stress-related physiological dysregulation and accelerates the development of chronic diseases, including allostatic heart failure, allostatic kidney failure, and type 2 diabetes 25. Meta-analytic reviews indicate that high allostatic load is associated with a 22% increased risk for all-cause mortality and a 31% increased risk for cardiovascular disease mortality 2427.
The accumulation of allostatic load begins early in life, demonstrating the long-term impact of childhood socioeconomic position. Longitudinal studies tracking cohorts of children demonstrate that the context of poverty - characterized by material deprivation, adult exits from the home, and poor housing quality - is uniquely associated with higher baseline levels of cortisol from infancy through early childhood 28. This physiological priming, known as biological embedding, alters brain plasticity and physiological adaptability. Adolescents and young adults exposed to early-life disadvantage experience slower cortisol recovery following cognitive-stress challenges, maintaining a state of heightened stress reactivity long after the immediate threat has passed 21. The length of time a child lives in poverty is directly associated with elevated AL during early adolescence, suggesting a severe cumulative stress effect 25.
Neighborhood Deprivation and Chronic Stress
Neighborhood environment plays a critical independent role in physiological dysregulation. Research utilizing cross-sectional data from low-to-moderate-income multiracial urban communities found that neighborhood poverty is positively associated with high allostatic load even after controlling for individual household poverty and health-related behaviors such as diet, smoking, and alcohol use 29. Low-opportunity neighborhoods expose residents to persistent economic uncertainty, threat of violence, and resource deprivation, directly causing chronic activation of the hypothalamic-pituitary-adrenal (HPA) axis 2230.
The resultant allostatic load impacts comorbidity incidence much more strongly in younger individuals residing in these areas, indicating a systemic "premature aging" effect driven by the social environment rather than chronological age 31. Systemic reviews further corroborate that neighborhood deprivation - measured by regional employment, crowding, and median income - is strictly associated with increased physiological inflammation and accelerated cognitive decline over the lifespan 30.
Social Integration and Mortality Risk
While structural inequality imposes severe biological burdens, robust social integration and psychological well-being serve as profound protective factors against mortality. The strength of an individual's social network and their internalized sense of purpose exert mortality influences that rival, and sometimes exceed, strictly clinical and behavioral factors.
The Biological Impact of Social Relationships
Human neurobiology is fundamentally calibrated to require social connection. Consequently, social isolation and loneliness register biologically as severe stressors that induce allostatic overload 22. A landmark meta-analysis encompassing 148 studies and over 308,000 participants determined that individuals with stronger social relationships have a 50% increased likelihood of survival over a given follow-up period compared to those with weak social ties (Odds Ratio = 1.50; 95% CI 1.42 to 1.59) 32. The influence of social integration on mortality is comparable to established clinical risk factors, exceeding the mortality impact of physical inactivity and obesity, and matching the mortality risk associated with smoking up to 15 cigarettes a day 323334.
When analyzed by specific dimensions of isolation, the absence of connection consistently elevates mortality risk across gender, length of follow-up, and world region. Across weighted average effect sizes, objective social isolation increases the likelihood of mortality by 29%, subjective loneliness by 26%, and living alone by 32% 34. This elevated risk operates through multiple biological pathways. Social isolation is associated with diminished antiviral protections, elevated circulating cortisol, higher blood pressure, and systemic inflammation, pushing cardiovascular systems into danger zones for stroke and heart attacks 2234. Furthermore, longitudinal data on older adults reveals that cumulative loneliness accelerates cognitive decline and dementia progression, acting as a direct neurodegenerative risk factor 22.
Conversely, complex measures of social integration - such as participation in community organizations, frequent contact with diverse social ties, and living in multi-generational households - buffer stress reactivity and mitigate allostatic overload. The association with survival is strongest for complex measures of social integration (OR = 1.91) and lowest for simple binary indicators of residential status 32.
| Social / Lifestyle Factor | Description | Hazard Ratio (HR) / Impact on Mortality |
|---|---|---|
| High Social Integration | Complex measures of strong social networks. | ~ 50% increased likelihood of survival (OR 1.50) |
| Social Isolation | Objective lack of social contact. | 29% increased likelihood of mortality |
| Subjective Loneliness | Perceived lack of meaningful connection. | 26% increased likelihood of mortality |
| Living Alone | Binary residential status. | 32% increased likelihood of mortality |
| Sense of Purpose | Highest vs. Lowest quartile of life purpose. | HR ~ 2.43 (Higher risk for lowest purpose group) |
Table 3: Summary of mortality hazard ratios and odds ratios associated with various psychosocial factors. 323434.
Psychological Well-Being and Sense of Purpose
Closely linked to social integration is the psychological construct of "purpose in life," defined as the extent to which an individual perceives a sense of direction, meaning, and goal-oriented focus 35. Widely studied under cultural frameworks such as ikigai in Japan or plan de vida in Costa Rica, a measurable sense of purpose acts as a biological shield against premature mortality 343637.
Prospective cohort studies, including exhaustive data from the U.S. Health and Retirement Study (HRS), demonstrate a steep, dose-dependent relationship between life purpose and survival. In a cohort of 6,985 adults over age 50, those ranking in the lowest category for life purpose exhibited a hazard ratio (HR) of 2.43 for all-cause mortality compared to those in the highest category 34. Over an eight-year observation period, individuals with the lowest sense of purpose faced a 36.5% absolute mortality risk, compared to just 15.2% for those with the highest sense of purpose 35.
This protective effect remains statistically significant after rigorous adjustments for socio-demographic status, baseline physical health, depressive symptoms, and the presence of chronic health conditions 3438. A meta-analysis of ten prospective studies involving over 136,000 participants confirmed that a high sense of purpose is associated with a significantly reduced risk of all-cause mortality (adjusted pooled relative risk = 0.83) and a corresponding reduction in cardiovascular events 39. The mechanisms underlying this correlation suggest that individuals with high purpose engage in better proactive health behaviors, exhibit higher resilience to psychosocial stressors, and maintain lower allostatic load profiles 4041.
Geographic Longevity Hotspots and Demographic Debates
The intersection of structural resources, social integration, and physical health environments is most visibly studied in geographic regions historically recognized for exceptional longevity. However, the data surrounding these outlier regions is currently the subject of intense methodological debate within the field of demography.
The Blue Zones Concept
The "Blue Zones" concept, popularized in the early 2000s, identified five geographic regions containing demographically confirmed high concentrations of centenarians and supercentenarians: Okinawa (Japan), Sardinia (Italy), the Nicoya Peninsula (Costa Rica), Ikaria (Greece), and Loma Linda (California, USA) 3642. Epidemiologists studying these regions identified a shared lifestyle framework, often referred to as the "Power 9," which includes natural daily physical movement, a predominantly plant-based diet, caloric restriction, strong faith-based or community integration, multi-generational living arrangements, and a pervasive cultural sense of purpose 3637.
In theory, the Blue Zones represent the optimal application of the social determinants of health, where the built environment and cultural norms passively push individuals into healthy behaviors and alleviate psychosocial stress without requiring high individual agency or immense financial resources 3637.
Critiques of Demographic Validity
Despite the widespread public health adoption of the Blue Zones framework, demographic researchers have increasingly scrutinized the validity of the underlying age data. Recent investigations suggest that patterns of extreme longevity in several of these zones may be heavily influenced by administrative errors, missing vital registries, and pension fraud rather than biological or lifestyle supremacy 424344.
A prominent pre-print study, which received the 2024 Ig Nobel Prize in Demography, analyzed United Nations mortality statistics alongside regional data and posited that supercentenarian status is predominantly predicted by a region's lack of reliable birth certificates, high rates of crime, and old-age poverty 424445. The critique highlights severe data anomalies; for instance, in the United States, the introduction of standardized state-level birth certificates correlated with a 69% to 82% drop in the number of supercentenarian records 45. In parts of Italy and Greece, government investigations revealed that significant percentages of individuals claiming pensions at ages over 100 were actually deceased, their records kept active by relatives to collect economic benefits 4243. Furthermore, statistical anomalies, such as an improbable concentration of birthdates divisible by five among supercentenarians, point toward age rounding and clerical estimation rather than verified birth records 4345.
The critique extends to the specific health claims within the zones. Contemporary data from the Japanese government indicates that modern Okinawans have the highest body mass index and the lowest vegetable consumption in Japan, contradicting the contemporary narrative of the Okinawan longevity diet 4446.
Rebuttals and Continued Relevance
These critiques are strongly contested by the original Blue Zone demographers and affiliated gerontologists. Rebuttals published in peer-reviewed journals, such as The Gerontologist in 2025, argue that the original regions were validated using the highest standards of modern demography, relying on rigorous cross-checking of baptismal, military, and civil records dating back more than a century to eliminate self-reporting biases 474950. Proponents of the longevity data acknowledge that while modern lifestyle shifts (such as the introduction of Western diets and urbanization) are currently degrading the life expectancy in areas like Okinawa and Nicoya, the historical survival data of the cohorts born in the late 19th and early 20th centuries remains statistically robust and medically valid 4750.
While the exact number of verified supercentenarians in these specific zones may be contested by varying demographic models, the broader epidemiological consensus remains unchanged: environments that foster social connection, promote physical activity, and reduce chronic stress are fundamentally linked to improved population healthspan, even if extreme old-age records are occasionally subject to clerical error.
Structural Interventions and Macroeconomic Policy
Addressing the social determinants of longevity requires interventions that move beyond advising individual behavioral changes and focus on reforming the structural environments in which individuals live and age. Public health frameworks consistently demonstrate that interventions requiring high individual agency - such as educational campaigns on diet, gym memberships, or specialized telehealth programs - often exacerbate health inequities because they are most easily adopted by highly educated, higher-income populations 4849. Conversely, macro-level structural policies that reduce baseline inequality yield the most significant, consistent, and equitable improvements in population longevity.
Welfare and Economic Redistribution
Redistributive economic policies serve as direct, population-level health interventions. Historical evidence illustrates that robust social security safety nets, equitable tax policies, and universal health coverage rapidly compress health disparities. During the expansion of the welfare state in Nordic countries in the mid-20th century, the implementation of the Civil Rights Act and the War on Poverty in the 1960s United States, and the English health inequalities strategy in the 2000s, nations saw marked reductions in premature mortality gaps across racial and income strata 5051. In England, the introduction of the national minimum wage and area-based health interventions significantly reduced inequalities in infant mortality and premature death 50.
Modern systemic reviews of structural interventions identify income supplementation as highly effective. Programs such as the Earned Income Tax Credit (EITC) in the United States operate as disease-agnostic health interventions. By lifting low-income working families out of poverty, such fiscal policies reduce allostatic load, directly resulting in better maternal health outcomes, higher birth weights, and improved long-term developmental trajectories for children 49. Economic modeling estimates that the cost of inaction is staggering; treating illnesses generated by health inequalities drains billions from national economies in additional healthcare expenditures, higher welfare payments, and lost labor productivity 51.
Community and Built Environment Development
Because lifespan inequality is highly localized, structural interventions must also target the physical and social infrastructure of communities. Multicomponent housing support initiatives, tenant-based voucher programs, and investments in neighborhood amenities have demonstrated robust success in reducing housing instability 48. By providing secure environments, these policies directly alleviate the psychosocial stress that drives allostatic overload, resulting in observable reductions in morbidity and early cardiometabolic benefits in targeted populations 3048.
Furthermore, modifying the built environment to facilitate natural physical activity and social integration shows profound promise in extending healthspan. Policies that restrict access to harmful goods while subsidizing access to healthy foods, alongside urban planning that prioritizes safe communal spaces, foster an "inclusive economy" 52. These community-level adaptations build systemic resilience against the physiological degradation caused by social isolation and physical inactivity, embedding longevity into the environment rather than relying solely on clinical intervention.
Conclusion
The pursuit of human longevity is not solely a biomedical endeavor but a profoundly social challenge. Exhaustive demographic and physiological evidence confirms that social determinants - chiefly socioeconomic inequality, exposure to chronic stress, and the quality of social integration - dictate both the length and quality of human life. The biological embedding of poverty and discrimination accelerates aging through the accumulation of allostatic load, resulting in stark life expectancy gaps, such as the two-decade disparity currently observed across marginalized and affluent groups in the United States. Conversely, deep social relationships and a sustained sense of purpose act as powerful physiological buffers, reducing mortality risk to a degree comparable to major clinical interventions.
To halve premature death rates and ensure equitable longevity gains globally, public policy must shift its focus from individual behavioral modification to structural economic reform. Sustained improvements in population lifespan will require policies that dismantle the environmental stressors driving allostatic load, enhance community infrastructure to foster social connection, and aggressively target the systemic inequalities that currently determine who lives a long life, and who does not.