Seed Stage Venture Capital Fundraising Data and Requirements for 2026
The venture capital ecosystem in 2026 operates under a fundamentally restructured set of economic principles compared to the peak cycles of the early 2020s. A pronounced bifurcation defines the market, driven heavily by unprecedented capital concentration in artificial intelligence and a sustained liquidity crunch that has forced investors to adopt rigorous, milestone-driven evaluation criteria. For early-stage founders, the definition of a "seed round" has shifted dramatically. What was once a phase for prototyping and market exploration now functions with the stringency and capital requirements historically associated with Series A financings. This report synthesizes quantitative data and market behavior from 2025 and early 2026 to provide an exhaustive analysis of seed-stage fundraising dynamics, valuation benchmarks, deal structuring, traction requirements, investor funnel metrics, and regional macroeconomic variances.
Macroeconomic Environment and Market Concentration
The venture capital landscape in the first half of 2026 is characterized by extraordinary top-line figures that mask underlying ecosystem constraints. First-quarter data from 2026 indicates that the US market reached $267.2 billion in quarterly deal value, a figure that tops all full-year totals except for 2021 and 2025 12. However, this aggregate volume does not reflect a broad-based recovery in startup funding. Rather, it indicates a market that has concentrated capital into a highly restricted pipeline of proven or exceptionally well-pedigreed companies.
The market has become acutely top-heavy. In the first quarter of 2026, just five deals accounted for 73% of the total $267 billion deal value 3. Similarly, on the capital supply side, five venture capital firms accounted for 73.1% of the total fundraising for the quarter, as limited partners (LPs) increasingly allocated capital to established, name-brand managers while emerging managers faced severe capital deficits 13. If the five largest deals and exits of the quarter are excluded, aggregate deal value and exit value fall by 73.2% and 86.6%, respectively 12.
This macroeconomic backdrop is further complicated by geopolitical friction and public market volatility. Ongoing conflicts in the Middle East and the implementation of aggressive international tariff policies have clouded supply chain forecasts and delayed public listings 14. While IPOs from generational companies like SpaceX, OpenAI, and Anthropic are projected to generate nearly $2.5 trillion in exit value, the broader venture market remains highly illiquid 2. Until the IPO window opens consistently for standard enterprise and consumer technology firms, the "Series A crunch" will continue to push capital requirements and developmental burdens down into the seed stage 56.
The Upward Migration of the Seed Stage
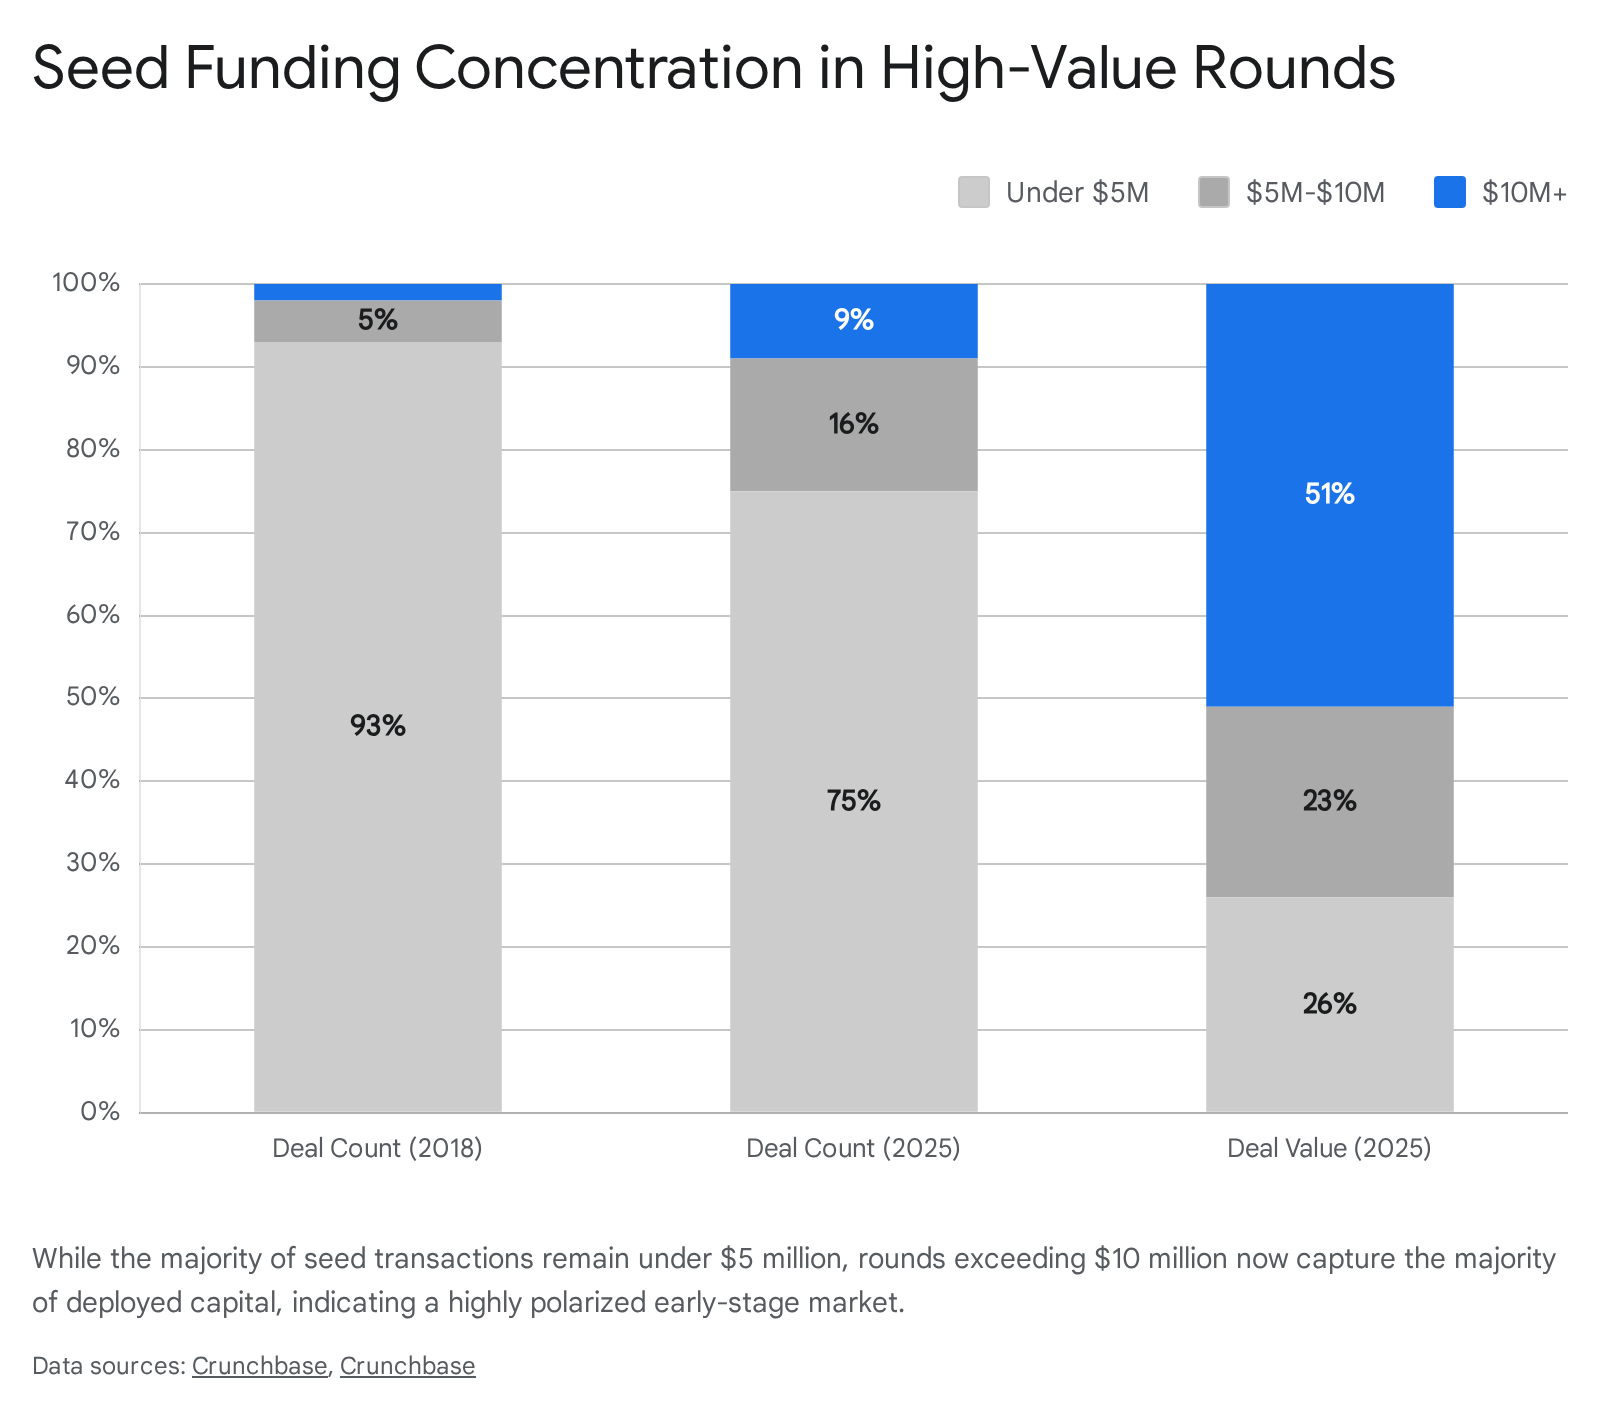
The parameters defining a seed round have inflated significantly over the past five years. In 2026, the working definition of a standard US seed round sits between $1 million and $5 million, with the median round resting between $3.1 million and $4 million 7. Seed deal volume for rounds under $5 million has trended downward, falling from 93% of all seed deals in 2018 to just 75% by the end of 2025 8.
Concurrently, "mega-seed" rounds of $10 million or more have increased significantly, constituting over half of all seed dollars deployed in the US despite representing a fraction of the total deal count 9.
The mathematical average of a seed round in the US has skewed upward to approximately $5.6 million, though this figure is heavily distorted by multi-billion-dollar outliers in the artificial intelligence sector, such as the $2 billion seed round secured by Mira Murati's Thinking Machines Lab 710. Medians remain the only reliable metric for standard enterprise forecasting.
This upward migration of capital requirements is driven by the rising costs of talent, hardware, and infrastructure, particularly the compute resources required for large language model (LLM) development 1112. Investors are exhibiting a strategic preference to concentrate larger checks on fewer, high-conviction teams 12. As a result, the time between funding rounds has stretched considerably, with the average gap between seed and Series A funding now exceeding 616 days 13. The operational milestones expected at the seed stage in 2026 - demonstrable revenue, distinct unit economics, and scalable acquisition channels - closely mirror the demands placed on Series A companies just half a decade ago 79.
Valuation Benchmarks and Dilution Mechanics
Early-stage valuations have experienced a sustained upward trajectory. By the fourth quarter of 2025, the median post-money valuation for primary seed rounds on the Carta platform reached an all-time high of $24 million 12. This represents a significant escalation, up from $18 million in 2024 and $16 million in 2023 12. This inflation extends to the Series A stage, where median post-money valuations rocketed to $78.7 million in Q4 2025, a 37% year-over-year increase 12.
These soaring valuations are not purely a function of market exuberance; they are deeply tied to fixed dilution mechanics. While valuations and round sizes have climbed, founder equity dilution has remained remarkably stable. Venture capitalists maintain strict ownership targets regardless of the rising nominal price of the equity. Across all sectors, median dilution at the seed stage consistently falls between 15% and 20%, continuing a years-long trend anchored near historical industry standards 7111213.
By the time a startup successfully closes a seed round, the median founding team retains approximately 56% of their fully diluted equity 14. By the time the company raises a Series A, median founder ownership declines to 36% 14. The mathematical consequence of rising round sizes (e.g., standardizing on $4 million rather than $1.5 million) paired with fixed dilution percentages (20%) is the primary mathematical driver pushing the nominal valuations of early-stage companies to record highs 12. It is also notable that equity distributions shift dramatically as companies scale; by Series C, the median employee equity pool (16.8%) typically overtakes median founder ownership (16.1%) 14.
Sector-Specific Valuation Benchmarks
The aggregate median of $24 million obscures substantial sector-specific variations. The venture market applies a steep premium to artificial intelligence and deep technology, skewing the overall market averages. To accurately gauge market expectations, founders must benchmark their capital strategy against sector-specific data.
Artificial intelligence startups command a distinct valuation premium. Data from late 2025 and early 2026 indicates that AI companies price approximately 42% higher than their non-AI peers at the seed stage 15. AI startups often see median pre-money valuations approach $17.9 million, driven by the intense competition among venture firms to secure allocations in foundational models and agentic workflows 15. Conversely, traditional Software as a Service (SaaS) and consumer applications require substantially more commercial traction to justify similar valuations.
| Industry Sector | Median Seed Round Size (2026) | Valuation Dynamics and Market Context |
|---|---|---|
| Artificial Intelligence & ML | $4.6M - $5.0M | Commands a 42% valuation premium. Market is highly bifurcated with billion-dollar outliers skewing mathematical averages. Investors prioritize technical defensibility over early revenue. 715 |
| Healthcare & Biotechnology | $4.0M - $5.0M | High capital requirements for IND-enabling studies. Valuations are heavily tied to intellectual property protection and the achievement of specific clinical milestones. 716 |
| Cybersecurity | $3.0M - $4.0M | Steady investment driven by AI-powered threat vectors and required enterprise security upgrades. Considered a highly defensible category of IT spend. 717 |
| Fintech | $3.2M | Remains dominant in emerging markets (e.g., Latin America, APAC) but faces a saturated and mature competitive landscape within the US market. 71819 |
| B2B SaaS (Traditional) | $2.5M - $3.2M | Subject to tighter valuation multiples. Investors demand strict revenue traction, high retention, and efficient unit economics to offset the lack of an AI premium. 7 |
| Consumer Applications | $1.5M - $2.5M | Represents the most challenging fundraising environment. Requires evidence of extreme organic growth loops, viral acquisition, and high daily active user (DAU) engagement. 721 |
Deal Structuring and Instrument Selection
The choice of financial instrument at the seed stage carries profound implications for capitalization table management and future founder ownership. In the US market, the Simple Agreement for Future Equity (SAFE) has become the dominant instrument for early-stage capital formation, but its utility diminishes rapidly as round sizes scale.
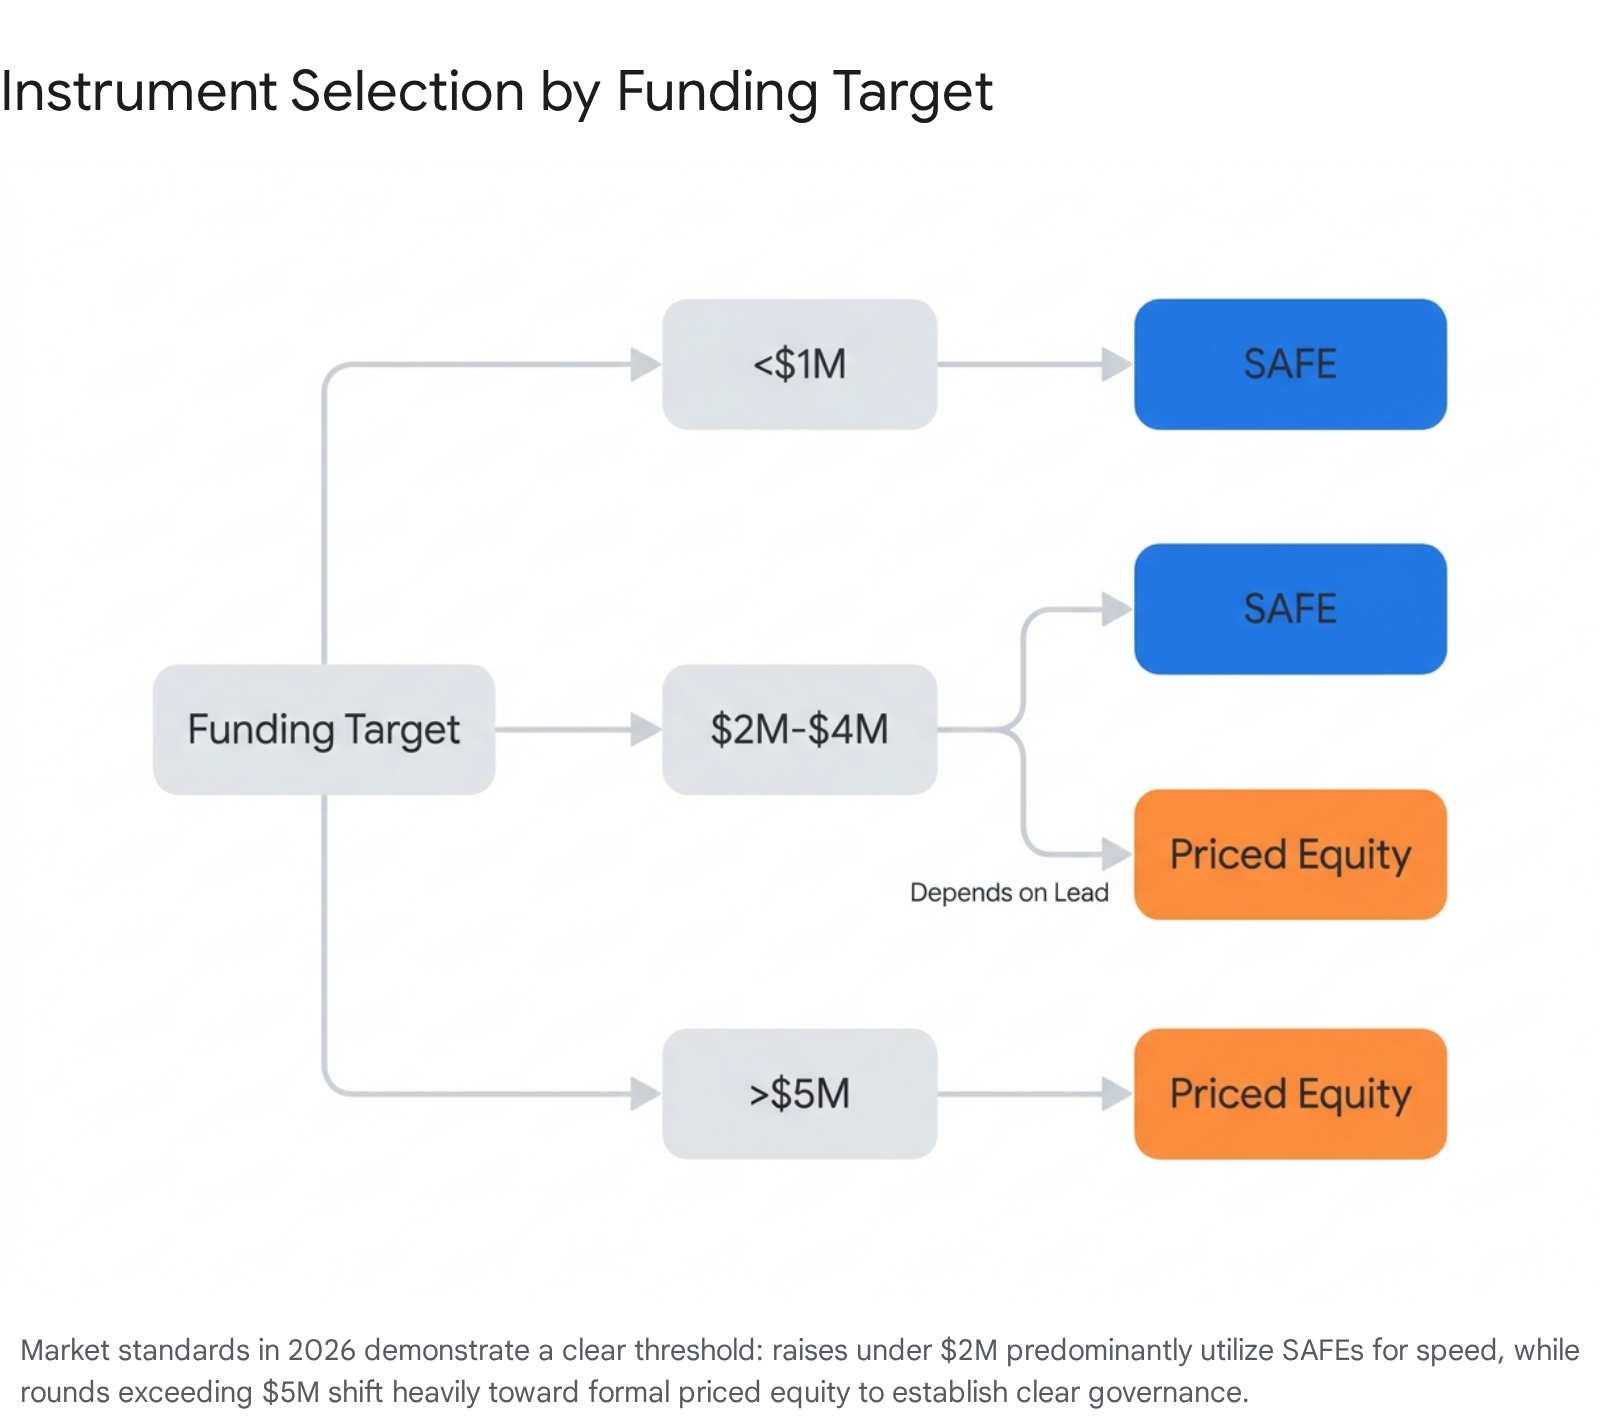
According to 2025 capital market data, SAFEs were utilized in approximately 90% of pre-seed rounds and 64% of seed rounds 2021. The standard Y Combinator post-money SAFE remains the default due to its execution speed and low legal overhead. However, a distinct structural threshold exists: once a seed round exceeds $4 million to $5 million, priced equity becomes the market standard. Over 70% of seed deals above the $5 million mark are structured as formal priced equity financings 2022.
The Mechanics of Dilution Stacking
The reliance on post-money SAFEs has introduced a phenomenon known as "dilution stacking," which frequently blindsides founders during their Series A priced round. Because post-money SAFEs lock in investor ownership percentages based on the valuation cap - explicitly including the SAFE investment itself - raising multiple SAFEs at different caps cumulatively subtracts from the founders' equity pool at conversion 2022.
For example, a founder who raises $4 million across two separate post-money SAFEs (e.g., two $2 million tranches capped at $8 million) may inadvertently sell over 40% of their company before ever reaching Series A 22. In the 2026 environment, where early-stage fundraising cycles average nearly two years, founders are increasingly tempted to bridge funding gaps by "stacking" convertible instruments. Investors at the Series A stage are scrutinizing fragmented cap tables closely, as excessive early dilution leaves founders with less than 35% ownership, misaligning incentives for the arduous decade of scaling ahead 2122.
The prevailing strategy in 2026 dictates that founders raising less than $1 million should default to a SAFE, while those raising above $3 million - particularly with institutional leads - should strongly consider a priced round 20. While priced rounds involve extensive legal due diligence and fees ranging from $40,000 to $120,000, they provide absolute clarity on dilution, establish formal board governance, and generate stronger alignment with lead investors 2122.
Traction Requirements and Operational Metrics
The era of raising institutional seed capital strictly on a theoretical pitch deck and an unvalidated prototype has largely ended, persisting exclusively for repeat founders with prior exits or exceptional technical teams building frontier AI models 723. For the vast majority of startups, seed investors in 2026 require demonstrable traction, extreme capital efficiency, and a clear, empirically backed path to scalable unit economics.
B2B Software and Enterprise Metrics
For traditional and non-AI enterprise software, the traction hurdle is exceptionally high. Because these companies do not benefit from the AI valuation premium, seed investors are treating these rounds with the forensic scrutiny previously reserved for Series A. Revenue generation is no longer optional; it is the baseline requirement for institutional engagement 23.
| Operational Metric | 2026 Seed Stage Expectation | Strategic Implications |
|---|---|---|
| Annual Recurring Revenue (ARR) | $300,000 - $500,000+ | Represents the absolute floor for institutional seed funding in non-AI SaaS. Stronger rounds frequently require $500,000 to $1.5 million in ARR to justify a $20M+ valuation cap. 71324 |
| Customer Validation | 10 - 20 Paying Business Customers | Free pilots, unpaid letters of intent (LOIs), and beta waitlists carry little weight. Investors demand converted, paying contracts to validate genuine market demand. 2425 |
| Unit Economics (CAC Payback) | Under 12 Months | Startups must prove that the cost to acquire a customer is recovered within a single year. Gross margins must track above 60%. 1324 |
| Engagement and Retention | Under 8% - 10% Monthly Churn | High retention proves the minimum viable product (MVP) solves an urgent pain point. Investors prioritize usage depth over raw sign-up breadth. 212324 |
Artificial Intelligence Requirements
The expectations for AI startups differ significantly due to the market's current momentum, but investor sophistication has matured rapidly since 2023. Simple application-layer wrappers utilizing off-the-shelf APIs face near-universal rejection 23. With over 40% of startup pitches now leading with AI as a core differentiator, the technology is viewed as table stakes rather than a unique moat 23.
Investors demand to know how the AI creates structural, compounding defensibility. This involves evaluating whether the product features proprietary data feedback loops or fine-tuned models that improve autonomously with usage 23. Furthermore, while early revenue is preferred, deep user engagement often serves as a proxy for product-market fit in this sector. Weekly active usage and high retention rates (above 40% week-over-week) signal a strong enterprise reliance on the workflow 23. Finally, AI is inherently capital-intensive due to extreme compute and inference costs. Founders must clearly articulate their infrastructure spending, demonstrating that gross margins will not be permanently suppressed by third-party API dependencies as the company scales 1112.
Biotechnology and Deep Technology Validation
Valuations and funding availability in biotechnology and hardware are disconnected from traditional revenue metrics, relying entirely on scientific de-risking and complex regulatory milestones. The biotech market faced a severe "Series A crunch" between 2023 and 2024, resulting in venture capitalists demanding significantly more robust data sets prior to funding any early-stage life sciences venture 6.
| Development Metric | 2026 Seed Stage Expectation | Strategic Implications |
|---|---|---|
| Scientific Validation | Preclinical Proof of Concept | Seed capital ($1M - $5M) is strictly allocated for target validation, lead compound identification, and definitive proof-of-concept studies. 616 |
| Regulatory Trajectory | IND-Enabling Studies Initiated | In prior cycles, preclinical data was sufficient for Series A. By 2026, Series A investors frequently require Investigational New Drug (IND)-ready data, pushing heavier clinical burdens directly into the seed phase. 616 |
| Intellectual Property | Defensible Freedom to Operate | Investors must have absolute confidence that the core assets are legally protected and that the company can operate without infringing on incumbent pharmaceutical patents. 26 |
| Team Composition | Proven Scientific Leadership | In deep tech and biotech, capital follows leadership. Institutional investors rarely back unproven scientific teams lacking prior regulatory or commercialization experience. 1626 |
The Fundraising Funnel and Investor Engagement
Startup fundraising in 2026 is a high-attrition numbers game. Analyzing conversion metrics across the funding funnel reveals the sheer volume of investor interactions required to secure a lead term sheet. Founders who successfully raise capital run highly disciplined, data-driven processes, treating fundraising as an enterprise sales campaign rather than a networking exercise 27.
Industry data outlines a harsh funnel for founders. The ultimate conversion rate from an initial investor meeting to a finalized check averages between 5% and 10% 28. Therefore, to secure a syndicate of 2 to 5 committed investors, a founder must typically initiate targeted contact with a pipeline of 100 to 200 qualified funds and angels 2829.
| Fundraising Funnel Stage | Average Conversion Rate | Strategic Context and Attrition Factors |
|---|---|---|
| Cold Outreach to First Meeting | 1% - 5% | Cold emails are highly inefficient. Unless targeting is exceptionally precise (matching sector, stage, and geography), rejection is the default. 2830 |
| Warm Introduction to First Meeting | 30% - 50% | Network introductions remain paramount. A trusted referral instantly lends credibility and bypasses initial associate-level screens. 2830 |
| First Meeting to Second Meeting | 40% - 60% | An initial screen for market size, founder credibility, and mandate fit. Roughly half of interested investors will pass at this stage due to portfolio conflicts or thesis misalignment. 28 |
| Second Meeting to Due Diligence | 30% - 50% | Requires a deep-dive into financial models, virtual data rooms, and technical architecture. Significant drop-off occurs as growth assumptions are stress-tested. 28 |
| Due Diligence to Term Sheet | 20% - 40% | Deals frequently collapse late in the process due to negative reference calls, adverse market analysis, or internal partner debates regarding valuation. 28 |
| Term Sheet to Close | 80% - 95% | Highly probable. Deals at this stage generally only fail upon the discovery of material adverse findings during final legal and background diligence. 28 |
Pitch Deck Analytics and Investor Psychology
Data aggregated from document-sharing platforms like DocSend reveals exactly how venture capitalists interact with pitch materials in 2026. The average time an investor spends reading a seed-stage pitch deck has compressed steadily, dropping 24% from 2021 levels to an average of just 2 minutes and 24 seconds 31. The source of the introduction heavily influences this attention span: cold outreach decks receive an average of only 2 minutes and 31 seconds of review, while decks shared via warm introductions command 4 minutes and 18 seconds 31.
The structural flow of the presentation is critical for surviving this rapid screening. Analytical data indicates that the first three slides act as a hard filter; if an investor passes the third slide, there is an 82% probability they will complete the entire deck 31. Consequently, founders must immediately establish the severity of the problem, the elegance of the solution, and early traction markers within the first 60 seconds of reading. The optimal length for the core narrative is between 10 and 12 slides, with any highly technical data or complex financial projections relegated to an appendix 31.
Furthermore, behavioral analytics highlight a distinct shift in investor priorities since the 2022 market correction. Investors in 2026 spend significantly more time scrutinizing the "Business Model," "Traction," and "Competition" slides, prioritizing paths to profitability and capital efficiency over pure top-line market expansion 31. Successful decks also prominently feature a "Why Now?" slide - which has seen a 65% increase in investor viewing time - justifying the timing of the market entry against macroeconomic headwinds 31.
Regional Ecosystem Variances
While global venture capital dynamics share common themes of extreme concentration and tightened due diligence, regional ecosystems operate with distinct economic cadences, regulatory frameworks, and capital structures.
The United States
The US remains the global epicenter for venture capital, but domestic activity is highly regionalized. The San Francisco Bay Area continues to capture roughly one-third of all US seed funding deals, functioning as the primary hub for capital-intensive AI development 9. Access to capital in the US is heavily network-dependent; founders located in major hubs (Bay Area, New York) or possessing pedigree from established technology firms experience a structurally different fundraising environment than founders outside these networks 9. Notably, the Northeast region has gained significant ground, capturing 33.1% of all cash raised on the Carta platform during Q4 2025, marking its largest market share in three years 11.
Furthermore, the US has developed a highly liquid secondary market. Annualized direct secondary value reached $97.6 billion in early 2026, heavily concentrated in mega-cap private entities like SpaceX and OpenAI 32. While this provides a critical release valve for employee and early-investor liquidity, it primarily benefits later-stage companies rather than the seed ecosystem 32.
Europe
European venture capital has stabilized following a massive surge and subsequent contraction. Total VC investment peaked at $112.2 billion in 2021 before correcting to a sustainable baseline of approximately $64.6 billion in 2025 33. Early-stage funding in Europe remains relatively resilient, supported by strong national sovereign funds and mature ecosystems in the UK, France, and Germany 33.
In Central and Eastern Europe (CEE), the ecosystem has grown consistently, reaching a combined enterprise valuation of €243 billion by early 2026 34. However, the region faces a pronounced "scaleup paradox." While early-stage rounds (Pre-seed, Seed, Series A) successfully captured €764 million in 2024, the region lacks deep pools of late-stage capital 34. Consequently, nearly half (48%) of all CEE scaleups relocate their headquarters to access growth equity, with 56% of those migrating to the US and 24% to the UK 34. Enterprise software, AI, and fintech continue to dominate the CEE investment landscape 34.
Asia-Pacific (APAC)
The APAC venture market is projected to reach $296.78 billion in 2026, exhibiting highly divergent trends across its sub-regions 18.
India has emerged as the primary growth engine for the continent. In 2025, Indian PE/VC investments reached $60.7 billion across 1,475 deals - the second-highest deployment on record in value terms and a 9% year-over-year increase in volume 35. Startups accounted for 767 of these deals, reflecting a robust, highly active early-stage environment 35. Investors in India are particularly active in fintech, enterprise SaaS, and consumer goods 18.
Conversely, Southeast Asia is experiencing a severe, multiyear contraction. Total deal value in the region fell by nearly 34% in 2025 to $6.3 billion 36. The region suffers from deep structural weaknesses, including limited domestic institutional participation and a significant pullback from non-domestic LPs 36. Consequently, capital is concentrating in mature, proven companies, pushing the median VC deal value up from $2.7 million to $4.0 million as investors abandon experimental, early-stage bets in favor of survivability 36. Meanwhile, in China, venture activity showed signs of cautious stabilization in early 2026, driven almost entirely by state-supported and corporate capital clustering around strategic sectors like AI, advanced robotics, and semiconductor manufacturing 37.
Latin America (LatAm)
Latin America recorded $4.12 billion in venture capital investment in 2025, marking a 13.8% year-over-year recovery from the $3.62 billion deployed in 2024 1938. However, this recovery was not defined by volume; the total number of funding rounds fell slightly to 681, the lowest deal count since 2017 19.
Instead, LatAm directly mirrors the global trend of capital concentration. The average ticket per deal increased by 16%, from $5.2 million to $6.1 million 1938. Fintech utterly dominates the region, capturing 61% of total funding despite accounting for only 29% of the deals, indicating that financial infrastructure commands the largest capital allocations 1941. Brazil and Mexico collectively represent 78.5% of the capital deployed 38. Notably, early 2026 data showed Mexico briefly outpacing Brazil in venture dollars raised - driven by massive late-stage logistics and fintech rounds like Kavak's $300 million Series F - though Brazil maintains the broadest overall ecosystem 3943. Crucially, the region saw a massive surge in liquidity, with venture-backed startup exits reaching $4.9 billion in 2025 (a 172% increase), proving that the ecosystem can deliver massive returns through M&A and secondary markets 1938.
Strategic Implications for Founders
The data aggregated across 2025 and 2026 points to a venture environment that, while historically flush with capital, is highly uncompromising in its deployment. The shift from a growth-at-all-costs mandate to a focus on sustainable unit economics requires a fundamental recalibration of early-stage fundraising strategies.
First, founders face severe stage misalignment risks. Seed funding has structurally shifted into the territory previously occupied by Series A. Requesting $3 million to "find product-market fit" is no longer a viable pitch in most sectors outside of deeply technical AI or biotechnology. Founders must increasingly utilize pre-seed capital, rigorous bootstrapping, or accelerator programs to generate baseline revenue ($300,000+ ARR) and validate user retention before attempting to engage institutional seed investors 713.
Second, cap table management is critical. The speed and convenience of the post-money SAFE must be aggressively balanced against the mathematical reality of dilution stacking. Founders raising cumulative amounts near or above $3 million should transition to formal priced equity rounds to maintain control of their capitalization table prior to Series A, ensuring they do not inadvertently dilute themselves out of controlling stakes 2022.
Finally, narrative discipline is paramount. Pitch decks must be engineered for extreme brevity and economic clarity. With review times dropping below two and a half minutes, the narrative must immediately establish the severity of the problem, the technical defensibility of the solution, and the exact unit economics within the first three slides 31. Successfully raising a seed round in 2026 requires founders to operate with the financial discipline of a late-stage enterprise while maintaining the agile execution of an early-stage startup. Capital remains abundant for those who can empirically prove their market demand, but highly inaccessible for those relying solely on unvalidated vision.