Science of Customer Retention and Churn Reduction
The global transition toward recurring revenue architectures has fundamentally rewired the economic foundations of modern commerce. Whether operating in business-to-business (B2B) Software-as-a-Service (SaaS), direct-to-consumer (DTC) physical goods, or consumer packaged goods (CPG) subscriptions, organizations are discovering that the traditional top-of-funnel customer acquisition focus is increasingly unsustainable. Driven by heightened market saturation and digital competition, customer acquisition costs (CAC) have surged by over 222% since 2013, rendering the acquisition of a new customer five to twenty-five times more expensive than retaining an existing one 12. Every year, businesses lose approximately $1.6 trillion to customer churn, with the average lost customer carrying a financial burden of $243 when factoring in acquisition costs and diminished lifetime value 1.
Consequently, the commercial imperative has shifted definitively toward the lifecycle phase following the initial transaction. Institutional research from Bain & Company and Harvard Business School demonstrates that a mere five percent increase in customer retention can boost overall profitability by twenty-five to ninety-five percent 145. This comprehensive report examines the contemporary science of customer retention and churn. By synthesizing recent academic research in behavioral economics, analyzing institutional data from firms such as McKinsey & Company and Gartner, and exploring late-breaking developments in artificial intelligence (AI) and machine learning (ML), this analysis provides an exhaustive framework for understanding why customers depart and how organizations can proactively intervene.
Deconstructing the "All Churn is Bad" Fallacy
To scientifically manage customer attrition, it is first necessary to dismantle the pervasive industry misconception that all churn is inherently detrimental to organizational health and enterprise valuation. While broad market analysis frequently frames any customer departure as a failure of product-market fit or customer success, advanced retention science requires a significantly more nuanced segmentation of customer loss. Predictive churn analysis and cohort profitability studies indicate that certain typologies of churn are, in fact, strategically beneficial to long-term corporate viability 1.
Organizations that indiscriminately optimize for absolute, zero-percent churn often fall victim to severe resource misallocation, expending disproportionate high-value customer success and technical support resources on low-value or structurally unprofitable segments. This phenomenon of "good churn" typically manifests through unprofitable consumers whose underlying cost-to-serve substantially exceeds their projected Customer Lifetime Value (CLV). In industries characterized by intensive support requirements or heavy onboarding friction, retaining these customers actively depresses gross margins 1.
Furthermore, aggressive acquisition strategies - such as heavy discounting or misaligned affiliate marketing - frequently attract misaligned personas who do not naturally fit the product's core value proposition 2. The continued presence of these users often skews product development roadmaps, generating feature requests that distract engineering teams from serving the core, high-value market. Allowing these specific segments to organically churn out of the ecosystem enables organizations to aggressively reallocate resources toward high-value, high-expansion accounts 1. Consequently, mature financial planning and analysis (FP&A) teams now focus heavily on revenue churn rather than mere logo churn, recognizing that the attrition of twenty low-tier accounts may be statistically and financially irrelevant compared to the contraction of a single enterprise agreement 7.
The Measurement Paradox: Reevaluating NPS, CES, and CSAT
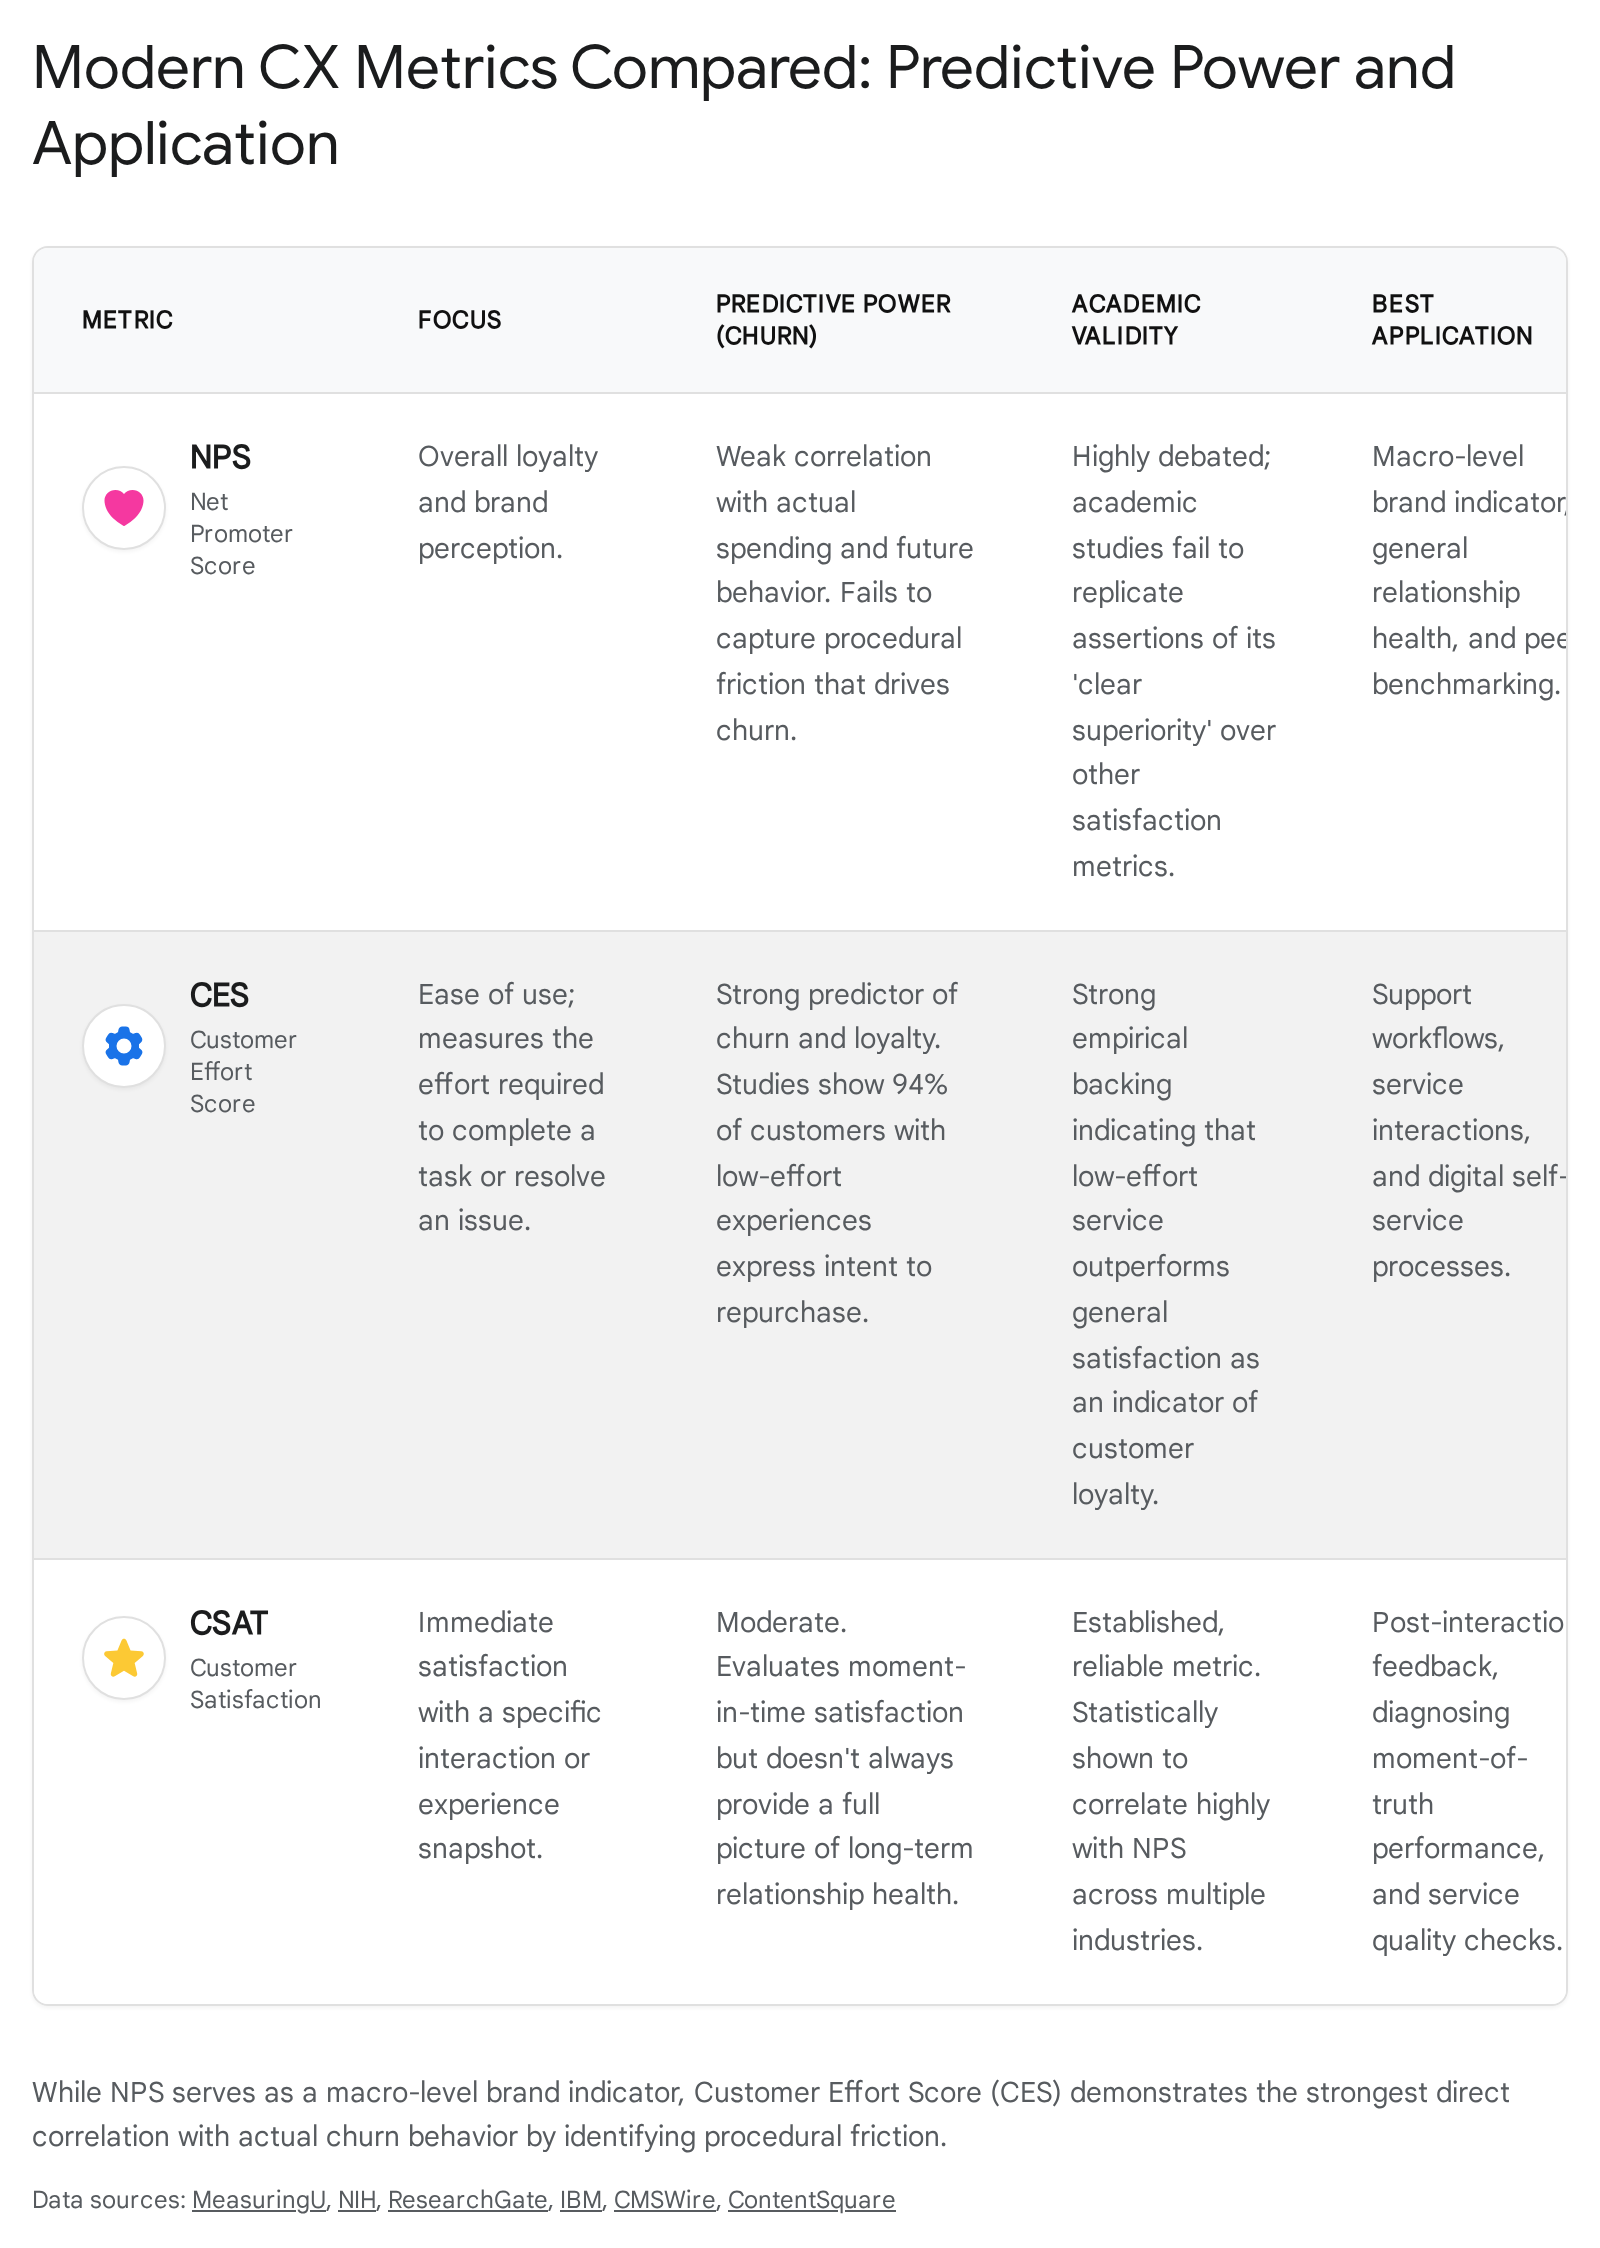
The foundation of any sophisticated retention strategy is the metric framework utilized to measure customer sentiment. For two decades, the Net Promoter Score (NPS) has dominated executive dashboards. However, contemporary academic literature and institutional analysis reveal significant empirical blind spots in traditional scoring mechanisms, necessitating a broader integration of the Customer Effort Score (CES) and Customer Satisfaction (CSAT) indices.
Introduced in 2003 and originally touted in the Harvard Business Review as the "one number you need to grow," NPS categorizes users into Promoters, Passives, and Detractors based on a singular question regarding their likelihood to recommend a product or service 34. While undeniably popular and still cited in hundreds of S&P 500 earnings calls, NPS has been heavily scrutinized, and in some corners of academia, widely discredited, for its limited predictive validity regarding actual longitudinal retention behavior 5.
The primary academic paradox surrounding NPS is the intention-behavior gap. Empirical studies, including longitudinal examinations published in the Journal of Marketing, demonstrate a remarkably weak correlation between a customer's stated intent to recommend a product and their actual future spending or retention behavior 567. Additionally, the mathematical structure of NPS entirely discards "Passives" (respondents scoring 7 or 8) from its final calculation. Yet, sentiment analysis of online word-of-mouth (eWOM) reveals that Passives exhibit immense message valence heterogeneity; they are highly active in online forums and frequently shift toward churn without ever being flagged by NPS warning models 3. Finally, NPS was designed as a relational metric, but is frequently deployed transactionally, conflating overall brand health with acute, momentary satisfaction and yielding a noisy metric that fails to provide real-time operational guidance 14.
As NPS faces mounting academic headwinds, the Customer Effort Score (CES) has emerged as a highly predictive alternative. Originating from research by the Corporate Executive Board (now Gartner), CES measures the cognitive and procedural friction a customer experiences when interacting with a brand, typically asking users to rate the ease of handling an issue 816. Behavioral research highlights that 96 percent of customers who report high-effort experiences become disloyal, and 81 percent intend to spread negative word-of-mouth 817. Conversely, minimizing effort is a primary driver of retention. While delighting customers is expensive, subjective, and difficult to scale, reducing their friction is highly actionable and correlates directly with lowered churn rates. CES captures the specific moments of operational friction that NPS completely ignores, making it a vastly superior leading indicator for both voluntary and involuntary churn triggers 717.
Standard Customer Satisfaction (CSAT) remains a valuable, albeit distinct, diagnostic tool. While NPS attempts to measure broad loyalty and CES measures friction, CSAT accurately captures immediate satisfaction with a specific product feature or service interaction 7. CSAT acts as a tactical diagnostic instrument; it cannot reliably predict multi-year customer lifetime value, but it can pinpoint precisely which phase of a digital checkout or onboarding journey is failing 7. Leading organizations now utilize a hybrid measurement model, reserving NPS for executive brand benchmarking, deploying CES for workflow optimization and churn prediction, and utilizing CSAT for tactical support evaluation 7.
The Behavioral Economics of Voluntary Churn
Understanding why a customer actively cancels a subscription requires moving beyond purely functional logic, such as a product being deemed too expensive, into the nuanced realm of behavioral economics. Human decision-making is fundamentally bounded by rationality and heavily influenced by cognitive biases, heuristics, and psychological barriers 910. In the context of retention, three powerful psychological mechanisms dictate voluntary churn dynamics: switching costs, status quo bias, and cognitive friction.
Switching costs encompass far more than the explicit financial penalties of breaking a contract. Behavioral economics literature broadly categorizes switching costs into three dimensions: procedural and informational costs, financial costs, and relational costs 1112. Procedural costs involve the time, effort, and cognitive load required to evaluate an alternative, learn a new interface, and migrate data. In B2B SaaS, these are exceptionally high due to the deep integration of workflows across entire enterprise departments 1113. Financial costs relate to contract break fees or the forfeiture of grandfathered pricing, while relational and psychological costs involve the emotional discomfort of severing a trusted relationship with an account manager, or the perceived professional risk to a buyer's internal reputation if a newly championed vendor fails 11. While high switching costs effectively lock customers in, relying solely on them produces a calculative loyalty rather than affective loyalty. Customers retained purely by coercion or high exit barriers harbor deep resentment and will churn immediately if a competitor artificially lowers the barrier through migration assistance 14.
Status quo bias, a core tenet of behavioral economics, is the psychological preference for the current state of affairs; any change from the baseline is inherently perceived as a loss 915. This bias acts as a powerful retention mechanism. A comprehensive meta-analysis of choice architecture reveals that humans overwhelmingly stick to default options because altering them requires active effort 16. Furthermore, prospect theory and loss aversion play a vital role, as consumers consistently weight potential losses heavier than equivalent gains 10. Empirical studies on mobile telephony consumers in the UK revealed that users exhibit profound inertia; even when presented with personalized, verified data showing they could save money by switching to a objectively cheaper plan, they overwhelmingly chose not to switch. They preferred paying higher overage fees for the peace of mind that their current, familiar plan provided, viewing the disruption of the workflow as a greater penalty than the financial cost .
Cognitive friction refers to the mental strain required to process complex information, navigate a disjointed user interface, or resolve a customer service issue 916. In digital environments, high cognitive friction is the leading catalyst for voluntary churn. When users experience repeated errors or are forced to navigate convoluted self-service portals to achieve basic outcomes, their cognitive load spikes, overriding status quo bias and triggering flight responses. The application of the COM-B model (Capability, Opportunity, Motivation, Behavior) demonstrates that behavioral interventions - such as adding clear progress bars, simplifying choices to reduce choice overload, and framing support interactions collaboratively - drastically reduce churn intentions by lowering perceived friction and closing the persistent intention-behavior gap 910.
Cross-Industry and Geographic Churn Benchmarks
The baseline for an acceptable or healthy churn rate varies wildly depending on the specific industry vertical, the business model, and the regional market maturity. While B2B SaaS has long served as the gold standard for recurring revenue metrics, the explosive growth of DTC subscriptions and the formalization of B2B e-commerce demand a much broader comparative lens.
In the modern SaaS ecosystem, Net Revenue Retention (NRR) and Gross Revenue Retention (GRR) are the paramount indicators of organizational health. Gross Revenue Retention measures the core recurring revenue retained from existing customers, explicitly ignoring any upsells or expansions, effectively capping at 100 percent. A best-in-class GRR is greater than 90 percent, with median rates across the industry hovering around 88 to 90 percent 2728. GRR is widely considered the truest indicator of core product-market fit, as a low GRR indicates a fundamentally leaky bucket that expansion revenue is merely masking 29.
Net Revenue Retention, conversely, factors in all expansions, upsells, downgrades, and churn. In 2024 and 2025, median NRR sits tightly around 101 to 106 percent, indicating that the average SaaS company is barely growing its existing base after accounting for attrition 2728. However, elite, top-quartile performers achieve an NRR exceeding 115 to 120 percent 303117. Institutional research from McKinsey & Company demonstrates that this specific retention gap dictates massive enterprise valuation disparities: B2B SaaS companies in the top quartile for NRR trade at 24x enterprise-value-to-revenue multiples, compared to a mere 5x multiple for their bottom-quartile peers 1733. Furthermore, vertical SaaS solutions, which are built specifically for niche industries like construction or healthcare, typically experience lower churn and higher NRR than horizontal tools because the deep, industry-specific workflows create massive procedural switching costs 17.
The business-to-consumer (B2C) and direct-to-consumer (DTC) environments face a significantly harsher and more volatile retention landscape. Traditional, non-subscription e-commerce experiences average annual churn rates between 70 and 75 percent, with consumer electronics seeing annual churn as high as 82 percent 34. However, the DTC subscription model fundamentally repairs this dynamic. The global subscription economy, valued at nearly $492 billion in 2024 and projected to reach $1.5 trillion by 2033, relies on recurring billing to establish baseline lifetime values that are three to five times higher than transactional retail models 35.
Monthly churn rates in DTC and e-commerce subscriptions vary starkly by vertical. Health and wellness subscriptions, encompassing supplements and vitamins, typically average between 8 and 12 percent monthly churn. While they suffer from high early-stage drop-offs, once habit formation occurs, long-term retention stabilizes beautifully 2. Conversely, meal kits and food delivery services suffer the highest churn rates in the subscription sector, ranging from 12.7 to 18 percent monthly, driven by rapid diet fatigue and the high cognitive burden of continuous meal preparation 236. General merchandise subscription boxes experience 10 to 15 percent monthly churn, often characterized by product accumulation fatigue and high initial acquisition via deep discounts, which naturally attracts low-intent subscribers 2.
Regional Variations: Mature Western Markets vs. APAC and Latin America
Retention dynamics also differ considerably across global geographies. North America and Western Europe represent highly mature, saturated digital markets where competition is fierce, and switching costs for general consumer applications are notoriously low. Consequently, these regions index highly on utilizing advanced AI and proactive behavioral strategies to fight marginal churn increases, as pure market expansion is no longer a viable growth engine 3738.
Emerging markets in the Asia-Pacific (APAC) and Latin American regions exhibit distinct behavioral patterns. Massive governmental and private investments in digital payment infrastructure and last-mile logistics have rapidly expanded the e-commerce and subscription addressable market in countries like India and Brazil 1819. For example, the Indian market represents one of the fastest-growing regions globally for freeze-dried food and DTC subscriptions, boasting a compound annual growth rate (CAGR) of 16.2 percent 41.
However, emerging markets often experience higher immediate churn volatility due to distinct regional factors. While rapidly improving, rates of involuntary churn due to failed recurring payments remain higher in regions with lower credit card penetration and shifting digital wallet regulations. Furthermore, a rapidly growing but highly price-conscious middle class is exceptionally responsive to discounting, leading to higher brand switching behavior 19. Despite this volatility, greenfield advantages remain immense; companies entering Southeast Asia or Latin America early can establish intense status quo bias among newly minted digital consumers, securing long-term loyalty that is virtually impossible to organically win in saturated Western markets 1819.
Table 1: Average Churn Benchmarks Across Industries and Regions (2024-2025)
| Industry / Segment | Business Model | Median Monthly Churn | Median Annual Churn | Key Regional / Behavioral Driver |
|---|---|---|---|---|
| Enterprise Infrastructure / ERP | B2B SaaS | 1.8% - 2.1% | 19.8% - 22.9% | Extreme procedural switching costs; multi-year contracts 13. |
| Sales / Marketing Automation | B2B SaaS | 4.8% - 5.2% | 46.1% - 49.4% | High competition; lower individual buyer seniority leading to less organizational commitment 13. |
| Health & Wellness Subs | DTC E-commerce | 8.0% - 12.0% | N/A (High early drop) | Habit formation dependency; stabilizes post-first month 2. |
| Meal Kits & Food Delivery | DTC E-commerce | 12.7% - 18.0% | N/A | Diet fatigue; high cognitive load required to utilize the product consistently 236. |
| Telecommunications | B2B / B2C Services | 2.5% - 3.0% | ~31.0% | Deep status quo bias; high infrastructure reliability needs 2043. |
| Consumer Packaged Goods | B2B Wholesale | ~3.3% | 40.0% | Pandemic-era supply chain shakeups driving consumers to test new brands 2044. |
| APAC / LATAM Tech/DTC | Mixed | Volatile | High early stage | Expanding digital payment adoption; high price sensitivity among emerging middle class 1819. |
Dissecting the Churn Event: Voluntary vs. Involuntary Mechanics
To effectively reduce customer attrition, organizations must bifurcate their strategic response to address the two distinct mechanisms of churn: voluntary and involuntary. Treating them as a single monolithic metric in board reporting results in fundamental operational failure, as they require entirely different psychological understandings and remediation playbooks 245.
Voluntary churn occurs when a customer makes an active, conscious decision to sever the commercial relationship. In B2B SaaS, this accounts for roughly 2.6 percent of the 3.5 percent average monthly churn 45. In DTC subscriptions, active cancellations account for 60 to 75 percent of all churn events 2. The primary drivers of voluntary churn are unachieved business outcomes, poor onboarding experiences, competitor poaching, and cognitive friction 913. In the small and midsize business (SMB) sector, up to 43 percent of all voluntary losses occur within the first 90 days of the contract. This phenomenon, known as the "90-Day Cliff," highlights that if a user does not achieve a rapid "quick win" or immediate time-to-value (TTV), post-purchase rationalization fails, and they rapidly abandon the platform 1346.
Involuntary churn, frequently termed passive or structural churn, occurs when a customer's subscription is canceled unintentionally, almost exclusively due to payment failures. This encompasses expired credit cards, hard bank declines, false-positive fraud flags, and network routing errors. Across subscription models, involuntary churn accounts for roughly 0.8 percent of monthly B2B churn and up to 30 to 40 percent of all DTC churn 245. Astonishingly, involuntary churn represents over $1.3 billion in recoverable revenue annually across the software industry alone 13. Organizations that treat payment failures as final consumer decisions lose substantial lifetime value. Companies utilizing intelligent, AI-driven retry logic and automated credit card updater services can seamlessly recover up to 68 percent of failed payments, compared to a mere 23 percent recovery rate for firms employing rudimentary, single-retry logic 13.
Table 2: Drivers and Interventions for Voluntary vs. Involuntary Churn
| Churn Type | Primary Drivers | Behavioral / Psychological Root | Best-in-Class Interventions |
|---|---|---|---|
| Voluntary (General) | Lack of perceived value, complex UI, competitor pricing, poor customer support 4647. | Cognitive friction, lack of status quo attachment, intention-behavior gap 910. | Predictive AI health scoring, automated milestone celebration, seamless self-service UX, behavioral nudges 948. |
| Voluntary (Early Stage) | The "90-Day Cliff" (Failure to realize value early in the lifecycle) 1346. | Post-purchase rationalization failure; high procedural switching costs to learn the tool. | High-touch onboarding, time-to-value (TTV) acceleration, segment-specific customer success teams 1346. |
| Involuntary | Expired credit cards, hard/soft bank declines, false-positive fraud flags 134446. | N/A (Structural and mechanical failure, not a psychological choice). | Automated credit card updater services, intelligent multi-day dunning logic, SMS/in-app payment nudges 213. |
Updating Predictive Modeling: AI and Early Warning Signals
The historical approach to churn management was overwhelmingly reactive. Customer Success Managers (CSMs) relied on lagging indicators - such as a sudden drop in an NPS survey, an escalated and angry support ticket, or a formal cancellation request. By the time these lagging indicators surfaced, the customer's decision was already psychologically cemented, rendering save attempts futile and expensive. Today, the deep integration of Artificial Intelligence and Machine Learning has transformed retention from a reactive defense into a proactive, predictive science 4821.
Recent academic papers published in data mining and analytics journals emphasize a critical algorithmic shift: static demographic and contractual data are weak predictors of churn. Instead, predictive models must rely on high-velocity behavioral usage features 22. Machine learning models, such as Random Forests, Boosted Trees, and Deep Neural Networks, are highly adept at isolating subtle engagement behaviors that precede attrition 2223. For example, researchers utilizing Random Forest models achieved a 91.66 percent predictive accuracy rate in telecommunications churn by deploying Explainable AI (XAI) techniques like SHAP (SHapley Additive exPlanations) and LIME 23. These interpretability analyses revealed that churn is primarily driven by behavioral engagement patterns rather than isolated service quality indicators; it is not merely the volume of usage that matters, but the breadth of feature interaction and sudden, subtle deviations from established baseline behaviors 22.
Advanced predictive frameworks now routinely ingest unstructured data to detect "sentiment drift." Using Natural Language Processing (NLP), AI systems continuously analyze customer service transcripts, emails, social media sentiment, and chat logs 4724. A subtle shift in communication tone from collaborative to frustrated, or a sudden spike in the viewing of self-service cancellation documentation, serves as an immediate red flag long before usage drops 4753. For instance, a customer who still rates interactions highly on standard CSAT surveys but begins asking highly specific technical data migration questions is already planning their exit 53. Implementations of conversational analytics to detect these hidden trigger points, combined with proactive callback protocols, have been empirically shown to boost NPS by nearly 7 points and significantly reduce recontact rates 53.
The most recent leap forward is the deployment of Agentic AI. Moving beyond predictive models that merely flag at-risk accounts on a dashboard, Agentic AI systems operate autonomously within CRM platforms and operational support systems. They ingest real-time behavioral streams, calculate churn probability, and autonomously execute personalized retention workflows without human intervention 21. If a high-value B2B client shows declining feature usage, the AI agent might autonomously trigger an in-app contextual tooltip to reduce cognitive friction, alert a human CSM with a synthesized summary of the account history, and draft a personalized check-in email tailored to the user's specific workflow drop-offs. Industry implementations indicate that such Agentic AI deployments have improved churn prediction accuracy from 62 percent to over 87 percent, while simultaneously reducing operational service costs by up to 30 percent 21.
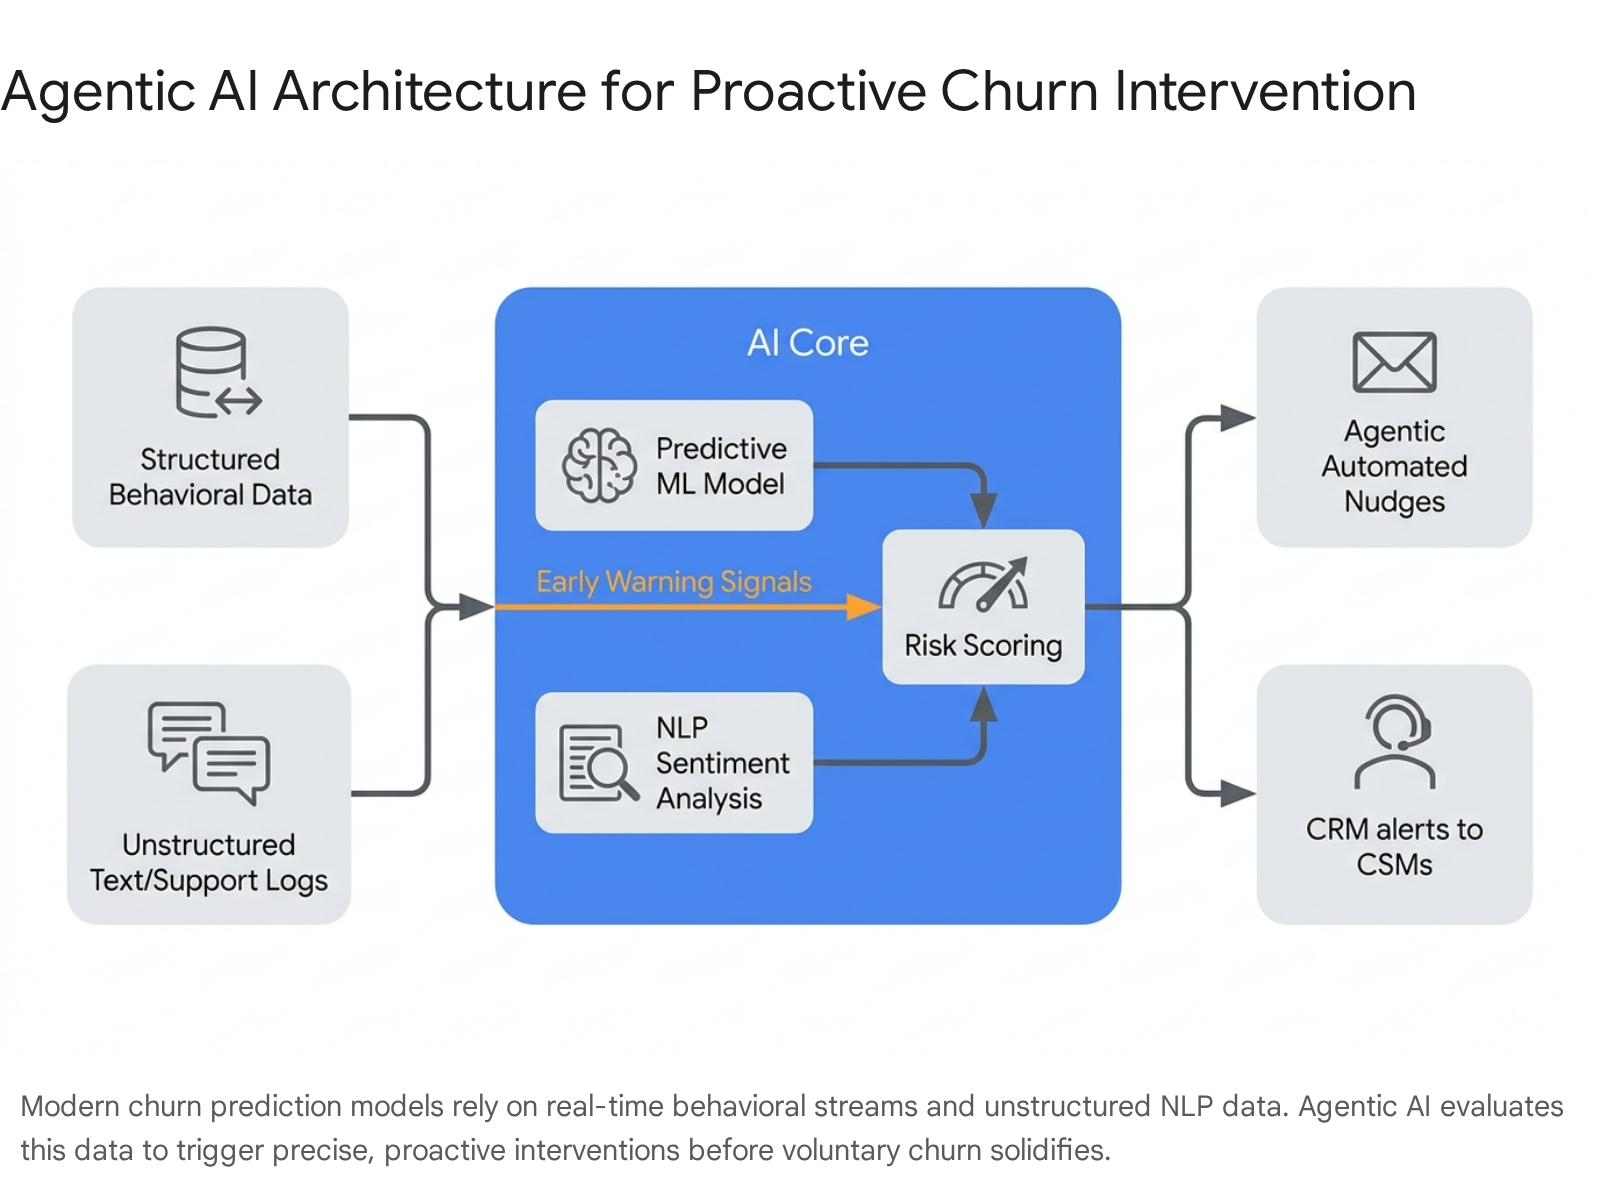
Table 3: Traditional vs. ML-Based Early Warning Indicators
| Category | Traditional (Reactive) Indicators | Modern ML/AI (Proactive) Behavioral Signals |
|---|---|---|
| Product Engagement | Total logins per month; overall active user count. | Decreasing breadth of feature usage; shortened session lengths; altered navigation paths 4722. |
| Customer Support | Total tickets filed; average time to resolution. | Sentiment drift in chat logs mapped via NLP; repeated reopening of specific issue types; escalating textual frustration 4753. |
| Financial/Account | Missed payments; explicit requests for downgrades. | Removal of secondary payment methods; decreased usage velocity immediately preceding a renewal window 47. |
| System Intervention | Manual outreach triggered only after an NPS score drops below 6. | Agentic AI deploying automated, personalized micro-interventions based on real-time friction and anomaly detection 4821. |
Conclusion
The science of customer retention has matured unequivocally beyond the simplistic and flawed mandate to preserve every customer at any cost. In an era defined by skyrocketing acquisition expenses and continuous macroeconomic recalibration, advanced retention operations serve as the ultimate lever for compounding organizational growth.
Modern commercial leaders must abandon outdated measurement orthodoxies. Acknowledging the academic limitations of the Net Promoter Score enables the integration of highly predictive operational metrics, such as the Customer Effort Score, which accurately diagnoses the cognitive friction that drives voluntary churn. Furthermore, by understanding the behavioral economics of choice - specifically how status quo bias, loss aversion, and procedural switching costs dictate consumer behavior - companies can engineer digital and relational experiences that organically bind the user to the ecosystem.
Ultimately, the future of retention lies in predictive foresight. By harnessing explainable machine learning models, autonomous agentic workflows, and deep behavioral analytics derived from both structured data and unstructured natural language, businesses can detect the subtle tremors of dissatisfaction long before a customer consciously decides to cancel. Organizations that master these early warning signals will not merely survive market volatility; they will consistently capture outsized lifetime value, outpacing competitors who remain trapped in a legacy, reactive paradigm.