Revenue attribution for SEO content marketing
The Evolution of Digital Marketing Measurement
In contemporary digital commerce, the evaluation of search engine optimization (SEO) and content marketing has shifted fundamentally from top-of-funnel engagement metrics - such as page views, bounce rates, and keyword rankings - to rigorous revenue attribution and pipeline velocity analysis. Macroeconomic pressures have accelerated this transition. As of 2024, corporate marketing budgets have contracted to an average of 7.7% of total company revenue, a significant decline from the pre-pandemic average of 11% 11. Consequently, marketing executives are under intense scrutiny from financial leadership to justify expenditures through direct, measurable revenue contributions. Organizations that fail to establish a mathematical correlation between brand awareness initiatives and closed-won revenue face immediate budgetary risk, contributing to a decline in average Chief Marketing Officer (CMO) tenure, which currently sits at 24 months in high-growth software sectors 13.
This mandate for financial accountability arrives simultaneously with an unprecedented expansion in the complexity of the commercial procurement process. The average business-to-business (B2B) transaction now requires approximately 266 digital and human touchpoints spanning an average of 211 days 23. Modern procurement involves buying committees consisting of six to ten stakeholders, executing 27 distinct interactions per purchase 23. In this environment, organic search remains a foundational pipeline driver, initiating 73% of buying decisions through direct response touchpoints, educational content consumption, and vendor comparisons 3.
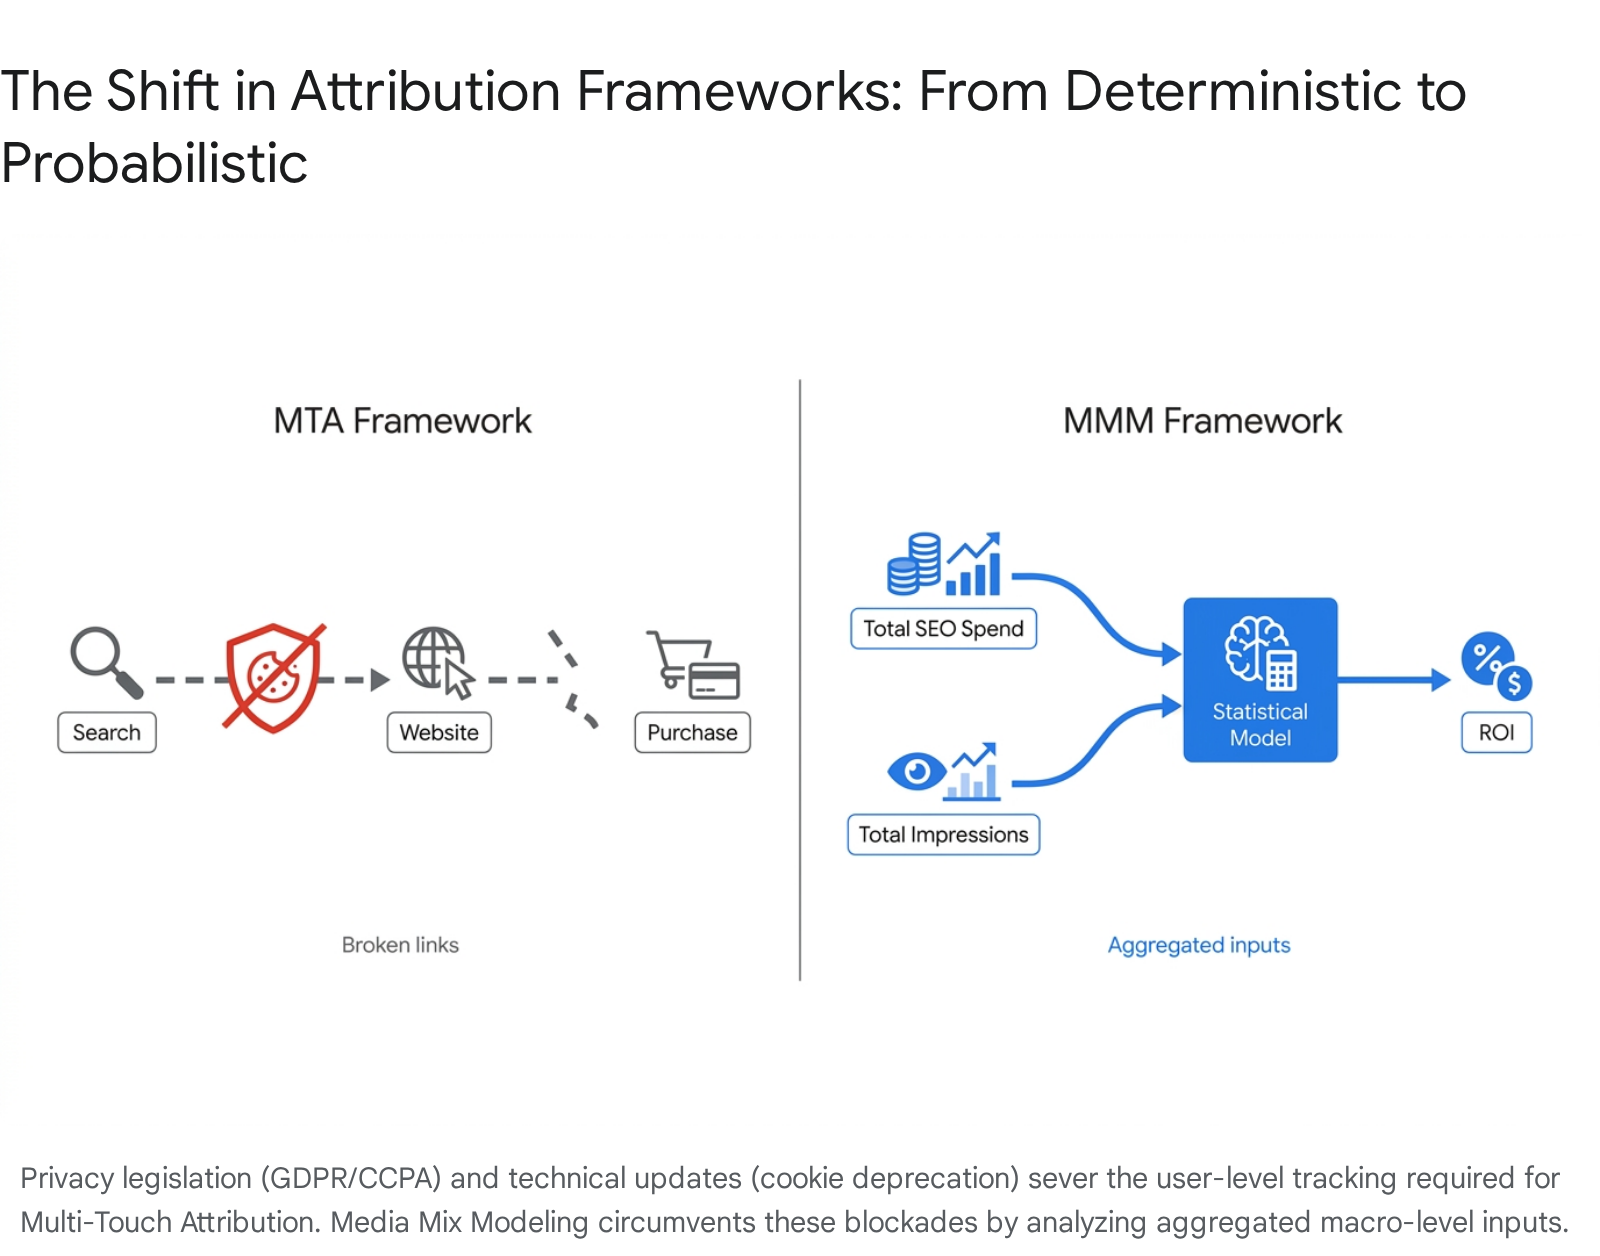
However, accurately tracking the financial impact of these organic touchpoints is impeded by a fragmented attribution ecosystem. The ongoing deprecation of third-party cookies, the enforcement of stringent global privacy regulations such as the General Data Protection Regulation (GDPR), and unannounced technical shifts in primary analytics platforms have compromised the deterministic, user-level tracking upon which digital marketing has historically relied. Organizations are consequently forced to transition toward probabilistic, aggregated frameworks to accurately measure the return on investment (ROI) of search-driven content.
The Financial Efficacy of Organic Search
Despite systemic measurement complexities, empirical data demonstrates that SEO content marketing yields one of the highest financial returns among digital acquisition channels, particularly within high-growth, high-margin sectors such as Software as a Service (SaaS).
Data indicates that mature B2B SaaS organic search programs achieve an average ROI of approximately 702% to 864% across a three-year evaluation window 45. Due to the front-loaded costs of content creation and technical optimization, these programs typically reach a break-even point within seven months of sustained investment 45. This robust return profile is largely driven by the compounding nature of organic search assets. Unlike paid digital advertising, which ceases to generate traffic immediately upon the depletion of a budget, highly ranked content assets continue to capture demand over multi-year horizons without proportional increases in variable spend. Consequently, the average Cost Per Lead (CPL) for organic SaaS traffic sits at $147, compared to $280 for paid search acquisition 4.
Organizations that shift their organic strategy from basic traffic acquisition to a revenue-focused model experience revenue growth rates 2.8 times higher than peers focused solely on volume metrics 6. The integration of SEO with the broader customer acquisition funnel has been empirically shown to reduce overall Customer Acquisition Cost (CAC) by up to 45%, while simultaneously increasing Customer Lifetime Value (CLV) by 37% 6.
Pipeline Contribution and Conversion Efficiency
While total organic traffic volume serves as a directional indicator of brand visibility, revenue attribution models require granular tracking of commercial-intent actions. Organic search traffic yields an average aggregate conversion rate of 5.0%, positioning it as a highly efficient mechanism for capturing established market demand 4. However, establishing a definitive link between search visibility and revenue generation necessitates measuring the exact volume of commercial-intent traffic required to generate a Sales Qualified Lead (SQL).
Industry benchmarks indicate that an average of 23.1 commercial-intent organic clicks are required to generate one SQL, representing a 4.3% click-to-SQL conversion rate 9. Tracking this ratio provides organizations with a predictable mathematical model for forecasting pipeline generation based on projected search visibility improvements. Furthermore, the interplay between organic and paid search channels exhibits significant synergistic effects. Research indicates that when paid search advertisements are paused, 89% of the resulting traffic is not replaced by organic clicks, demonstrating that the channels capture distinct user behaviors 10. However, simultaneous exposure to both paid and organic search listings yields a 31% increase in incremental traffic and drives a 25% higher overall conversion rate, reducing the average cost per acquisition by up to 45% 10.
Analytical Frameworks for Revenue Attribution
Attributing revenue to an organic search initiative requires linking an anonymous user's initial informational query through a highly fragmented, multi-month journey to a closed-won transaction in a Customer Relationship Management (CRM) system. The traditional heuristics for this process have proven fundamentally inadequate for modern business environments, forcing a rapid evolution in data science applications within marketing analytics.
The Limitations of Heuristic Attribution Models
Historically, marketing technology platforms relied on single-touch attribution models to allocate revenue credit. First-touch attribution assigns 100% of the conversion value to the initial interaction that introduced the prospect to the brand. While this model acknowledges the role of top-of-funnel SEO content, it entirely ignores the subsequent nurturing channels - such as email marketing, webinars, and direct sales outreach - that ultimately secure the contract 311.
Conversely, last-touch attribution assigns total credit to the final interaction immediately preceding the purchase. Due to its simplicity of implementation within standard analytics platforms, last-touch became the industry default. However, this model systematically undervalues upper-funnel organic search content, creating a flawed narrative that bottom-funnel channels (like branded paid search or direct traffic) are the sole drivers of revenue. This misallocation frequently leads to chronic underinvestment in long-term brand building and content marketing 117.
The structural flaw in single-touch models is exacerbated by the reality of commercial procurement. Because the average enterprise deal involves 266 distinct touchpoints, assigning credit to a single interaction effectively ignores over 99% of the buyer's journey 23. Furthermore, 91% of standard marketing attribution models focus solely on the primary decision-maker who explicitly fills out a lead capture form 23. This approach completely fails to track the preliminary organic search behavior of the other five to nine stakeholders in the buying committee. If organic content successfully educates a technical evaluator, but the final contract is executed by an executive who entered the funnel via a direct channel, the organic search channel receives zero revenue attribution.
Multi-Touch Attribution Methodologies
To address the deficits of single-touch heuristics, organizations deployed Multi-Touch Attribution (MTA). MTA utilizes user-level data - reliant on cookies, mobile identifiers, and tracking pixels - to reconstruct individual digital journeys and fractionalize revenue credit across all participating touchpoints 814.
Early iterations of MTA relied on static, rules-based fractionalization. Linear attribution distributes credit equally across all recorded interactions; time-decay models assign increasing weight to interactions that occur closer to the conversion event; and position-based (or U-shaped/W-shaped) models assign heavy weight to critical milestones, such as 30% to the first touch, 30% to lead creation, and 30% to opportunity creation, with the remaining 10% distributed among intermediary touches 311.
While superior to single-touch methods, rule-based MTA remains arbitrary. The evolution of this discipline led to algorithmic, data-driven MTA models. Utilizing advanced statistical methods such as Markov chains and Shapley values, these models objectively quantify the incremental contribution of each channel based on historical conversion probabilities and cooperative game theory 91011. Research indicates that these data-driven MTA models improve conversion rate prediction accuracy by 18% to 30% compared to last-click models 7.
| Attribution Methodology | Mechanism of Action | Analytical Strengths | Structural Weaknesses |
|---|---|---|---|
| First-Touch | 100% credit to the initial interaction. | Highlights top-of-funnel audience acquisition drivers. | Ignores all mid- and bottom-funnel nurturing efforts. |
| Last-Touch | 100% credit to the final interaction before conversion. | Easy to implement; definitively links to the final action. | Systematically undervalues educational SEO and brand awareness. |
| Linear (MTA) | Equal credit distributed across all tracked touchpoints. | Acknowledges the multi-step nature of the buyer journey. | Fails to recognize that some interactions are far more influential than others. |
| Position-Based (MTA) | Weighted credit to milestones (e.g., 40% first, 40% last, 20% middle). | Balances initial discovery with the final conversion catalyst. | Weighting distribution is arbitrary and not scientifically derived. |
| Data-Driven (MTA) | Algorithmic fractionalization (Markov chains, Shapley values). | Objectively quantifies exact channel contribution based on historical probabilities. | Highly dependent on complete, deterministic user-level tracking. |
Comparison of primary revenue attribution methodologies 3117910.
The Integration of Category Media
The accuracy of MTA models is further challenged by the exclusion of external environmental factors. Traditional models track only Owned, Paid, and Earned media. However, academic literature proposes the necessity of the OPEC model, which incorporates Category media into the analytical framework 10. Category media encompasses the broader ecosystem of independent review sites, third-party industry publications, and competitor content. During complex procurement cycles, buyers do not solely rely on a single vendor's owned properties. The failure to ingest data regarding a user's interaction with unowned category media leads to over-attribution of internal channels and yields an incomplete assessment of the customer journey 1011.
Data Depreciation and Tracking Disruption
The efficacy of Multi-Touch Attribution is entirely contingent upon continuous, deterministic user-level tracking. This foundational requirement is currently undergoing a systemic collapse. Evolving privacy regulations, browser-level tracking preventions, and unilateral modifications to analytics architecture have fractured the global data landscape, creating severe geographic and technical discrepancies in marketing measurement.
As of 2024, corporate data quality faces a crisis. Chief Marketing Officers estimate that 45% of the data utilized by their analytics teams is inaccurate, incomplete, or outdated 12. Correspondingly, 67% of organizations report that they do not completely trust the data they rely upon for strategic decision-making 13. This degradation is driven primarily by regulatory and technical blockades.
Diverging Privacy Legislation: The European Union vs. The United States
The global legislative environment regarding data privacy has bifurcated, fundamentally altering how organizations can collect the signals required for SEO attribution. The European Union's General Data Protection Regulation (GDPR) operates on a fundamental rights philosophy, defining privacy as an inherent human right 1415. The GDPR enforces a strict "opt-in" model, requiring explicit, informed, and unambiguous user consent before any tracking technologies, including analytics cookies, can be deployed 161724.
If a European user ignores or rejects a cookie consent banner, their organic search entry and all subsequent on-site actions become invisible to client-side MTA models. This results in massive attribution blind spots. The enforcement of GDPR has yielded immediate commercial impacts; empirical studies demonstrate that compliance protocols resulted in a 5.7% drop in display ad revenue per click, a 5.4% decrease in conversion rates, and a 25% overall reduction in available customer data 1819. The financial risk of non-compliance is severe, with the EU issuing €2.1 billion in fines in 2024 alone, bringing the cumulative global total to $6.17 billion since the regulation's inception 2728.
Conversely, the United States lacks a comprehensive federal privacy framework, relying instead on a patchwork of state-level regulations and sector-specific laws (e.g., HIPAA for healthcare, GLBA for finance) 242030. The most prominent state legislation, the California Consumer Privacy Act (CCPA) and its successor, the California Privacy Rights Act (CPRA), operate primarily on an "opt-out" consumer protection model 2421. Under the CCPA, organizations are generally permitted to collect analytics data by default, provided they offer consumers a clear mechanism to opt out of the sale or sharing of their personal information 3032. The penalties for CCPA violations are also structured differently, typically enforcing fines of $2,500 for unintentional breaches and $7,500 for intentional violations, lacking the revenue-percentage severity of the GDPR 2122.
This legislative divergence requires multinational organizations to manage highly complex, geo-specific consent management platforms (CMPs). The differing consent rates between the EU and the US result in geographic discrepancies in data fidelity, where North American attribution models appear artificially more robust simply due to the default inclusion of non-consenting users.
The Google Analytics GS2 Cookie Architecture Update
Compounding the regulatory challenges are structural changes implemented by major analytics providers. In early May 2025, Google executed an unannounced architectural update to the primary session cookie utilized by Google Analytics 4 (GA4) - the _ga_<property-id> cookie 342324.
Prior to this update, GA4 utilized the legacy "GS1" format, which relied on a rigid, dot-separated string to encode session data based on fixed positional indexing (e.g., GA1.1.860784081.1732738496) 3423. The May 2025 update silently transitioned this architecture to the "GS2" format. The GS2 structure replaces fixed positions with a labeled, key-value pair system delimited by dollar signs, incorporating specific prefixes such as s for session ID and t for timestamp (e.g., GS2.1.s1747323152$o28$g0$t1747323152$j60$l0$h69286059) 342337.
While this transition was invisible to users relying exclusively on native GA4 dashboard reporting, it severely disrupted enterprise data pipelines. Organizations utilizing custom server-side tracking, Measurement Protocol integrations, and proprietary MTA models heavily rely on direct parsing of the cookie string to extract Client IDs and stitch together user sessions 342425. Because Google provided no advance documentation regarding the format change, custom scripts programmed to parse dot-separated positions failed silently upon encountering the dollar-sign delimiters. This incident caused widespread systemic tracking failures, resulting in massive spikes in unassigned "(not set)" traffic, broken session continuity, and the widespread misattribution of organic search conversions during the transition period 342437.
The Resurgence of Media Mix Modeling
In direct response to the degradation of user-level tracking and the structural fragility of MTA, the marketing analytics industry has experienced a massive resurgence in Media Mix Modeling (MMM).
Recent survey data indicates that 67% of marketing leaders intend to increase their investment in MMM capabilities, viewing it as the most viable path forward for privacy-safe measurement 26.
Unlike MTA, which operates bottom-up by attempting to track the distinct pathways of individuals, MMM is a top-down, statistical analysis methodology. It utilizes historical, aggregated time-series data to execute multiple linear regression or Bayesian hierarchical modeling, isolating the incremental impact of each marketing channel on a dependent variable, typically total sales or revenue 262728. Because MMM ingests macro-level inputs - such as total weekly spend, aggregate impressions, and overall revenue - it relies on zero personally identifiable information (PII). Consequently, MMM is inherently immune to cookie deprecation, iOS tracking restrictions, and GDPR/CCPA consent rate fluctuations 142629.
Integrating Organic Search into Econometric Models
Historically, MMM was utilized almost exclusively for traditional offline channels like television, radio, and print, while digital channels were evaluated using MTA. However, modern unified measurement frameworks require the integration of owned and earned digital media.
To effectively model SEO content within an MMM framework, data scientists define specific independent variables that capture the intensity and reach of organic search efforts. These inputs commonly include weekly SEO-driven blog traffic, aggregated organic search impressions from Google Search Console, tracking data on non-branded keyword ranking positions, and the internal operational costs associated with content creation and technical optimization 293031.
A critical advantage of advanced MMM algorithms is their ability to apply data transformations that mirror real-world consumer psychology, specifically "adstock" and "saturation" effects 293246. Adstock models the carryover effect of marketing exposure; an informational SEO article published in one quarter continues to generate brand recall and pipeline contribution for months or years. Traditional MTA models, which often utilize 30- or 90-day lookback windows, systematically fail to capture this long-term compounding value. Saturation curves model the principle of diminishing returns, identifying the threshold at which additional investment in a specific channel ceases to yield proportional revenue growth 2629.
The Hybrid Measurement Approach
Despite its resilience, MMM possesses inherent limitations. It requires massive volumes of clean, normalized historical data - typically a minimum of two to three years of weekly records - to generate statistically significant outputs 333. Furthermore, MMM results are directional and aggregated, providing strategic guidance for quarterly budget allocation rather than the granular, real-time feedback required to optimize an active digital campaign 1433.
Consequently, the most sophisticated marketing organizations are adopting unified hybrid approaches. This involves utilizing MMM as the overarching strategic framework to guide cross-channel budget allocation and validate causal impact, while simultaneously deploying MTA across the remaining authenticated, consented user base to inform tactical, day-to-day campaign optimizations 1184849.
Sales Pipeline Velocity and Search Engine Optimization
While MMM answers macro-level financial questions for executive leadership, operational sales and marketing teams evaluate the efficacy of SEO content through its direct impact on Sales Pipeline Velocity.
Pipeline velocity represents the total dollar value of revenue a sales pipeline generates per day. It is an operational throughput metric, not a speed metric, calculated using four distinct variables:
$$\text{Pipeline Velocity} = \frac{\text{Number of Qualified Opportunities} \times \text{Average Deal Value} \times \text{Win Rate}}{\text{Average Sales Cycle Length}}$$ 50343536
Strategic SEO content acts as a lever capable of optimizing all four components of this equation. Research indicates that organizations that implement weekly tracking and optimization of these velocity metrics achieve 34% annual revenue growth, compared to merely 11% for organizations that monitor their pipelines irregularly 50.
| Industry Segment | Median Deal Size | Average Win Rate | Typical Sales Cycle | Average Pipeline Velocity |
|---|---|---|---|---|
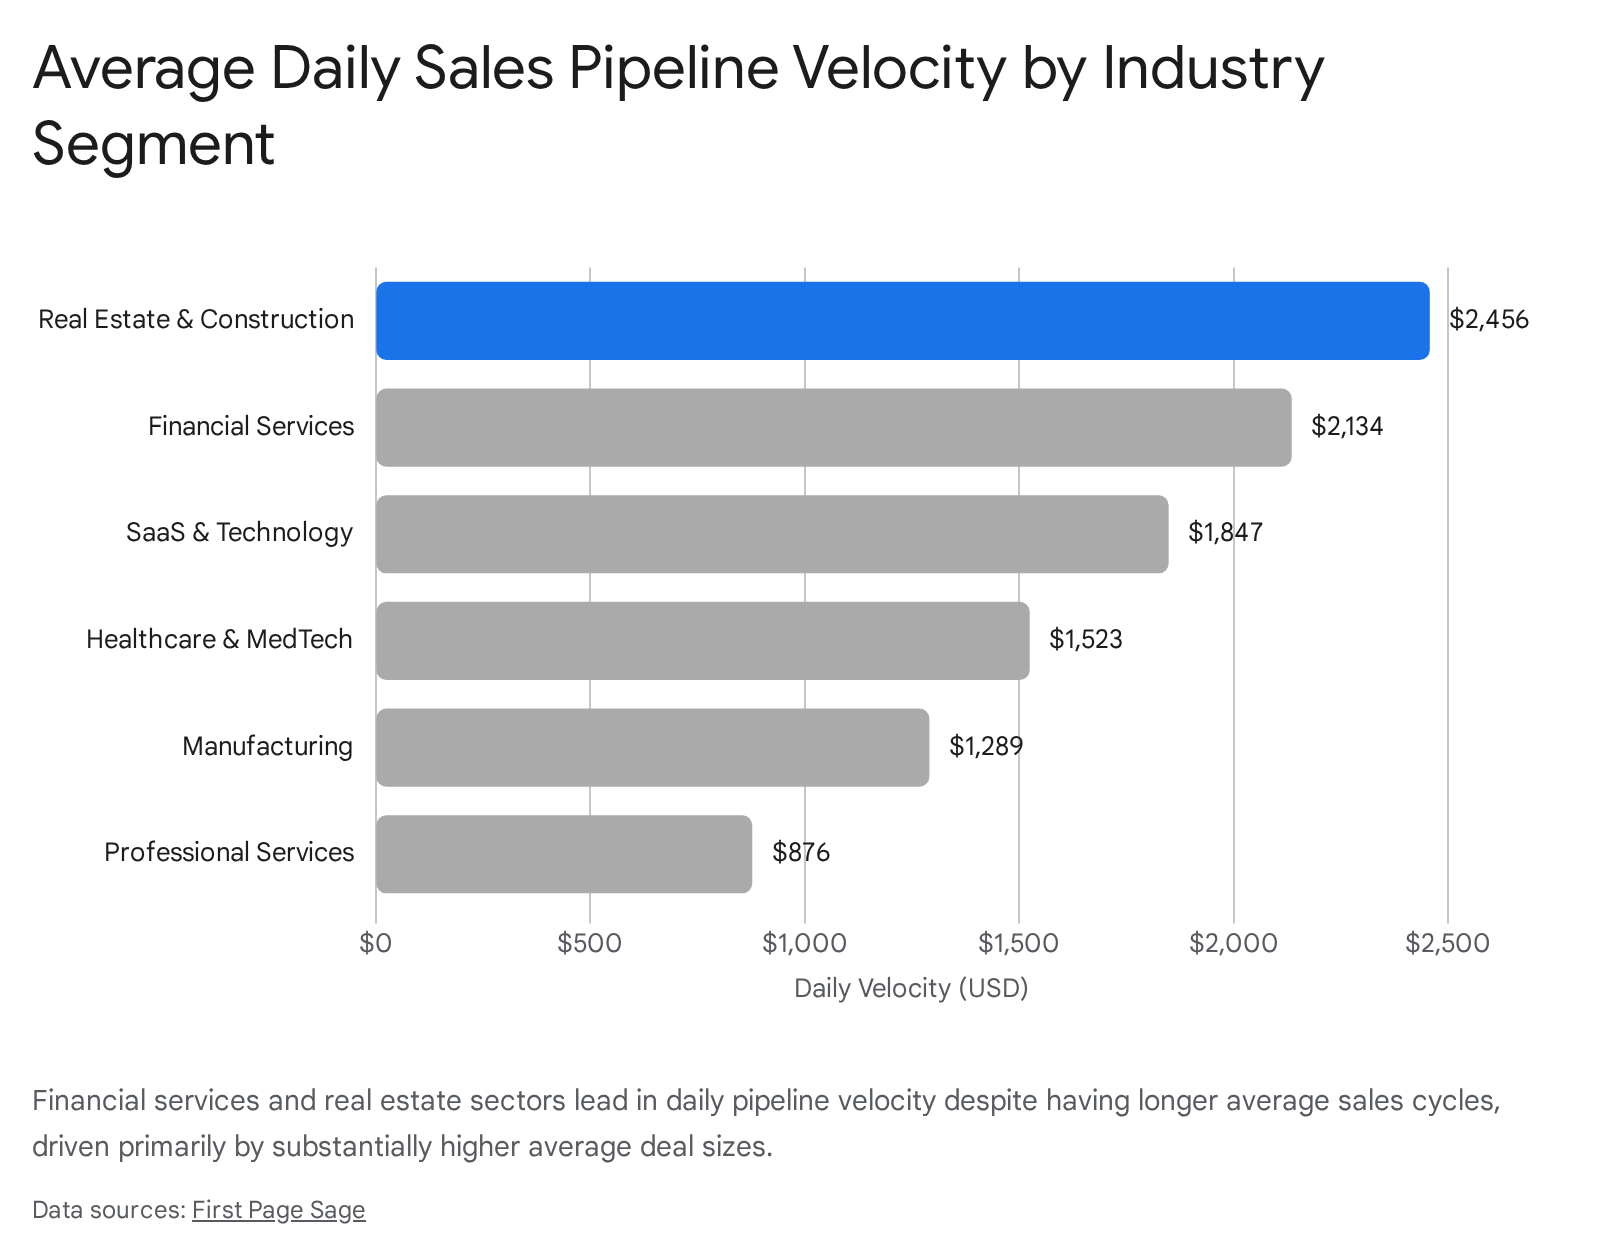
| Real Estate & Construction | $89,300 | 16% | 147 days | $2,456 / day |
| Financial Services | $31,200 | 18% | 89 days | $2,134 / day |
| SaaS & Technology | $12,400 | 22% | 67 days | $1,847 / day |
| Healthcare & MedTech | $18,700 | 25% | 72 days | $1,523 / day |
| Manufacturing | $47,800 | 19% | 124 days | $1,289 / day |
| Professional Services | $8,900 | 28% | 51 days | $876 / day |
| Marketing & Advertising | $15,200 | 24% | 58 days | $743 / day |
Data aggregated from 2025 pipeline velocity benchmarks demonstrating the relationship between deal size, cycle length, and daily revenue throughput 50.
Sensitivity Analysis in Pipeline Conversion
When attempting to increase pipeline velocity, organizations frequently focus entirely on compressing the sales cycle length. However, mathematical sensitivity analysis of the velocity equation reveals that the Win Rate is the most highly sensitive variable, while Cycle Length is often the least responsive 35.
For example, aggressively attempting to shorten a sales cycle from 90 days to 72 days often involves pushing unqualified leads through the funnel prematurely, resulting in a corresponding collapse in the win rate. If a 20% reduction in cycle time triggers a 5% absolute drop in win rate, the net pipeline velocity actually decreases 35. High-performing organizations instead focus on holding cycle times steady while improving the win rate against a highly qualified pipeline 35.
SEO content is instrumental in driving this win-rate improvement. Top-of-funnel content architectures, utilizing tightly organized pillar pages and topic clusters, increase the raw number of qualified opportunities by capturing informational demand 3755. Middle and bottom-of-funnel content - such as competitor comparisons, technical implementation documentation, and ROI calculators - attracts enterprise accounts, elevating the average deal value. Crucially, this content serves as an asynchronous sales engineer, preemptively answering technical objections and providing necessary social proof. Buyers who consume high-intent organic content are pre-qualified prior to engaging with sales personnel, dramatically elevating the probability of a closed-won deal and improving the overall win rate 3556.
Generative Artificial Intelligence and Search Behavior
The landscape of search attribution faces an emerging, highly disruptive force: the proliferation of Generative Artificial Intelligence and Large Language Models acting as primary search interfaces (oLLM), including platforms such as ChatGPT, Perplexity, and Google's integrated AI Overviews.
As user behavior gradually shifts from querying traditional algorithmic search engines to utilizing conversational AI platforms, the mechanics of SEO traffic distribution and subsequent attribution are altering. Current empirical data indicates that Google still functions as the dominant market force, routing approximately 345 times more traffic to publisher websites than all major AI platforms combined 4. However, the integration of AI Overviews directly into Google's search ecosystem has been shown to reduce traditional outbound clicks to publisher websites by 34.5% for affected informational queries 4.
From a strict revenue generation perspective, the efficacy of oLLM traffic remains an area of active debate and emerging research. A large-scale 2026 empirical study analyzing $20 billion in e-commerce transaction data found that conversion rates originating from oLLM traffic were 9% lower than those from traditional non-AI search channels, and overall on-site engagement levels were 27% below standard organic search 38.
The attribution of revenue to this AI-driven traffic presents novel complexities. AI platforms frequently operate as closed ecosystems, stripping referral header data and depositing users into the "dark funnel" of direct or unassigned traffic. This obfuscation further renders deterministic MTA models obsolete, necessitating greater reliance on aggregated MMM frameworks and incrementality testing to gauge the true underlying demand generated by content syndication in AI training datasets.
Advanced Measurement Practices
To establish a defensible measurement framework that satisfies both marketing operations and executive finance teams in an era of data depreciation, organizations must abandon reliance on single platform dashboards and instead layer multiple, complementary methodologies to cross-validate revenue contribution.
Self-Reported Attribution and Qualitative Calibration
As cookie tracking degrades, an increasingly effective methodology for capturing "dark funnel" data is Self-Reported Attribution (SRA). Organizations are widely integrating a simple, required free-text field (e.g., "How exactly did you hear about us?") onto high-intent lead capture forms and demonstration requests 1. Because the B2B buying journey involves extensive peer-to-peer sharing and consumption of content on untrackable platforms, MTA algorithms fail to record the initiating event. SRA data frequently reveals the true origination point - such as a specific long-form SEO blog post, a podcast mention, or an un-tracked query on an AI platform - providing essential qualitative calibration that software-based models systematically miss 1.
Incrementality Testing and Holdout Markets
To transition from correlational observation to causal proof of revenue impact, organizations must execute rigorous incrementality testing. This involves designating specific geographic regions or product lines as holdout markets. By intentionally pausing localized SEO technical optimizations or paid media expenditures in the control market for a 90-day period, and measuring the subsequent degradation or lift in baseline pipeline generation against an active test market, data scientists can isolate the true incremental contribution of the organic search channel 142646. Because incrementality testing relies on aggregate sales data rather than user-level tracking, it provides a privacy-compliant, definitive proof of concept that survives rigorous financial scrutiny 1446.
Fractionalizing Influenced Revenue
Given the reality of the 266-touchpoint B2B journey, SEO content must be evaluated on its capacity to influence a complex deal, rather than merely source the initial lead. To calculate this, data analysts examine CRM databases, isolating all closed-won deals over a trailing 12-month period. By flagging every deal that involved two or more documented interactions with organic content within the 90-day window prior to the close, organizations can apply a conservative attribution weight (typically 30% to 40%) to the content channel. Summing this fractionalized revenue across all flagged deals yields a highly defensible "influenced revenue" metric that accurately reflects the role of organic search in accelerating pipeline velocity, bridging the gap between top-of-funnel traffic and bottom-line financial impact 5.