Psychology of social proof and trust signals
Introduction to Social Validation Mechanisms
In digital commerce and remote transactional environments, the absence of physical product inspection and face-to-face interaction creates an inherent baseline of consumer skepticism. To mitigate this uncertainty, buyers rely heavily on proxy signals - psychological heuristics that indicate safety, quality, and reliability. The foundational framework for understanding this behavior relies on social proof theory, which posits that individuals observe the actions and decisions of others to determine correct behavior in ambiguous situations. Concurrently, signaling theory explains how businesses utilize third-party endorsements, security badges, and aggregated customer feedback as verifiable indicators of quality, bridging the information asymmetry gap between buyer and seller 1.
The digital ecosystem has evolved to integrate these psychological triggers at every stage of the consumer journey. From initial brand discovery to the final checkout process, trust signals dictate conversion probabilities. Consumers process two distinct categories of trust signals: implicit social proof, driven by the volume and valence of peer reviews, and explicit institutional proof, driven by authoritative security badges and professional accreditations. The efficacy of these signals is not uniform; it varies significantly across demographic cohorts, cultural backgrounds, and the specific nature of the transaction. Analyzing the empirical data behind these mechanisms reveals a complex landscape where the mere presence of reviews is no longer sufficient, and the authenticity of social proof is increasingly under scrutiny by both consumers and regulatory bodies.
Macro-Landscape of Institutional and Occupational Trust
Consumer reliance on external validation is heavily weighted by the perceived authority and neutrality of the source. Global data reveals a strict hierarchy in how populations assign trustworthiness to different professions and digital actors. This hierarchy dictates the effectiveness of endorsements in marketing and conversion optimization.
Occupational Trust and the Decline of Institutional Authority
Broad institutional trust has experienced significant volatility over the past decade, heavily influenced by macroeconomic conditions, systemic disruption, and political polarization. However, certain professions maintain resilient levels of global trust. Front-line public service workers, medical professionals, and educators consistently outrank corporate executives and politicians 23. According to the 2024 Ipsos Global Trustworthiness Index, doctors lead as the most trusted profession, deemed trustworthy by 58% of respondents globally across 32 countries, followed closely by scientists (56%) and teachers (54%) 23. Conversely, politicians remain the least trusted group, with only 15% of the global population viewing them as reliable 23.
When analyzing consumer behavior, the concept of the "ordinary person" or the peer is a critical benchmark. Ordinary people are twice as likely to be viewed as trustworthy (38%) than untrustworthy (17%), a metric that has remained remarkably stable across multiple annual measurement periods since 2018 2. In the context of product innovation and novel technology, peer voices have achieved parity with academic experts; consumers now trust their peers as much as scientists for information regarding new innovations, demonstrating the immense psychological power of user-generated content 4.
| Profession / Persona | Global Trustworthiness Score (2024) | Global Untrustworthiness Score | Net Trust Differential |
|---|---|---|---|
| Doctors | 58% | Data unavailable | Highly Positive |
| Scientists | 56% | Data unavailable | Highly Positive |
| Teachers | 54% | Data unavailable | Highly Positive |
| Restaurant Serving Staff | 44% | Data unavailable | Positive |
| Ordinary People (Peers) | 38% | 17% | +21% |
| Taxi Drivers | 28% | 28% | Neutral (0%) |
| Politicians | 15% | Majority | Highly Negative |
Generational Trust and the Social Media Influencer
Despite billions of dollars routed into influencer marketing annually - with the industry growing from $1.7 billion in 2016 to an estimated $24 billion in 2024 5 - public trust in social media personalities remains exceptionally low. Across global indexes, social media influencers possess a net trustworthiness score that only slightly outperforms politicians, sitting at approximately -41% compared to politicians' -43% 3. However, susceptibility to influencer validation is sharply stratified by generation.
Generation Z is more than twice as likely (20%) to trust influencers compared to Baby Boomers (9%), with Millennials (18%) and Generation X (13%) falling in between 23. This generational divide indicates that while traditional celebrity or influencer endorsements may yield negative returns in conversion optimization for older demographics, they retain functional utility for brands targeting younger cohorts. Overall, the data suggests that for broad-market digital commerce, authentic peer reviews carry significantly more psychological weight and lower institutional risk than compensated influencer testimonials.
Regional Variations in Social Trust
Baseline social trust - the inherent belief that most people can be trusted - varies drastically by geography and economic development. Data from the Pew Research Center demonstrates that social trust is generally higher in high-income countries compared to middle-income nations. For instance, in Sweden, 83% of adults say most people can be trusted, whereas in Turkey, only 14% express this view 6.
However, wealth is not the sole determinant. The United States, despite high per-capita GDP, exhibits divided social trust, with 55% of adults stating people can be trusted, a figure comparable to middle-income nations like Indonesia 6. In the Middle East, specifically the Kingdom of Saudi Arabia, populations exhibit unique trust structures. According to the Edelman Trust Barometer, Saudi Arabia demonstrates the highest global level of trust in government (86%) and exceptionally high trust in business (78%) 7. These variations highlight that the baseline skepticism a consumer brings to a digital transaction is fundamentally shaped by their geopolitical and socioeconomic environment, altering how much compensatory social proof a brand must provide to secure a conversion.
Quantitative Mechanics of Review Volume and Recency
The presence of user-generated content, specifically star ratings and written reviews, fundamentally alters the conversion trajectory of a product page or digital service. Consumers actively seek out this data to validate their choices; an estimated 70% of shoppers look for reviews to confirm a company's legitimacy before initiating a transaction 8. When a consumer interacts with ratings and reviews on a product page, overall conversion rates experience an average lift of 120.3% 9.
The Conversion Multiplier and Volume Thresholds
The relationship between the sheer volume of reviews and the resulting conversion probability is profound. Going from zero reviews to just one single review generates a massive initial psychological shift, lifting conversion rates by 52.2% 910. This initial jump confirms that the most critical barrier to purchase is the absolute absence of social proof, which triggers intense loss aversion and high risk perception.
As volume increases, the conversion multipliers compound exponentially. Products displaying 11 to 30 reviews see conversion rates more than double compared to products with zero reviews, yielding a 74.4% lift 9. Crossing the threshold of 100 reviews pushes the conversion lift to approximately 250%, and extreme volumes exceeding 5,000 reviews yield lifts approaching 296.2% 91011.
| Review Volume Bucket | Average Conversion Rate Lift (vs. 0 Reviews) | Psychological Impact Mechanism |
|---|---|---|
| 1 to 10 Reviews | +52.2% | Establishes baseline existence and breaks initial risk barrier. |
| 11 to 30 Reviews | +74.4% | Validates consensus; outlier opinions are diluted. |
| 51 to 100 Reviews | +148.7% to +211.0% | Solidifies market presence; strong herd behavior activation. |
| 101 to 5,000 Reviews | +250.0% to +270.3% | Generates absolute authority and perceived ubiquity. |
| 5,000+ Reviews | +296.2% | Maximum algorithmic and psychological dominance. |
The Academic Debate on Diminishing Marginal Returns
While industry data from commercial review platforms indicates a continuous linear or exponential relationship where more reviews consistently yield higher conversions, academic analyses propose a theory of diminishing marginal returns 12. According to studies based on human-computer interaction theories of visual search and attention competition, consumer information acquisition reaches a saturation point 12.
After a certain threshold, additional reviews do not provide net-new information, and the cognitive load required to process them neutralizes further incremental conversion benefits. This mirrors physiological saturation models, where stimuli beyond a specific capacity cease to yield adaptive responses 1314. Academic research utilizing empirical experiments and mathematical modeling suggests that while video and image reviews have direct positive impacts on purchase intentions, they exhibit indirect diminishing marginal utility as the volume becomes overwhelmingly large 12. However, from a practical commercial standpoint, no specific threshold has been identified where additional positive reviews actively harm the conversion rate, leading most practitioners to pursue maximum volume.
Review Recency and the Decay of Consumer Confidence
The psychological half-life of a customer review is remarkably short. A high volume of reviews is functionally useless if the data appears stale. Contemporary consumer behavior dictates that 77% of shoppers will not trust a review that is older than three months, and 83% state that reviews only hold value if they are recent and contextually relevant 15.
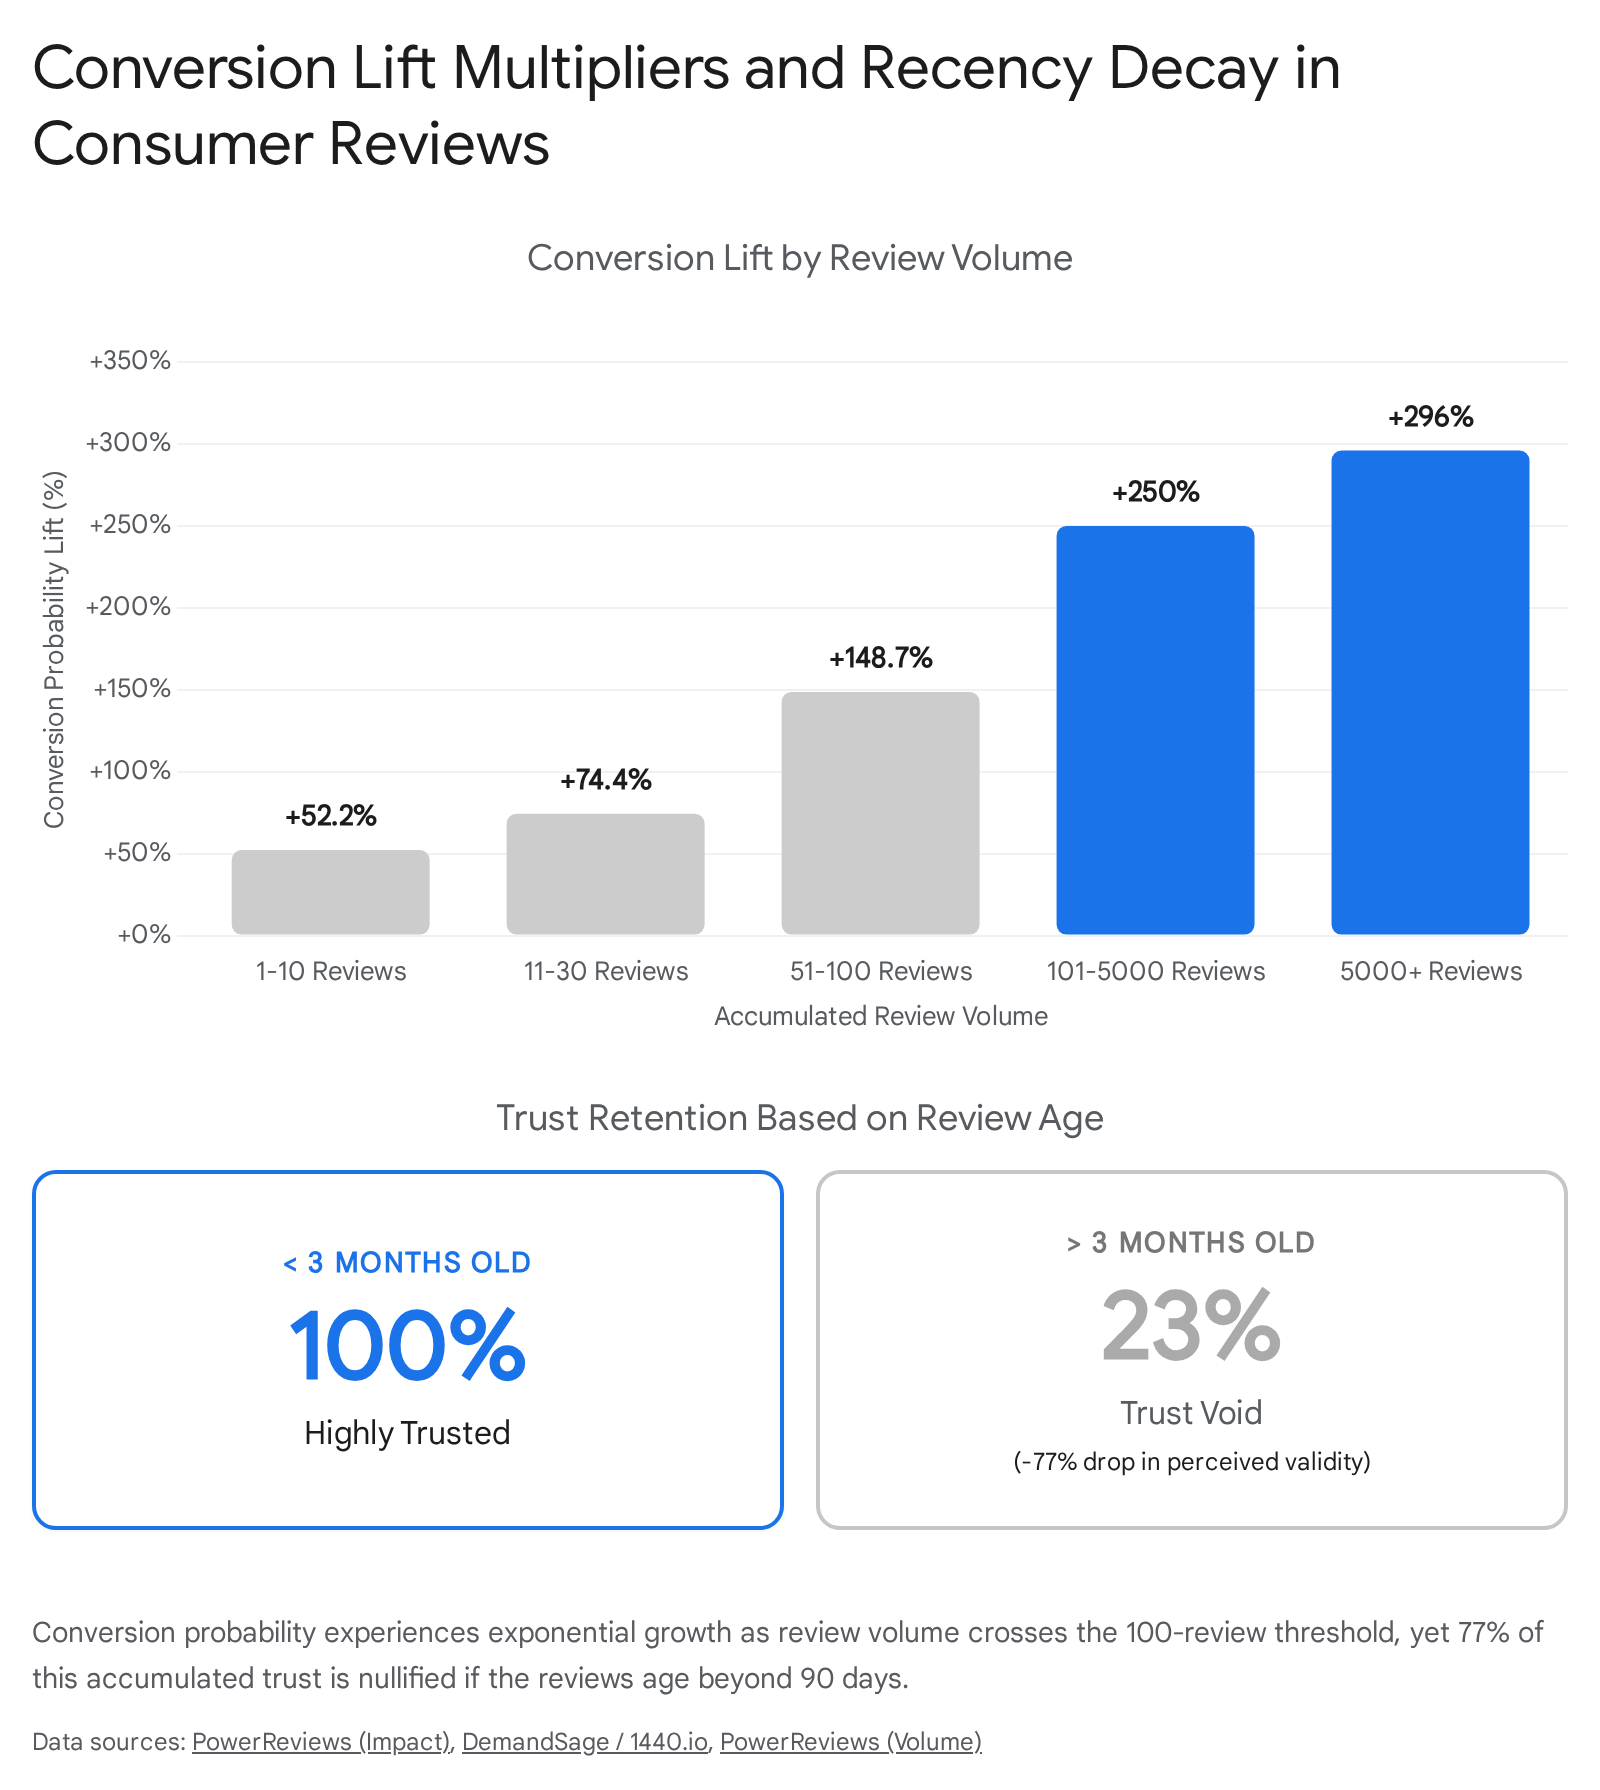
For new brands or first-time purchases, recency is heavily scrutinized by 86% of buyers 15. Furthermore, consumers exhibit a distinct preference for temporal relevance over sheer volume in specific trade-offs; 64% of shoppers would rather purchase a product with a smaller number of recent reviews than a product boasting a massive volume of reviews that are all older than 90 days 15. Businesses maintaining a continuous influx of current feedback - defined as generating more than 25 reviews within the past 90 days - achieve revenue metrics 108% higher than average baselines 15.
The Paradox of the Perfect Rating
While increasing review volume generally increases conversion, the valence (the average star rating itself) exhibits a non-linear effect on purchasing behavior. Consumers are highly attuned to the statistical improbability of unanimous perfection.
Data derived from paid search campaigns reveals that conversion rates peak when the average star rating sits between 4.2 and 4.65, achieving approximately a 14% conversion rate 17. However, when the rating climbs closer to a perfect 5.0 (e.g., an average of 4.96), conversion rates paradoxically drop to 12.8% 17. A flawless 5.0 rating triggers acute consumer skepticism, raising immediate suspicions of review manipulation, algorithmic filtering, or paid endorsements.
Consequently, the presence of negative reviews is not inherently detrimental. Unfavorable feedback serves to authenticate the positive reviews; shoppers who actively filter to read one-star reviews still convert at a rate 108.8% higher than the average site visitor 18. This phenomenon demonstrates that transparent, mixed feedback is a crucial mechanism for building long-term platform credibility and reducing perceived transactional risk.
Efficacy of Visual Trust Signals and Security Badges
Beyond textual reviews, visual symbols play a pivotal role in establishing subconscious trust, particularly during the checkout phase where financial risk is highest. A staggering 19% of digital shoppers abandon their carts explicitly because they do not trust the website with their credit card information 1620.
Mechanisms of Trust Transference
Trust badges function through the psychological mechanism of transference of trust. When an unfamiliar e-commerce site displays a recognizable logo from a trusted multinational corporation, a fraction of that institutional credibility is conferred onto the unknown merchant 16.
Implementing specific trust blocks can increase conversion rates by 15% to 42% depending on the brand's prior recognition level and the context of the implementation 1718. The strategic combination and placement of these badges are critical. A formal A/B test conducted by a conversion rate optimization agency demonstrated that placing a Norton trust badge immediately adjacent to an existing generic security indicator on a digital purchase page lifted conversions by 12.2% and total revenue by 16.6% 19. Slapping generic icons in footers is largely ineffective; signals must be placed at high-friction moments in the user journey.
The hierarchy of visual trust marks is well-documented: 1. Payment Authentication: Badges like PayPal Verified are frequently cited as the most trusted seal, offering the highest level of perceived financial security by bridging the gap between an unknown merchant and a known financial institution 2025. 2. Security and Scanning: Norton Secured and McAfee Secure rank highly due to wide consumer recognition of their antivirus software origins, signaling active protection against malware and data theft 1625. 3. Business Accreditation: The Better Business Bureau (BBB) accreditation remains one of the most prestigious signals in North America. Research indicates that over 80% of consumers would choose a BBB Accredited Business over a non-accredited competitor possessing the same theoretical A+ rating, highlighting the enduring value of third-party ethical auditing 25.
Demographic Variances in Badge Perception
The efficacy of specific visual signals is not universal; it is heavily segmented by gender and age. According to extensive survey and conversion research by the CXL Institute, males are significantly more likely to trust the Visa-Mastercard seal as a primary security indicator 20. In contrast, females exhibit significantly higher trust in the Better Business Bureau (BBB) seal and the Norton security seal 20.
Generational divides also dictate badge performance. Generation Y (Millennials) display a much higher propensity to trust "Google Trusted Stores" compared to Baby Boomers, whereas older generations (aged 50+) place significantly higher trust in PayPal relative to younger cohorts 20. Furthermore, consumers who classify themselves as "frequently concerned about online security" show a marked preference for SiteLock badges (20% versus 14% for less concerned shoppers) 20. Marketers must align their trust signals with the specific demographic and psychographic profile of their target audience to maximize the conversion lift.
Business-to-Business (B2B) versus Business-to-Consumer (B2C) Dynamics
The psychological triggers that facilitate a $50 consumer retail purchase differ vastly from those required to secure a $50,000 enterprise software contract. The application of social proof must adapt to the length of the sales cycle, the number of decision-makers, and the fundamental nature of the risk involved.
Baseline Conversion Discrepancies
In the Business-to-Consumer (B2C) sector, conversion events are usually fast, emotion-driven, and involve a single decision-maker. Consequently, B2C e-commerce conversion rates globally trend between 2.0% and 5.0% 2627. Social proof in B2C is optimized for speed and volume: aggregated star ratings, user-generated images, and urgency notifications (e.g., "15 people are looking at this item right now") 18. These signals capitalize on herd behavior and the immediate alleviation of low-level purchase anxiety.
Business-to-Business (B2B) transactions, however, are characterized by significantly longer sales cycles - frequently spanning 75 to 180 days - and buying committees comprising 6 to 10 stakeholders 28. The risk in B2B is not merely financial; it carries professional, systemic, and operational consequences for the buyer. Consequently, B2B website conversion rates are substantially lower, averaging a median of 2.9% across all industries 2728.
| Industry / Sector | Average Conversion Rate | Primary Trust Mechanisms Required |
|---|---|---|
| B2C Retail & E-commerce | 2.5% - 5.0% | High-volume star ratings, user reviews, urgency badges. |
| B2B Professional / Legal Services | 4.0% - 7.4% | Expert endorsements, extensive case studies, credentials. |
| B2B Manufacturing | 2.1% - 5.0% | ISO certifications, detailed technical specifications, longevity. |
| B2B SaaS & Tech | 1.1% - 3.0% | Client logos, free trials, robust data security compliance badges. |
Specialized B2B Trust Signals
In B2B environments, anonymous star ratings hold little weight. Trust is established through deep, verifiable social proof that addresses institutional risk:
- Client Logos: Displaying recognizable corporate logos transfers immense industry authority. B2B landing pages featuring 10 or more recognizable client logos report 20% to 35% higher conversion rates than identical pages lacking this proof 18.
- Free Trials as Experiential Proof: Free trials function as experiential trust signals. By allowing buyers to test a product in their own environment, vendors eliminate theoretical risk. Trial-to-purchase conversion rates in B2B are extraordinarily high, averaging 59.9% for annual subscriptions and 68.8% for monthly plans 29.
- Institutional Security and Speed: B2B buyers require systemic assurance. Displaying compliance badges (such as "ISO 27001 Certified") adjacent to primary calls-to-action directly addresses enterprise security requirements 29. Furthermore, operational speed acts as a trust signal itself; B2B sites responding to inquiries within 5 minutes are 8 times more likely to convert leads than those responding within an hour 30.
Cross-Cultural Variations in Social Proof Susceptibility
Global marketing strategies frequently fail when they assume social proof operates identically across borders. Trust baselines and the mechanisms of social validation are deeply intertwined with a nation's cultural fabric, socioeconomic development, and institutional frameworks.
The Individualism and Collectivism Paradigm
Cross-cultural psychology relies heavily on the dimension of Individualism versus Collectivism to predict human behavior, a concept popularized by Geert Hofstede's cultural dimensions theory 21222324. Individualist societies emphasize personal autonomy, self-reliance, loose societal ties, and individual rights 212324. In contrast, collectivist societies emphasize interdependence, group harmony, and unquestioning loyalty to in-groups such as extended families or local communities 212324.
Historically, researchers assumed an "East versus West" binary, categorizing East Asian nations as strictly collectivist and Western nations as strictly individualistic. However, recent analyses utilizing data from over 100 nations covering 88% of the global population have dismantled this stereotype 25. Advanced East Asian economies like Japan and South Korea now score highly on individualism, differing from the United States by marginal points 25. Today, the world's most collectivist societies are predominantly located in the Global South, encompassing regions in Latin America, Sub-Saharan Africa, the Middle East, and Southeast Asia 252627.
In collectivist cultures, such as those in the Arab world, social proof is a core pillar of decision-making, as individuals place immense value on group consensus and the avoidance of social embarrassment or isolation 27. People in these societies are more likely to view themselves as part of a larger whole, meaning peer recommendations and extended network endorsements yield exceptionally high conversion influence.
Experience Versus Credence Services Across Cultures
The type of product being sold dictates whether an individualist or collectivist market will prefer peer reviews over expert endorsements. Joint research conducted on consumers in the United States and China highlights a universal psychological truth regardless of nationality: the reliance on specific trust signals depends heavily on the service category 28.
For "experience services" - such as dining at a restaurant, watching a movie, or getting a haircut - consumers in both nations overwhelmingly rely on peer reviews 28. Because the average consumer feels confident evaluating the outcome of a haircut or a meal, the sheer volume of peer opinions is considered sufficient proof of quality.
Conversely, for "credence services" - such as dental work, tax accounting, or specialized legal representation - consumers have profound difficulty evaluating the quality of the service even after it has been rendered 28. In these high-stakes, high-ambiguity scenarios, consumers in both the US and China disregard peer reviews and actively seek expert endorsements or institutional certifications to mitigate their anxiety 28.
However, the integrity of these expert systems varies globally. For example, academic and scientific publishing in China has faced high-profile controversies regarding fabricated peer reviews, with the nation contributing over half of the papers retracted globally for compromised peer review between 2012 and 2016 29. In regions where institutional trust has been damaged, explicit verifiable badges and strict transparent auditing must clear higher hurdles to be effective.
Algorithmic Deception and the Proliferation of Synthetic Reviews
The intense commercial value of social proof has inevitably led to systemic manipulation. A thriving underground economy dedicated to producing fake praise at an industrial scale has emerged, deeply compromising digital trust 30. Government research in the United Kingdom estimates that 11% to 15% of all online product reviews are entirely fabricated, generating hundreds of millions of pounds in consumer welfare losses annually 30.
AI-Generated Content and Detection Limitations
The advent of Large Language Models (LLMs) has drastically reduced the cost and effort required to generate synthetic endorsements. According to surveys of business decision-makers, 36% of organizations report experiencing some form of AI fraud, severely impacting data integrity and market research 31.
The primary danger of AI-generated reviews lies in their linguistic sophistication. Academic studies have demonstrated that human readers perform at a mere chance level (50.8% accuracy) when attempting to distinguish between authentic human feedback and AI-generated text 30. While AI text tends to be more analytical, highly affective, more descriptive, and slightly less readable than organic human writing, the differences are imperceptible to the casual shopper 32. Furthermore, a study involving the peer review of medical journal submissions found that LLM-generated reviews actually scored higher than human reviewers on identifying strengths and weaknesses, highlighting the advanced evaluative capabilities of these models 33.
Consequently, existing machine-learning classifiers frequently fail against hybrid attacks where adversaries use AI to generate base text and human editors to inject colloquial imperfections 30.
Regulatory Responses and Platform Transparency
In response to widespread deception, regulatory bodies have escalated punitive measures. The United States Federal Trade Commission (FTC) activated a final rule in late 2024 imposing civil penalties exceeding $50,000 per fake review, specifically banning synthetic endorsements, review suppression, and paid deception 30. Concurrently, major platforms have engaged in massive algorithmic takedowns; Amazon claimed to have blocked over 250 million suspicious posts in 2023, and Trustpilot removed 4.5 million fake reviews in 2024, representing 7.4% of its incoming feedback 30.
The methodology of handling suspected fake reviews heavily influences consumer trust in the hosting platform. Research from Carnegie Mellon University reveals that covertly deleting fraudulent reviews - a common practice among major tech portals - is suboptimal. Instead, platforms that publicly display suspected fraudulent reviews alongside nonfraudulent ones, paired with a clear warning notation, increase consumer trust in the portal by 80% 34. Transparency regarding fraud management is viewed by users as a stronger signal of integrity than presenting an artificially sanitized environment.
Empirical Measurement of Social Proof Impact
To isolate the precise financial value of reviews and trust badges, advanced organizations employ rigorous statistical testing rather than relying on observational correlation. The standard methodology is the Conversion Lift Study (CLS), an incrementality experiment modeled after randomized controlled trials in medicine 35.
Incrementality and Conversion Lift Studies
In a Conversion Lift Study, an audience is split into two distinct groups: a treatment group exposed to the social proof (the reviews, badges, or specific ad campaigns) and a control group deliberately held out and shown a sterile version of the asset 3536. By comparing the downstream conversion rates, marketers calculate the "lift" - the exact percentage of conversions directly caused by the presence of the social proof, eliminating external variables like seasonality or organic brand growth 3647. Metrics evaluated include Incremental Conversions, Incremental Cost Per Action (iCPA), and Incremental Return on Ad Spend (iROAS) 36.
Overcoming Data Decay and Tracking Limitations
A critical vulnerability in these studies is data decay and browser-based tracking limitations. Browser setups can miss 10% to 30% of conversions due to privacy blockers and cookie deprecation, which introduces severe bias into the lift calculation 35. To ensure the empirical validity of social proof ROI, modern implementations utilize server-side tracking, feeding clean, unbiased data directly via platform APIs to establish the definitive ground truth 35. This data then calibrates broader Marketing Mix Modeling (MMM) frameworks 35.
Furthermore, data decay poses a massive threat to baseline measurement. In the B2B sector, contact databases experience catastrophic decay rates of up to 70.3% annually, with 65.8% of contacts experiencing job title changes and 42.9% acquiring new phone numbers every twelve months 48. Email lists decay at 28% annually 48. Outreach and conversion testing relying on decayed data drastically artificially lowers observed conversion rates, confounding the perceived effectiveness of the trust signals themselves. Maintaining pristine data hygiene is therefore a prerequisite for accurately measuring the psychology of social proof.
Conclusion
The psychology of social proof in digital commerce is not merely a byproduct of herd mentality; it is a complex, rational adaptation to the information asymmetry inherent in online environments. The empirical evidence demonstrates that consumer trust is highly conditional. While an influx of review volume exponentially increases the likelihood of conversion, this accumulated trust is highly volatile, decaying rapidly if not continuously refreshed within a 90-day window.
Furthermore, the deployment of trust signals must be surgically aligned with the specific anxieties of the target demographic. Security badges that reassure female shoppers may hold less weight with male counterparts, and peer consensus that drives retail purchases will fail to secure enterprise B2B contracts without the backing of verifiable client logos and institutional certifications. As the proliferation of AI-generated content continues to threaten the fundamental credibility of textual reviews, the future of social proof will likely pivot toward zero-party data, authenticated visual proof, and highly transparent platform fraud management policies. Organizations that treat social validation as a continuous, culturally calibrated strategic asset will inherently command the highest conversion efficiencies in an increasingly skeptical digital marketplace.