Psychology of Price Anchoring, Charm Pricing, and Decoy Effects 2026
The study of pricing psychology encompasses the intersection of behavioral economics, cognitive biases, and market dynamics. In 2026, the application of psychological pricing has evolved from static numerical heuristics into highly segmented, dynamic, and algorithmically driven frameworks. While foundational mechanisms such as the left-digit bias, price anchoring, and asymmetric dominance continue to govern individual consumer choices, the modern commercial environment has introduced complex new variables. These include widespread subscription fatigue, the breakdown of legacy business-to-business software pricing due to artificial intelligence, cultural divergences in numerical perception, and a severe regulatory backlash against algorithmic price individualization. Understanding these intersecting forces requires a synthesis of experimental consumer psychology, macroeconomic data, and evolving legal frameworks.
Foundational Cognitive Biases in Pricing
Consumer purchasing behavior is rarely governed by strict mathematical rationality. Instead, consumers rely on cognitive heuristics and perceptual shortcuts to evaluate value, affordability, and utility. The manipulation of these heuristics forms the basis of psychological pricing.
The Left-Digit Bias and Charm Pricing Mechanics
Charm pricing, widely known as odd pricing, is the practice of ending prices with digits such as .99 or .95 rather than rounding to the nearest whole number. The efficacy of this strategy is rooted in a cognitive phenomenon known as the left-digit effect. Because individuals read and process numbers from left to right, the brain encodes the magnitude of a price as soon as the eye encounters the leftmost digit 123. Consequently, a price of $19.99 is perceptually anchored in the "teens" rather than the "twenties," creating an outsized perception of affordability relative to a mere one-cent difference 456. Meta-analyses of consumer purchasing data indicate that charm pricing can increase retail sales volume by approximately 24%, with some empirical experiments demonstrating demand increases as high as 35% to 60% depending on the specific retail context and product category 78.
However, recent studies in the Journal of Marketing Research indicate that the left-digit bias is subject to specific boundary conditions based on cognitive load and presentation format. Research demonstrates that the bias is significantly stronger in "stimulus-based" evaluations, where consumers see a focal price and a reference price side-by-side 1. In these scenarios, consumers rely on perceptual representations without rounding the numbers. Conversely, the effect diminishes in "memory-based" evaluations, where a consumer must retrieve a reference price from memory. This retrieval prompts the brain to rely on conceptual representations, which naturally rounds the numbers up and neutralizes the charm pricing advantage 1. Visual presentation also plays a role; adding physical spatial distance between a regular price and a discounted charm price causes the numerical gap to feel larger to the consumer, further amplifying the perceived deal 3.
Furthermore, the utility of charm pricing is highly context-dependent. While it is highly effective for fast-moving consumer goods, impulse buys, and budget-conscious demographics, it can actively harm brand equity in the luxury sector. For premium positioning, "round pricing" is utilized. Round numbers, such as $500 instead of $499.99, require less cognitive processing, which generates a feeling of fluency that consumers unconsciously associate with prestige, intentionality, and high quality 145234.
Price Anchoring and Reference Dependence
Price anchoring exploits the human tendency to rely disproportionately on the first piece of information encountered when making a decision 756716. By establishing an initial high reference price, subsequent prices appear inherently more reasonable 45818. This is commonly executed through crossed-out manufacturer's suggested retail prices, introductory premium product tiers, or multiple-unit pricing strategies, such as offering items at "2 for $4" rather than "$2 each" 1920.
The efficacy of anchoring is robust, with field experiments showing it can increase perceived value by up to 32% 819. In retail environments, empirical research indicates that anchoring dominates consumer evaluations much more heavily than secondary framing effects, proving that the initial numerical anchor acts as the primary mental benchmark 1821. The mechanism driving this behavior is loss aversion, combined with the "sticker shock" formulation of reference-dependent choice models. Consumers evaluate choice alternatives using differences between shelf prices and their internal reference prices, weighing losses from a reference point much more heavily than equivalent gains 910.
Anchoring also dictates behavior in high-stakes markets like real estate and business-to-business negotiations, where round-number focal points serve as rigid cognitive thresholds. During market downturns, sellers often exhibit intense loss aversion when adjusting prices away from prior high anchors, resulting in prolonged listing periods and market inefficiencies 11. Similarly, in negotiations, past prices disproportionately influence future anchoring, creating qualitative differences in how buyers perceive outcomes below a reference point versus those at or above it 12. However, price anchoring carries risks; if an initial anchor is perceived as artificially inflated or deceptive, it can trigger consumer backlash and erode long-term brand trust 1913.
Asymmetric Dominance and the Decoy Effect
The decoy effect, formally termed asymmetric dominance, involves the introduction of a third, intentionally inferior option to a choice set to alter preferences between two target options 5771415. The decoy is designed to be completely dominated by the target option, but only partially dominated by the competitor option. Because human beings struggle to judge absolute value in isolation, the decoy provides a relative baseline that makes the target option appear to be a significantly superior value 141516.
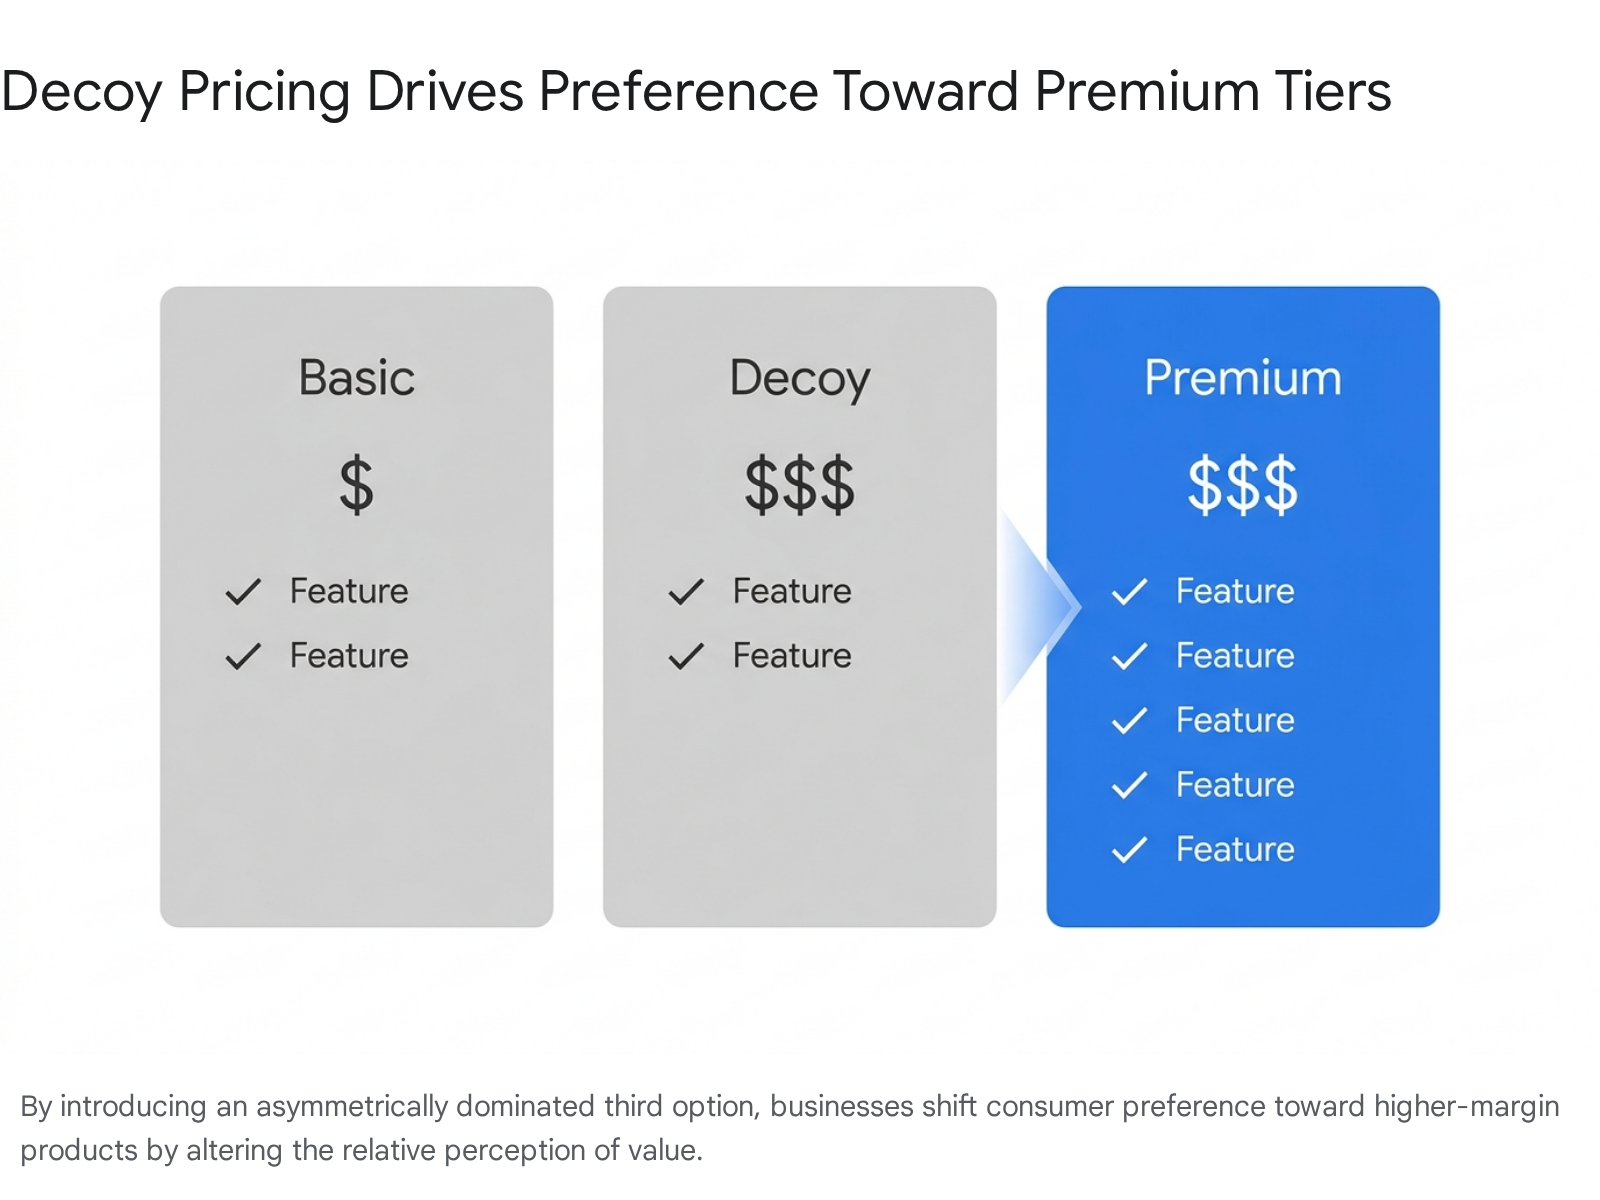
Meta-analyses synthesizing decades of choice architecture research confirm that the presence of a decoy increases the likelihood of a consumer selecting the target option by 12% to 18% 17. This effect is closely related to "extremeness aversion," a robust phenomenon where the same product is 29% to 88% more likely to be chosen when it is positioned as an intermediate compromise option within a choice set rather than an extreme outlier 18.
Despite its prevalence, recent replication studies have identified critical boundary conditions for asymmetric dominance. The decoy effect is highly prone to failure - and can even trigger a reversal known as the "repulsion effect" - if all alternatives within the choice set are perceived as undesirable or low-quality. When consumers view the domain negatively, they switch to a more vigilant cognitive processing style, which neutralizes the relative advantage provided by the decoy and depresses the selection of the target option 1719. Furthermore, longitudinal studies published in the mid-2020s highlight a distinct tradeoff in post-choice consumer behavior. While choice architecture nudges successfully increase the initial selection rate of a targeted option, they frequently result in a decrease in long-term consumption or utilization of that option. Consumers nudged into a higher tier via a decoy exhibit lower post-acquisition commitment compared to those who arrived at their choice unprompted, raising serious concerns for business models heavily reliant on long-term retention and engagement 20.
Macroeconomic and Electronic Commerce Pricing Dynamics
When cognitive biases are deployed at scale in digital environments, their interactions with broader macroeconomic conditions, such as inflation, reveal distinct behavioral patterns in price elasticity.
Price Elasticity and Dynamic Pricing Tradeoffs
In 2026, dynamic and algorithmic pricing in electronic commerce demonstrates both significant revenue potential and heightened consumer friction. A comprehensive study encompassing 36 months of panel data from 89 United States online retailers analyzed the cross-category impacts of various pricing strategies under inflationary pressure 34. The aggregate price elasticity of demand across digital retail is estimated at -1.34, though this exhibits pronounced cross-category heterogeneity. Electronics demonstrate highly elastic demand at -1.72, while fashion categories show relatively inelastic behavior at -0.89 34.
The implementation of dynamic pricing algorithms raises overall revenue by an average of 12.3%, but simultaneously increases cart abandonment rates by 8.7% 34. This reveals an inverted-U relationship between pricing intensity and net financial gains, indicating that over-optimization can trigger consumer exhaustion and transaction abandonment. Furthermore, promotional frequency exhibits diminishing returns when exceeding three events per quarter. During high-inflation quarters, consumers shift their purchasing behavior markedly toward value-segment retailers, prioritizing absolute cost over relative discounts 34.
Efficacy Comparison of Core Pricing Tactics
To accurately deploy psychological pricing, businesses must align the specific cognitive bias with the corresponding target market and desired outcome. The following table summarizes the primary mechanisms, performance impacts, and boundary conditions of foundational pricing strategies.
| Pricing Strategy | Primary Cognitive Mechanism | Average Performance Lift | Optimal Application Context | Boundary Conditions & Risks |
|---|---|---|---|---|
| Charm Pricing (Left-Digit) | Magnitude encoding; anchoring on leftmost integer 3. | 24% to 35% increase in conversion rates 8. | Budget retail, fast-moving consumer goods, impulse buys 27. | Dilutes brand equity in luxury markets; weaker in memory-based recall 12. |
| Round Pricing | Cognitive fluency; straightforward processing 12. | Increased trust; supports higher LTV in premium segments. | Luxury goods, enterprise B2B software, premium services 143. | Signals high cost; reduces conversion among highly price-sensitive shoppers. |
| Price Anchoring | Reference dependence; relative evaluation against an initial high value 812. | 32% average increase in perceived value 8. | Discount framing, real estate, software landing pages 451113. | Can erode brand trust if the initial anchor is perceived as artificially inflated 19. |
| Decoy Effect | Asymmetric dominance; context-dependent valuation 1415. | 12% to 18% preference shift toward the target option 17. | Subscription tiers, product bundles, menu engineering 5716. | Fails completely if all options are fundamentally unattractive or low-quality 19. |
Subscription Economics and Consumer Behavior
The theoretical principles of pricing psychology manifest uniquely in recurring revenue models. As the subscription economy has matured, consumer tolerance for specific pricing architectures has fundamentally shifted.
Subscription Fatigue and the Shift to Flexibility
By 2026, the global subscription economy reached an estimated $492 billion and is projected to scale to $1.51 trillion by 2033 35. However, the overwhelming success of the model has generated a severe counter-reaction known as subscription fatigue. Exhausted by the cognitive load of managing multiple recurring payments and frustrated by continual price increases, approximately 41% to 47% of consumers report feeling overwhelmed 353621. Furthermore, over 50% of consumers state they have recently canceled at least one service, and 60% indicate they would immediately cancel a streaming service in response to a simple $5 price increase 35362223. This fatigue creates a state of "learned helplessness" in the short term, but ultimately culminates in high voluntary churn when consumers reassess their discretionary income 40.
In response to this widespread fatigue, pricing psychology in the application ecosystem has shifted away from emphasizing absolute financial savings and toward emphasizing psychological safety and maximum flexibility. Analyzing $1.9 billion in revenue across 11,000 applications, market data indicates that weekly subscription plans have experienced massive growth, capturing roughly 47% of all app subscription revenue in 2026 24. Despite being mathematically more expensive when annualized compared to a traditional yearly lock-in, weekly plans dominate because they significantly lower the perceived risk of commitment, providing an easy and immediate exit option for anxious consumers 2224. Additionally, pause functionalities, which allow users to temporarily suspend billing rather than cancel entirely, have seen usage increases of 337%, serving as a critical infrastructure requirement for modern retention 3536.
Trial Psychology and Conversion Thresholds
The mechanics of trial psychology and paywall presentation have also been completely revised. Industry data encompassing over 115,000 mobile applications reveals that 89.4% of all trial starts occur on the day of initial installation 21. Consequently, "hard paywalls" - which force a subscription decision immediately on Day 0 before core features are accessed - convert at a median rate of 10.7% by Day 35 3521. By contrast, traditional freemium models convert at only 2.1%.
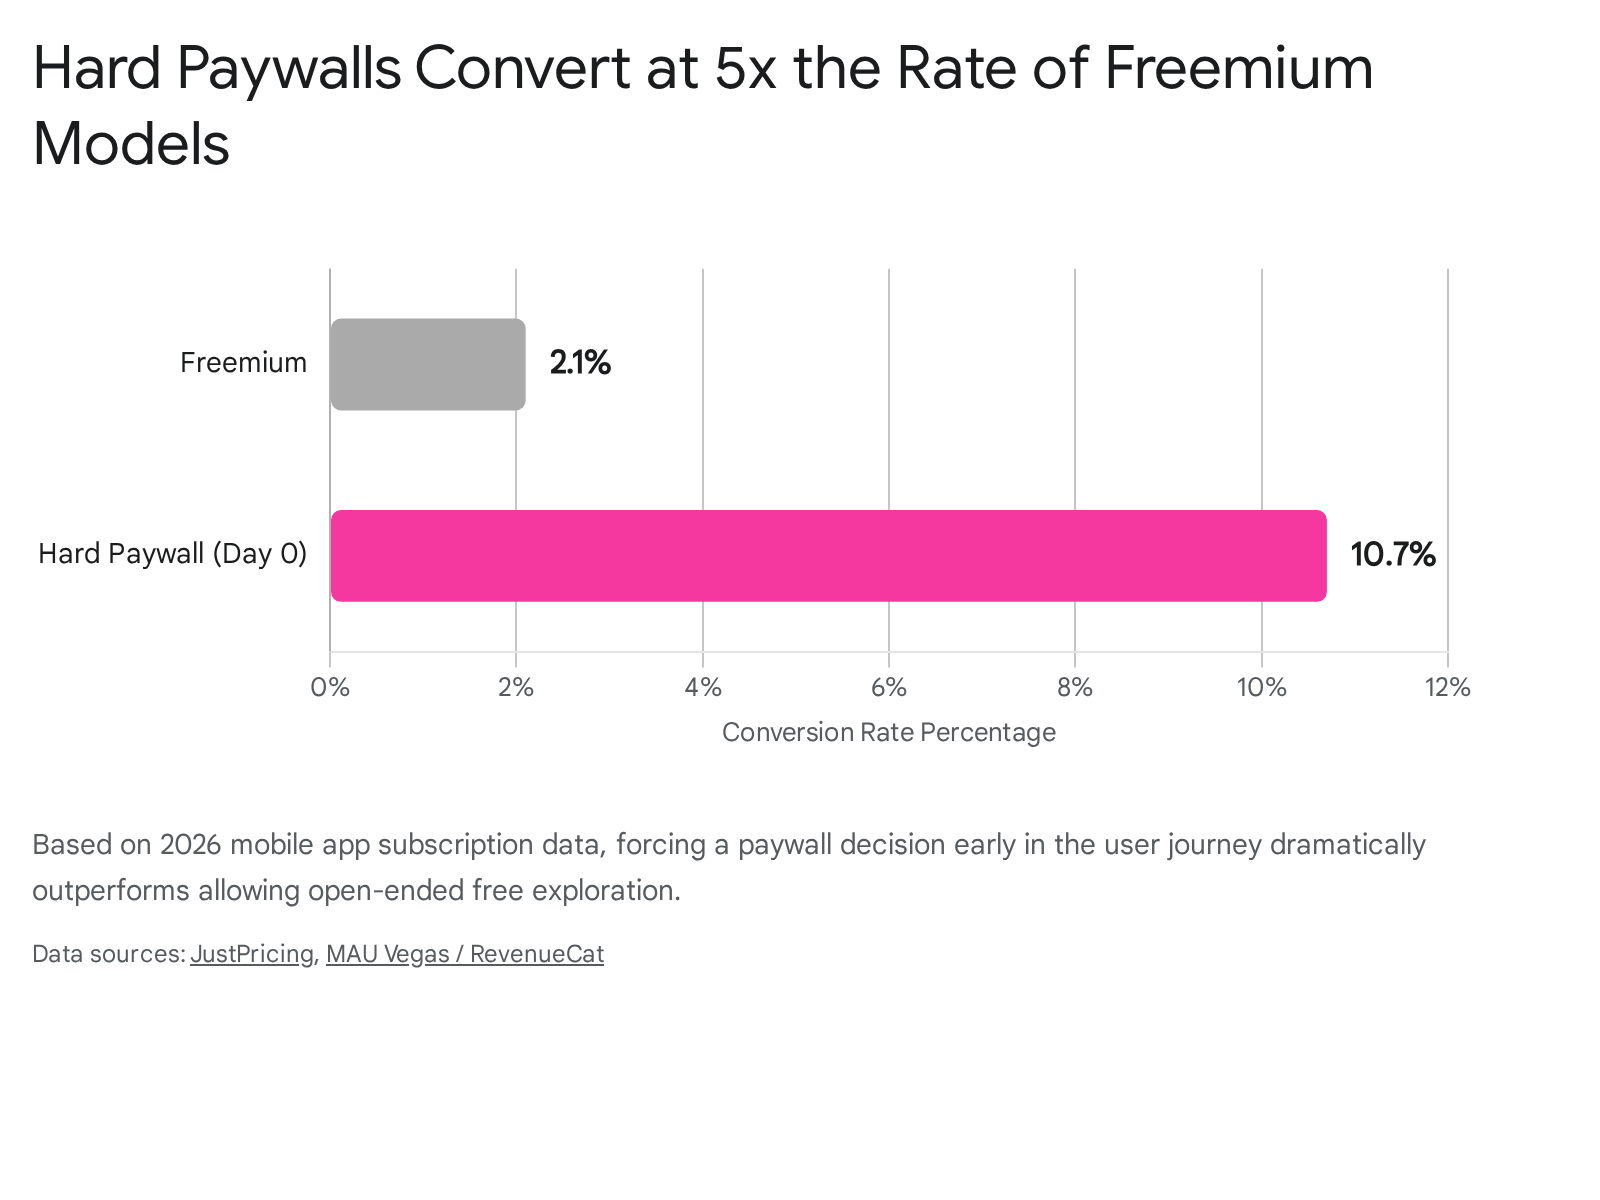
Presenting the price immediately capitalizes on peak user intent and avoids the decay of interest that inevitably occurs when value is provided for free indefinitely 21.
Platform integration strategies also play a vital role in justifying software pricing and ensuring retention. Research from ProfitWell analyzing 500,000 subscription companies found that products with at least one external software integration feature 10% to 15% higher retention rates. For products boasting four or more integrations, retention improves by 18% to 22%, and consumer willingness to pay increases by over 30% 42. Deep integration elevates the cost of switching providers, creating formidable financial and psychological barriers that cement the recurring revenue model 4042.
Evolution of Business-to-Business Pricing
In the business-to-business sector, the psychological evaluation of software pricing has been radically upended by the integration of artificial intelligence and shifting procurement mentalities.
Decline of Per-Seat Models and AI Productivity
Historically, Software-as-a-Service platforms relied heavily on the "per-seat" or per-user pricing model. However, by 2026, pure per-seat pricing has collapsed, representing only 15% of the total market, a steep decline from just twelve months prior 43. The psychological and economic driver of this collapse is the artificial intelligence productivity paradox. When an automated AI agent or copilot performs the workflow of five human employees, charging an enterprise on a per-seat basis fundamentally misaligns the cost of the software with the value it delivers. It inadvertently punishes the customer for becoming efficient and deprives the vendor of revenue for the actual automation value provided, while failing to cover the variable compute costs associated with AI 4344.
As a result, B2B procurement teams, operating with heightened rationality and extreme risk aversion compared to B2C consumers 25, now demand outcome-based transparency. Consequently, 61% of SaaS providers in 2026 utilize hybrid pricing models 43. These models typically combine a flat platform fee - which serves to anchor the baseline hosting and support costs - with usage-based variables such as API calls, computations executed, or distinct business outcomes achieved 432526.
Financial Planning and Cohort Analytics
The structural shift in B2B pricing has altered how companies approach enterprise sales and financial planning. Because enterprise buyers navigate complex political dynamics and fear the social risk of championing a failing tool, the primary competitor in SaaS sales is no longer a rival company, but the psychological pull of the "status quo bias" . Sales professionals must act as change therapists, utilizing intuitive visuals and data-driven return on investment demonstrations to reframe high-ticket proposals. By establishing the premium tier as the initial anchor, vendors can gently guide risk-averse buyers toward high-value agreements while mitigating sticker shock 26.
From an operational standpoint, venture capital frameworks, such as those popularized by Point Nine Capital, emphasize that the type of business model dictated by pricing - whether hunting millions of small "mice" or a few high-value "elephants" - determines the entirety of a company's go-to-market strategy 482728. Analyzing cohort performance requires segment-specific rigor; blending metrics across pricing tiers masks critical vulnerabilities. In the toughened fundraising environment of 2026, achieving a balance of growth and efficiency requires demonstrating distinct, scalable customer acquisition channels tied explicitly to value-based pricing metrics 272829.
Cultural Variations in Numerical Perception
A critical failure point in international pricing strategies is the assumption that numerical psychology is universally uniform. The cognitive response to specific numbers varies profoundly across cultural lines, primarily driven by localized linguistics and historical superstitions.
Tetraphobia and Digit Avoidance in Asian Markets
In many East Asian markets, including China, Japan, and South Korea, the number 4 is subject to a phenomenon known as tetraphobia - a severe cultural avoidance of the digit. The phobia stems from linguistic homology; in several dialects of Chinese, as well as in Sino-Korean and Sino-Japanese vocabulary, the pronunciation of the number 4 is nearly homophonous with the word for "death" (e.g., sì and sǐ in Mandarin, sa in Korean, shi in Japanese) 52533055.
This superstition deeply impacts consumer pricing, infrastructure, and commerce. Products priced with 4s face heavy cognitive friction, inducing anxiety, and are often perceived as unlucky or highly undesirable 5230. The avoidance extends far beyond retail pricing into real estate - where apartment units or building floors featuring the number 4 suffer from measurably lower property values and are routinely omitted from elevator panels - and logistics, where Asian supply chain entities actively adjust metrics and dates to avoid the digit 52305556. Global e-commerce vendors exporting to these markets must sanitize their pricing architectures to ensure the digit 4 is systematically removed from prominent tiers, as failing to do so signals cultural ignorance and depresses conversion rates.
High-Context Versus Low-Context Numerical Preferences
Beyond tetraphobia, Asian markets - often characterized as high-context cultures - exhibit differing preferences for ending digits compared to Western markets, which operate as low-context cultures. While charm pricing utilizing the number 9 is overwhelmingly prevalent in the United States and Europe, it is viewed with suspicion in many high-context cultures 57. In the United States, 9 is the most frequently used last decimal place, appearing in 46.5% of prices, and acts as the most common first decimal place at 52.2% 857. However, in high-context cultures, the illusion of a special offer generated by a 9-ending is frequently perceived as manipulative, eroding trust in the brand 57.
Instead, high-context cultures demonstrate a strong preference for rounded prices ending in 0, which signal safety, stability, and transparency. In Japan, the ending digit 0 is used in 91.7% of consumer prices 57. Additionally, the number 8 is heavily utilized in Chinese and Japanese pricing architectures (e.g., pricing products at $88) due to its strong cultural and symbolic association with prosperity, good fortune, and wealth, frequently appearing as the first decimal place in 37.5% of Japanese prices 57.
Regulatory Environment for Algorithmic Pricing
As pricing mechanisms have transitioned from static shelf tags to dynamic, algorithmically generated individual quotes, consumer protection agencies and lawmakers have forcefully intervened. The psychological unease consumers feel regarding dynamic pricing - specifically the fear of surveillance, loss of autonomy, and perceived unfairness - has crystallized into strict legal frameworks by 2026.
State-Level Algorithmic Pricing Disclosure Laws
Historically, dynamic pricing was constrained primarily by the free market's tolerance for shifting prices. However, the use of highly granular personal data, such as precise location tracking, demographic inferences, and even real-time mouse movements, to generate personalized price points sparked a national backlash 31. While personalized pricing is not inherently illegal under legacy antitrust frameworks, regulatory chairs have noted that the psychological perception of extreme unfairness undermines foundational trust in digital marketplaces 31.
To combat this, sweeping legislative actions have taken effect across the United States. New York's Algorithmic Pricing Disclosure Act, fully effective as of late 2025, mandates that any non-exempt business utilizing consumer personal data to algorithmically set prices must display a conspicuous, all-caps disclosure at or near the price: "THIS PRICE WAS SET BY AN ALGORITHM USING YOUR PERSONAL DATA" 31323334. The law carries civil penalties of up to $1,000 per violation. This mandate forces total transparency, significantly altering the conversion dynamics of targeted pricing by introducing severe cognitive friction and skepticism exactly at the point of sale 3233. Furthermore, the New York legislature has moved to pass the "One Fair Price Package," aiming to impose an outright ban on surveillance-based pricing in broader contexts and outlawing algorithmic rent price collusion 3435.
Antitrust Reforms and Federal Enforcement Actions
California has also moved aggressively against automated pricing structures. Effective January 1, 2026, California implemented Assembly Bill 325, creating the most comprehensive state-level regulatory framework for algorithmic pricing to date. The legislation amends the Cartwright Act to explicitly prohibit the distribution or use of a "common pricing algorithm" where competitors pool data to align or stabilize prices 333435. Crucially, the California law dramatically lowers the procedural pleading standard for antitrust plaintiffs, allowing litigation to proceed simply if it is plausible that price coordination occurred via the use of shared data software, without requiring proof of overt collusion 3335.
The regulatory landscape is shifting from mere disclosure to active, punitive enforcement. In early 2026, the California Attorney General launched a massive surveillance pricing sweep targeting the grocery, travel, and retail sectors, citing concerns that algorithmic pricing violates the California Consumer Privacy Act by utilizing consumer data in ways that exceed reasonable privacy expectations 3132. Furthermore, the United States Federal Trade Commission (FTC), following a 6(b) market study into the psychological and economic risks of surveillance pricing, has opened active probes into the corporate use of artificial intelligence-driven price individualization 3132.
For modern enterprises, mastering the psychology of pricing requires navigating a fragile, high-stakes equilibrium. Organizations must carefully leverage behavioral economics and dynamic software to maximize revenue capture, while simultaneously maintaining ethical transparency and avoiding manipulative dark patterns that trigger consumer outrage and severe regulatory penalties.