Product-Led Growth Effectiveness and Market Performance
The software-as-a-service market has undergone a fundamental restructuring in its go-to-market strategies between 2021 and 2026. Following a macroeconomic shift that ended an era of highly accessible venture capital and unchecked growth expenditure, software vendors have been forced to reevaluate how they acquire, activate, and retain users. This correction period, frequently referred to in market analyses as the great recalibration, has exposed the structural vulnerabilities of operating inefficient distribution models 1. Within this context, product-led growth emerged as a dominant methodology designed to minimize acquisition friction by utilizing the software itself as the primary engine for customer acquisition and expansion 23. However, as longitudinal market data demonstrates, pure product-led models face distinct structural limitations when scaling into enterprise segments, necessitating a transition toward hybrid sales architectures 14. This analysis examines the empirical data surrounding product-led growth, detailing its unit economics, conversion benchmarks, retention metrics, and the environmental factors that dictate its success or failure.
Foundational Economics of Software Growth Models
The transition from traditional sales-led growth to product-led growth represents a shift in how capital is deployed across the organizational structure. In a sales-led model, human intervention - via sales development representatives and account executives - is strictly required to demonstrate value, navigate corporate procurement, and close deals 45. In a product-led model, the product is engineered to deliver value immediately, allowing users to discover, adopt, and purchase the software via automated, self-serve pathways 6. The economic viability of either model is ultimately judged by the efficiency of customer acquisition and the subsequent payback period.
Customer Acquisition Cost and Payback Efficiency
The macroeconomic environment of 2024 and 2025 exposed significant inefficiencies in pure outbound sales models, leading to a systemic crisis in marketing economics for mid-tier vendors. The median new-customer acquisition cost ratio increased by 14% in 2024 to $2.00, meaning the median business-to-business software company spent $2.00 in sales and marketing expenses to acquire $1.00 of new annual recurring revenue 177. For companies in the bottom performance quartile, this figure rose to $2.82, highlighting a severe deterioration in unit economics 7.
Consequently, payback periods - the time required to recover the cost of acquiring a customer - have stretched considerably. The average payback period for private software companies has reached 20 to 23 months, a sharp departure from historical benchmarks of 12 to 14 months established during the peak growth era of 2021 178. Companies are effectively operating at a loss on new customers for nearly two years before reaching profitability on those accounts 7. Early-stage startups and highly inefficient organizations are experiencing payback periods between 36 and 48 months, which is often unsustainable without continuous external funding 8.
Product-led growth directly addresses these unit economics by eliminating the human touchpoint from the initial transaction 5. By shifting the burden of acquisition from sales personnel to the product experience, product-led models can lower the customer acquisition cost to an average of $200 to $2,000 for self-serve users, reducing the payback period to 3 to 12 months 5. However, the efficiency gained in sales and marketing is frequently counterbalanced by the heavy research and development expenditure required to maintain a consumer-grade, highly intuitive product experience capable of driving organic adoption 1. Furthermore, customer acquisition costs vary significantly by industry due to the complexity of the underlying workflows and regulatory environments.
| Industry Vertical | Average CAC Payback Period (SMB) | Average CAC Payback Period (Mid-Market) | Average CAC Payback Period (Enterprise) |
|---|---|---|---|
| Financial Services | 14 months | 18 months | 22 months |
| Proptech | 5 months | 8 months | 19 months |
| Retail & eCommerce | 10 months | 19 months | 31 months |
| Security & Compliance | 8 months | 13 months | 25 months |
| Transportation & Logistics | 7 months | 11 months | 21 months |
The data above, drawn from aggregate marketing analyses, demonstrates that software categories requiring high trust, regulatory compliance, or complex physical integration naturally extend the time to revenue, making pure self-serve acquisition highly challenging 79. Financial services and wealth management software, for instance, frequently face acquisition costs ranging from $2,167 to $4,056 per customer, whereas lightweight retail applications can acquire users for approximately $50 7.
Annual Contract Value and Unit Economic Constraints
The viability of a growth motion is structurally tied to the software's annual contract value. Empirical data establishes clear thresholds that determine where product-led strategies operate optimally and where they structurally fail due to market misalignment 5.
When a product costs less than $15,000 annually, deploying a traditional enterprise sales force actively destroys unit economics 5. If an organization maintains an annual contract value of $5,000 but incurs a fully loaded acquisition cost of $10,000 through a direct sales team, the resulting 24-month payback period is rarely tolerated by capital markets 5. In these environments, product-led growth is a structural requirement. The product must possess individual user value, allowing a single professional to extract utility without demanding immediate company-wide adoption 5.
Conversely, enterprise contracts exceeding $50,000 to $100,000 per year easily justify the cost of a sophisticated sales organization 5. At a $100,000 annual contract value, a fully loaded acquisition cost of $30,000 yields an exceptionally healthy four-month payback 5. At this scale, buyers inherently demand custom integrations, rigorous security compliance audits, and multi-stakeholder approval processes that cannot be executed through a self-serve credit card portal 41110. As average sale prices increase, adding a sales force helps buyers navigate complex decision-making frameworks 11. Between these extremes sits the mid-market territory - typically $15,000 to $25,000 annually - where hybrid models dominate. Here, product-led motions provide efficient top-of-funnel acquisition, while internal sales teams intervene to convert high-intent users into broader organizational deployments 514.
Conversion Architecture and Funnel Benchmarks
In product-led business models, the website interface and the product onboarding experience function collectively as the primary revenue engine. Conversion benchmarks reveal stark performance disparities based on how a vendor structures its initial offering: freemium access, opt-in free trials, or opt-out free trials.
Freemium Versus Free Trial Methodologies
The freemium model offers perpetual access to a restricted subset of features. It maximizes top-of-funnel acquisition and overall product distribution but typically yields an exceptionally low conversion rate to paid tiers 12. Traditional freemium models achieve a robust visitor-to-freemium signup rate of approximately 13.3%, largely due to the complete absence of financial risk for the user 12. However, only 2.6% to 5% of those accumulated users eventually upgrade to a paid account 1213. Top-quartile freemium products may occasionally reach 8% to 12% conversion, but the vast majority of freemium offerings successfully satisfy a segment of users permanently, eliminating their incentive to monetize 1213.
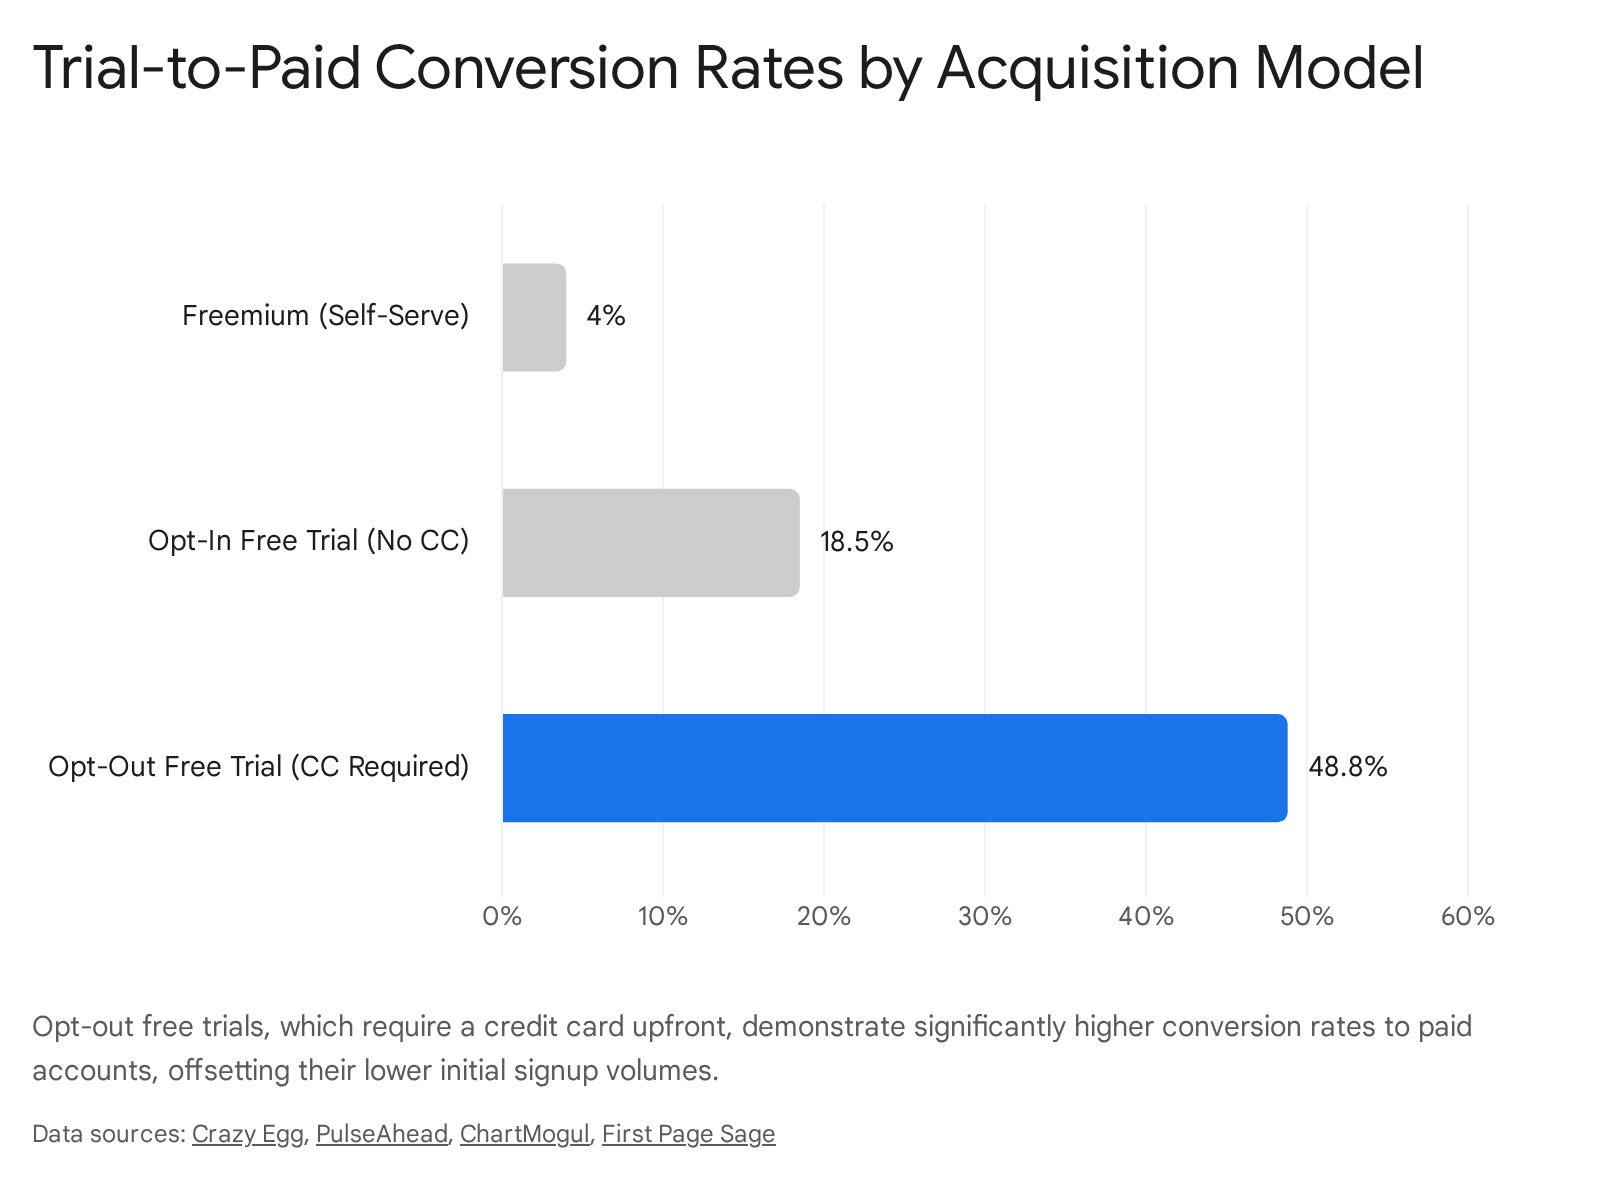
Free trials, by contrast, offer full premium functionality for a strictly limited duration, forcing a definitive purchase decision when the trial period expires. Trial models consistently outperform freemium models in end-to-end monetization. Within the trial ecosystem, the requirement of a credit card creates a massive variance in funnel performance and user intent 12.
Opt-in trials, which do not require a credit card upfront, boast a relatively high visitor-to-trial conversion rate of 8.5% because the barrier to entry remains low 1718. However, because these users are not financially committed and the trial does not automatically convert, the subsequent trial-to-paid conversion rate averages between 8.9% and 18.5%, depending on the specific product category and market maturity 1914.
Opt-out trials require payment information prior to accessing the software. This friction drastically reduces initial signups, dropping the visitor-to-trial conversion rate to a mere 2.5% 1718. However, the trial-to-paid conversion rate for these highly qualified users typically reaches 31.4% to 48.8% 121814. The billing event triggers automatically unless the user proactively navigates the cancellation process, yielding nearly three times more paying customers from the same raw web traffic compared to opt-in models 14.
Trial Length and Time-to-Value Dynamics
The duration of the trial period and the speed at which a user realizes value are critical variables in conversion architecture. Conversions peak in the first week of usage and drop off precipitously afterward. The vast majority of conversions in the business-to-business sector occur exactly when the trial expires, typically around day seven. By day fourteen, conversion rates for both business and consumer software drop to roughly 1% 1114.
This data has prompted software vendors to systematically reduce trial lengths. While 14 days remains the most common duration (utilized by 62% of products), the median software trial is actively moving toward seven days, particularly among modern applications 111319. This compression is largely enabled by artificial intelligence. AI-powered onboarding sequences and in-product copilots enable users to bypass complex initial configurations, reducing the time required to reach the product's core value proposition from weeks to mere minutes 1113. Speed is paramount; analytics tracking across 2.5 million trial users indicates that every 10-minute delay in a user's time-to-first-value costs an organization 8% in overall conversion volume 19.
Activation Metrics and Industry Variations
The absolute strongest predictor of free-to-paid conversion is the product activation rate - the percentage of users who reach a predefined behavioral milestone that indicates they have experienced the software's utility 19. In 2025, elite software performers achieved activation rates exceeding 90% within the first two hours of usage, whereas the median company achieved only a 52% activation rate 19. This widening activation gap dictates market leadership, as top performers achieve double the activation rate of their median competitors 19.
Conversion benchmarks and activation milestones are highly context-dependent and vary heavily by software category. For developer tools, activation is typically measured by technical events such as the first API call or a successful code deployment, with elite platforms targeting 90% activation within two hours 19. For analytics and business intelligence platforms, the activation target is the creation of the first custom dashboard, with top performers expecting 85% of users to complete this in their first session 19.
When analyzing ultimate conversion to paid tiers, customer relationship management platforms achieve the highest average trial-to-paid conversion rates at 29%, followed by advertising technology at 24.3%, and human resources software at 22.7% 12. Conversely, complex enterprise software and financial technology products face severe top-of-funnel bottlenecks, converting at much lower rates (18% to 19%) due to the inherent friction of long decision cycles and the necessity of organizational buy-in 1714. Business-to-consumer software generally sees lower long-term conversion rates, averaging between 10% and 20%, though they benefit from much higher initial raw traffic volume 15.
Net Revenue Retention and Expansion Economics
While acquisition models dominate the strategic discourse during early-stage growth, market maturity data from 2024 through 2026 unequivocally establishes that retention is the primary engine for sustainable valuation and long-term capital efficiency 716. As new business growth slows across the sector, successful organizations pivot entirely to maximizing the lifetime value of their existing user base 16.
Gross Versus Net Revenue Retention Definitions
Evaluating the health of a recurring revenue business requires differentiating between Gross Revenue Retention (GRR) and Net Revenue Retention (NRR). Gross revenue retention measures the percentage of revenue retained from an existing customer cohort strictly based on renewals, explicitly excluding any expansion revenue 1718. GRR acts as a foundational measure of churn; its maximum possible value is 100%, and improvements in GRR are a necessary precursor to healthy overall growth 18.
Net revenue retention provides a more holistic view of customer value trajectory. It captures the net impact of all revenue movements, calculated by taking the beginning annual recurring revenue, subtracting churn and contraction, adding expansion revenue, and dividing the result by the beginning revenue 19. NRR includes the positive financial impact of module upsells, cross-sells, and seat expansions 1718.
A company exhibiting a 90% gross revenue retention rate but possessing a strong internal expansion motion can achieve a net revenue retention rate of 115%. This metric indicates that the company organically grows its recurring revenue by 15% annually from its existing customer base alone, independent of acquiring a single new logo 17. Attaining an NRR above 100% is widely considered the definitive benchmark for strong product-market fit and operational excellence 18.
SaaS Category Variations in Retention
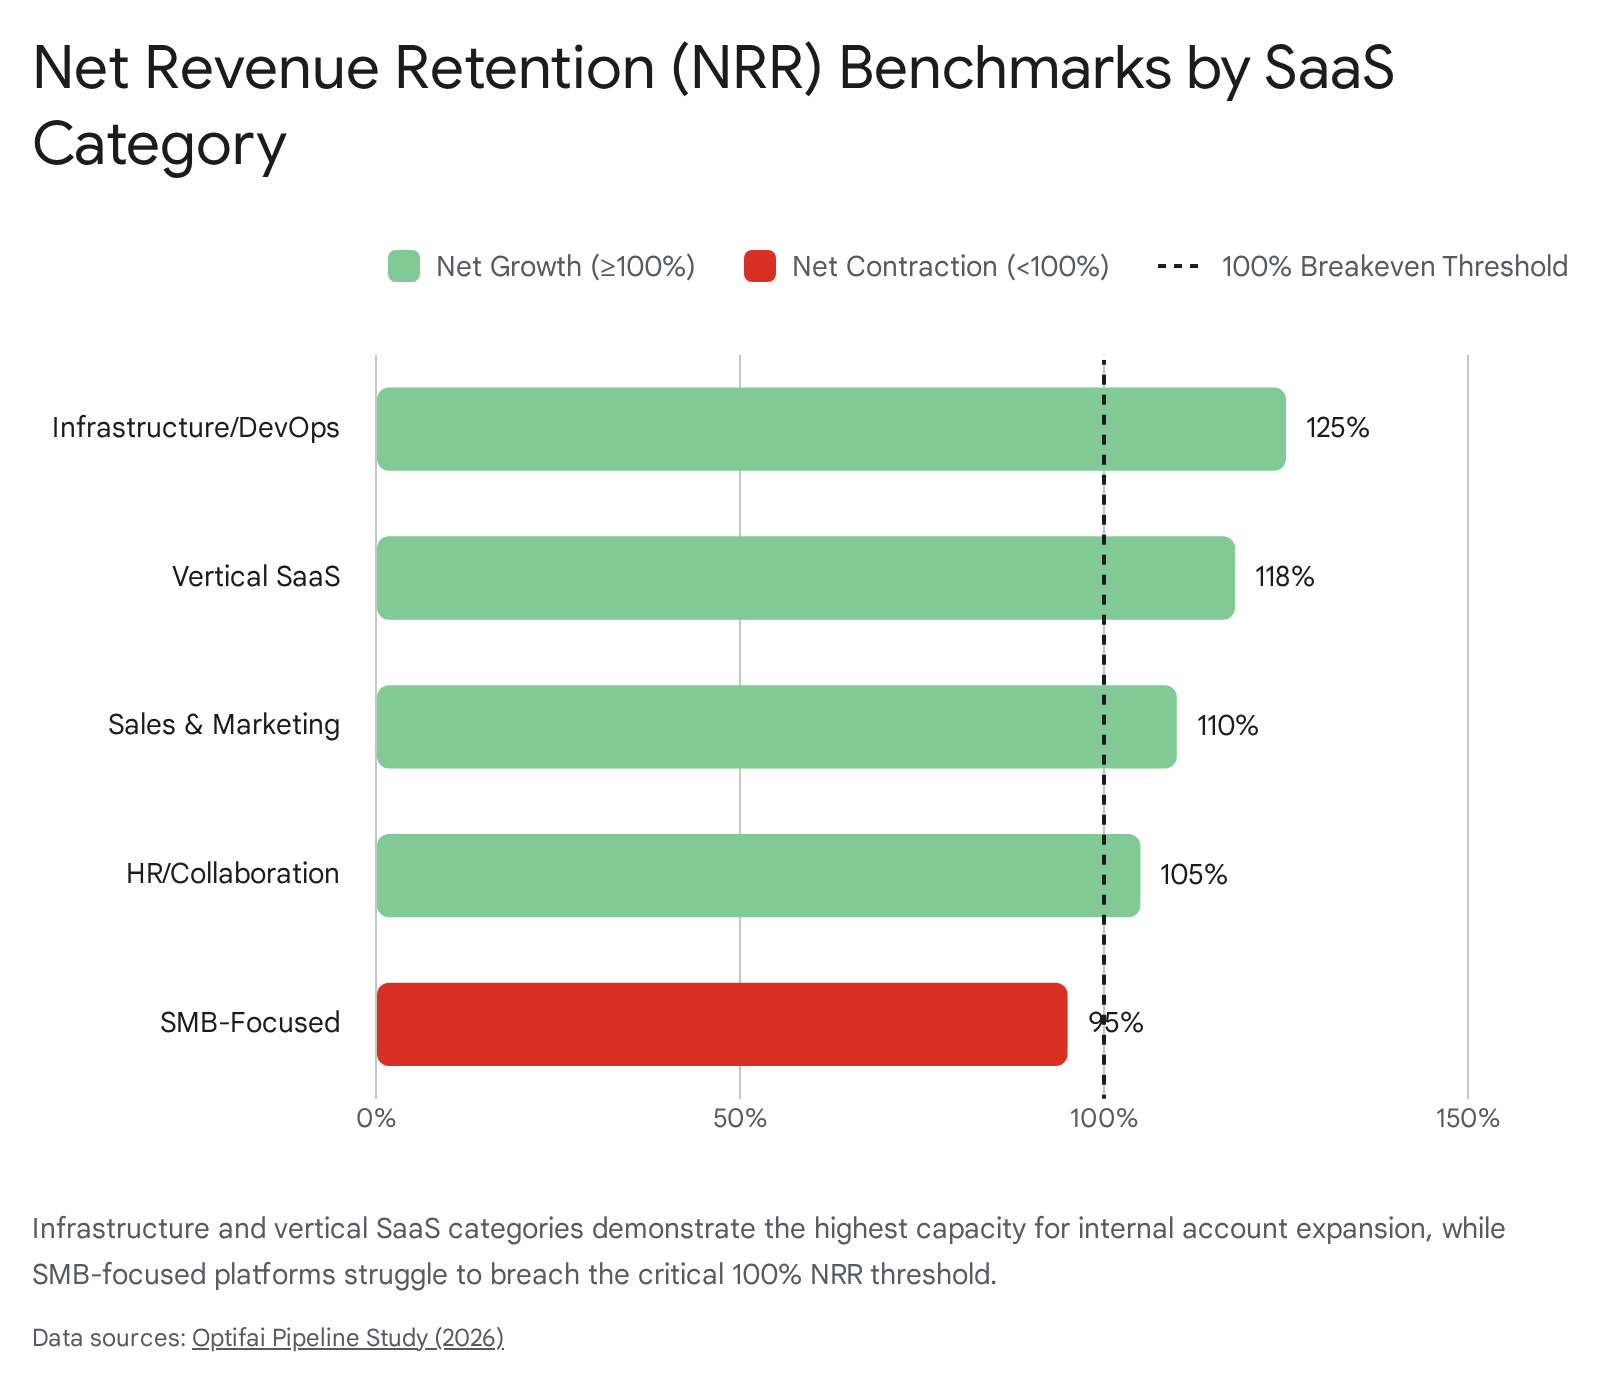
Achieving net-negative churn (an NRR over 100%) is structurally easier for some software categories than others. The nature of the product and the target customer base dictate the natural ceiling for expansion 1720.
Infrastructure and DevOps platforms routinely achieve the highest retention metrics, with median benchmarks reaching 125%, driven by usage-based pricing models that automatically scale as a client's compute or data needs grow 17. Vertical software solutions follow closely at 118%, benefiting from deep integration into highly specific industry workflows 17. Sales and marketing tools maintain a healthy 110% median NRR, while human resources and collaboration tools average 105% 17.
Conversely, products heavily focused on small and medium-sized businesses struggle with retention, recording a median NRR of just 95% 17. Small businesses have inherently higher baseline failure and churn rates, and their smaller headcount provides a significantly lower natural ceiling for seat-based expansion 17.
Expansion Dynamics and the Shift in Growth Reliance
In 2024, the median NRR across all private software companies fell to approximately 101%, representing a 4% decrease since 2021 and reflecting tighter corporate IT budgets 721. Maintaining high NRR becomes increasingly difficult as companies scale their operational footprint. Market analysis shows that top-quartile companies with up to 1,500 subscribers generally achieve 100% NRR; however, as subscriber bases exceed 12,000, median NRR tends to drop severely to 76% due to the law of large numbers 16.
Despite these headwinds, companies capable of maintaining an NRR above 106% grow 2.5 times faster than their peers 7. For scaling companies, particularly those operating in the $15 million to $30 million annual recurring revenue range, the reliance on internal expansion has increased dramatically. Expansion revenue now accounts for 40% to 50% of all new revenue for highly efficient companies, up from roughly 30% during the peak growth era of 2021 716. This structural shift indicates that retention and cross-selling are no longer secondary support functions, but rather the primary drivers of sustained corporate growth 7.
The ability to consistently drive expansion is deeply tied to the average revenue per account. Enterprise segments, characterized by contract values exceeding $100,000, achieve median NRR rates of 118%, with top-quartile performers exceeding 130% 17. The mid-market segment ($25,000 to $100,000) achieves a median of 108% 17. For businesses targeting low-value accounts, attempting to grow purely through new logo acquisition is mathematically punishing due to the prevailing $2.00 customer acquisition cost ratio 17.
Architectural Comparisons of Growth Models
The tension between bottom-up product adoption and top-down executive selling is best illustrated through distinct competitive matchups and organizational evolutions within the software sector. These case studies highlight the operational limits of specific growth philosophies.
Pure Product-Led Virality in Scheduling Software
Calendly represents the archetypal success of pure product-led growth. Founded to solve the universal friction of calendar coordination, the company scaled to an impressive $70 million in annual recurring revenue - and eventually a valuation exceeding $3 billion - without employing a single outbound salesperson 622. This was achieved through an inherent viral mechanism: the product operates as a multiplayer utility. Every time a user sends a scheduling link to a prospect or colleague, the recipient experiences the product's value proposition firsthand, effectively turning every user into a free distribution channel 622.
Calendly executed a masterful strategy of bottom-up enterprise penetration. Individual contributors and tech-savvy professionals adopted the free tier to eliminate email back-and-forth 622. The product was designed to be understood and utilized within 10 minutes, completely bypassing the need for training or demonstrations 5. As shadow IT usage spread virally across multiple departments, corporate procurement teams would eventually notice the footprint and initiate an inbound request for an enterprise consolidation contract to regain administrative control 6.
However, pure product-led growth encounters strict operational limits in the enterprise scheduling space. When sophisticated revenue teams require complex lead-to-account matching, intricate territory routing, or seamless native synchronization with enterprise platforms like Salesforce, Calendly's simplified, self-serve architecture often falls short 2923. In these complex scenarios, organizations frequently migrate to specialized, sales-led scheduling tools such as Cirrus Insight or LeanData. These platforms are explicitly built to handle deep CRM governance, capacity caps, and custom routing logic, sacrificing top-of-funnel simplicity for enterprise-grade control 2923.
The CRM Divide Between Ease of Use and Enterprise Governance
The customer relationship management market further highlights how initial growth strategies irrevocably shape product architecture and target demographics. The comparison between HubSpot and Salesforce is fundamentally a debate between product-led usability and sales-led complexity.
HubSpot originated as an inbound marketing platform heavily reliant on self-serve mechanics. It offers a genuinely useful free CRM tier, prioritizes a highly intuitive user interface, and allows non-technical business users to deploy the software and build automation workflows rapidly 312433. This architecture minimizes implementation costs and accelerates time-to-value, making it the dominant choice for mid-market companies with 50 to 200 employees 24. However, as businesses scale, HubSpot's pricing structure - particularly its "success tax" which increases costs as a company's marketing contact database grows - can become prohibitively expensive, and its customization limits become apparent for highly complex organizations 2433.
Salesforce, conversely, is the quintessential sales-led enterprise platform. With an average deployment requiring certified external implementation partners, months of setup, and dedicated, high-salaried administrators (often costing $70,000 to $100,000 annually), Salesforce is explicitly built for extreme customization and strict data governance 31243334. It lacks a free tier, and its entry price point routinely reaches $159 per user per month for the Enterprise edition, compounded by costly artificial intelligence add-ons like Agentforce 2435. Yet, for organizations exceeding 200 users, operating in highly regulated industries, or managing complex business hierarchies, Salesforce remains the only viable option. Its architecture allows for deep field-level permissions, custom objects, and advanced compliance guardrails that a simplified, usability-focused tool cannot support 243336.
Standalone Product Distribution Versus Bundled Enterprise Sales
The intense competition between Slack and Microsoft Teams perfectly illustrates the vulnerability of a standalone product-led application when facing an entrenched, top-down enterprise distribution network.
Slack revolutionized workplace communication through a textbook product-led motion. The platform focused relentlessly on design aesthetics, frictionless usability, and a massive ecosystem of developer integrations 2538. It grew rapidly by empowering agile engineering and product teams to adopt the software independently, effectively bypassing traditional IT approval processes 2538. Slack's superior user experience fostered intense brand loyalty, allowing it to generate $1.7 billion in revenue in 2023 with projections to reach $4.22 billion by 2025 3926.
However, Microsoft responded not by building a better user interface, but by leveraging a massive structural sales-led advantage: bundling Microsoft Teams directly into its existing Microsoft 365 enterprise suite 2538. By making Teams the default, technically "free" option for thousands of Fortune 500 companies already paying for enterprise licenses, Microsoft completely bypassed the end-user preference battle and won the executive procurement decision 252641. Furthermore, Teams offered superior built-in video conferencing and deep integration with native tools like SharePoint, satisfying strict IT compliance requirements 2743.
The user data highlights the power of bundled distribution. By 2024, Microsoft Teams commanded over 320 million monthly active users and captured a 37% market share, generating over $8 billion in revenue 38394128. Slack, meanwhile, plateaued near 42 million daily active users and 79 million monthly active users, holding an 18% market share 38394128. Slack's smooth user experience and extensive third-party integrations were ultimately insufficient to overcome Microsoft's top-down distribution dominance within the enterprise sector 38.
Structural Failures and Transition Dynamics
While product-led growth drives remarkable initial momentum and capital efficiency in the early stages of a software company, attempting to scale indefinitely on a pure self-serve motion often results in stalled growth. Conversely, attempting to force a self-serve motion onto a complex product that lacks immediate time-to-value reliably leads to high cash burn rates and zero market adoption 545.
Causes of Product-Led Failure and Market Misalignment
Analysis of failed product-led startups reveals consistent operational patterns. Companies such as Ansaro, Patron.ai, and MyCity collapsed not strictly due to poor engineering execution, but due to a fundamental lack of product-market fit and a failure to engage directly with users during the critical early stages 45. A pervasive fallacy among technical founders is that a superior product will inherently "sell itself," leading them to actively avoid building a sales or customer success function because they view human intervention as unscalable 29. In reality, human interaction is critical early on to understand user context and iterate on product shortcomings 29.
Furthermore, product-led distribution structurally breaks down when software products require significant organizational change management, cross-departmental coordination, or complex legacy data migrations to realize their value 5. If a product demands that an entire enterprise shift its behavior simultaneously - such as migrating to a new enterprise resource planning system or deploying a compliance platform - an individual user cannot reach the "aha moment" in isolation. Without that individual validation, the organic, peer-to-peer distribution mechanics of product-led growth are rendered entirely useless 5. Execution errors also derail promising products; for example, Woxi Media failed to secure aggressive distribution partners, while its executive team prematurely pre-announced a next-generation product, triggering the Osborne effect and collapsing current sales 2.
The Transition to Product-Led Sales
Market data from the Bessemer Cloud 100 cohort demonstrates that the most highly valued and rapidly compounding software companies do not treat product-led and sales-led growth as a binary choice. Instead, they deploy a sophisticated hybrid model known as Product-Led Sales 11014.
The transition from a pure self-serve motion to a hybrid model is an operational necessity for capturing enterprise value, but it is culturally and structurally precarious. Atlassian, long revered as the platinum standard of pure product-led growth, eventually hit a revenue ceiling and was forced to hire a dedicated enterprise sales team to navigate complex, seven-figure corporate procurement processes 4. Atlassian did not fail at product-led growth; rather, it realized that different market segments require vastly different go-to-market motions. Today, Atlassian maintains an elite 47% margin by utilizing pure self-serve discovery for small businesses under $50,000, while deploying product-enabled sales teams to build executive relationships for enterprise accounts over $100,000 4.
Similarly, the infrastructure monitoring platform New Relic successfully scaled its enterprise revenue tenfold - moving from 25% to 55% of total revenue - by executing a meticulous transition from a developer-first tool to an enterprise platform 30. This required rewiring the entire company to accommodate longer sales cycles, handle multiple buyer personas (developers, operations, and chief information officers), and build deep strategic partnerships with early lighthouse customers 30.
Operational Handoffs and Product-Qualified Leads
Implementing a functional hybrid motion typically takes an organization a minimum of 12 to 24 months 31. Companies that attempt to compress this transition into a hasty six-month pivot frequently fail and revert to their original state, as the shift requires fundamentally rewiring compensation structures, product roadmap priorities, and data governance models 2931.
In a mature hybrid architecture, the original product-led motion does not disappear; it evolves into the foundational demand generation layer for the enterprise sales team 31. Free and self-serve users generate immense volumes of behavioral data - such as the number of active users within an email domain, the frequency of daily logins, or the adoption of specific advanced features. This telemetry is aggregated and scored to identify Product-Qualified Leads 1031.
The operational handoff between self-serve and sales is governed by strict mathematical thresholds. For example, when a single corporate account organically reaches 25 active users, or when an expansion request exceeds $25,000 in value, the system automatically routes the account away from self-serve and into the queue of an Enterprise Account Executive 31. Because these product-qualified leads are already deeply familiar with the software's interface and value proposition, they convert to paid enterprise contracts at two to three times the rate of traditional marketing-qualified leads generated through whitepapers or cold outreach 5.
Macroeconomic and Technological Catalysts
The software industry's growth mechanics are continuously shaped by broader technological breakthroughs and geographic market maturation. Currently, the deployment of advanced artificial intelligence and the expansion into emerging global markets represent the primary vectors for future software growth.
Artificial Intelligence as a Growth Multiplier
The integration of generative artificial intelligence is the most significant technological catalyst currently altering software growth and valuation metrics. In 2024, artificial intelligence companies became the highest-valued category on the Bessemer Cloud 100 list, representing $176 billion (21%) of aggregate equity value. By early 2025, this dominance accelerated dramatically, with AI comprising $464 billion, or an astonishing 42% of the total list value, despite representing only 22 companies within the cohort 32.
AI fundamentally alters the unit economics of software delivery. Vertical AI applications built atop foundational large language models are currently generating gross margins nearly six times their underlying infrastructure expenses, as companies charge a premium for workflow automation while underlying compute costs drop rapidly 33. Furthermore, AI has radically accelerated the timeline to reach "Centaur" status - defined as achieving $100 million in annual recurring revenue. While the average top-tier cloud company takes 7.5 to 7.8 years to reach this milestone, AI-native companies are crossing the $100 million threshold in an unprecedented 6.3 years 32.
Strategically, AI has forced a complete rewrite of the software expansion playbook. New AI features are following a highly consistent monetization lifecycle: they launch as standalone paid add-ons, gradually embed into premium subscription tiers, and ultimately become core platform features gated by hard usage credits 11. This credit-based consumption model perfectly bridges the gap between self-serve and sales-led motions, driving organic usage while establishing clear, measurable triggers for sales intervention the moment a client exhausts their allocated compute limits 11.
Geographic Market Dynamics and Localization
While technological architecture dictates how software is sold, geographic maturity dictates where it is adopted. North America remains the overwhelmingly dominant force in the global software-as-a-service market, holding approximately 43% to 48% of global market share (valued at over $131 billion in 2023) 343536. This dominance is sustained by mature digital infrastructure, massive corporate cloud adoption, and deep venture capital pools 34. Europe follows with steady growth driven by stringent regulatory compliance tools, with the United Kingdom leading the region 3435.
However, the Asia-Pacific region is projected to be the fastest-growing global market through the remainder of the decade, expanding at an estimated annual rate of 16% to 22% 3435. This surge is fueled by mobile-first deployment strategies and the rapid digitalization of small and medium-sized enterprises in India and China 3435.
Crucially, user conversion behavior and acquisition costs change dramatically across these regions. North American users, accustomed to fast corporate decision-making and ubiquitous corporate credit card adoption, convert rapidly through standard 14-day trials 19. Conversely, buyers in the Asia-Pacific and Western European markets generally require significantly longer evaluation periods (21 to 30 days) and demonstrate a higher reliance on alternative payment methods or strict data sovereignty protocols 19. Software vendors that invest in deep regional localization experience massive performance lifts; data indicates that offering local currency pricing improves conversion by 38%, while integrating local payment methods boosts final conversion by up to 67% 19.