Methods for unbiased customer feedback collection and analysis
The science of customer feedback exists at the intersection of psychometrics, behavioral economics, statistics, and computational linguistics. Organizations rely on feedback data to predict business outcomes, allocate capital, and design product strategies. However, the collection and interpretation of this data are frequently compromised by methodological vulnerabilities, cognitive biases, and unvalidated practitioner frameworks. Establishing a rigorous feedback architecture requires reconciling quantitative survey design, qualitative discovery protocols, cross-cultural response dynamics, and advanced causal inference models.
Scientific Validity of Foundational Metrics
The measurement of customer sentiment in corporate environments relies heavily on standardized, single-item or brief-composite metrics. While widespread, the predictive validity, academic backing, and statistical reliability of these metrics vary significantly across different empirical studies.
Net Promoter Score Capabilities and Vulnerabilities
The Net Promoter Score (NPS) categorizes customers into promoters, passives, and detractors based on their likelihood to recommend a company on an 11-point scale from zero to ten 12. The metric is calculated by subtracting the percentage of detractors (scores zero through six) from the percentage of promoters (scores nine and ten), completely ignoring the passive cohort (scores seven and eight) 345. Despite its ubiquitous adoption as a primary indicator of future revenue growth, the academic validation of NPS remains highly contested within peer-reviewed literature.
Longitudinal studies examining the relationship between NPS and firm revenue growth indicate that metrics based strictly on recommendation intentions frequently demonstrate little to no predictive value over simple, continuous satisfaction scales 56. Researchers Morgan and Rego demonstrated that NPS fails to adequately adjust for the presence of neutral word-of-mouth activity, which obscures true market dynamics 567. Furthermore, studies comparing NPS to the American Customer Satisfaction Index (ACSI) reveal that neither metric accounts for ex-customers or never-customers. Research by East and colleagues demonstrates that these excluded demographic segments generate up to 77 percent of negative word-of-mouth, while current detractors account for as little as 3 to 31 percent of negative comments 8910.
NPS exhibits specific methodological vulnerabilities due to its arbitrary categorization cut-offs and reliance on a single question, which fails to capture the underlying causal mechanisms driving loyalty or disloyalty 7. By relying purely on observational statistics without experimental control, NPS provides no diagnostic data on why customers act in specific ways. While it serves as a simple organizational alignment tool that effectively correlates with general retention in certain sectors, claims that NPS is the single most reliable indicator of a company's ability to grow are largely unsupported by rigorous empirical evidence 1112.
Customer Satisfaction Indices
The Customer Satisfaction Score (CSAT) measures satisfaction immediately following a specific interaction or purchase, typically utilizing a 5-point or 10-point scale 1513. Research consistently demonstrates a strong association between customer satisfaction, as measured by aggregated CSAT or the ACSI methodologies, and financial performance metrics including return on investment, sales growth, and long-term firm value 814.
CSAT metrics are highly effective for diagnosing service quality at the transaction level 15. The "Top 2 Box" satisfaction score - the proportion of customers rating their satisfaction in the two highest tiers of a given scale - has been shown to possess excellent predictive value for customer retention across multiple industries 616. The ACSI operates on a more complex methodology, calculating a weighted average of three survey questions that measure different facets of satisfaction, utilizing proprietary partial least squares algorithms to estimate the weighting for each question 14. However, standard CSAT measures short-term satisfaction rather than enduring relational loyalty, and relying on it exclusively for strategic planning can yield false confidence regarding long-term brand health 13.
Customer Effort Measurement
The Customer Effort Score (CES) evaluates the degree of effort a customer must exert to accomplish a task or resolve an issue, commonly assessed on a 5-point or 7-point scale 315. Developed on the premise that reducing friction is more predictive of loyalty than maximizing delight, CES is specifically deployed to isolate process bottlenecks in service environments 313.
Empirical studies indicate that CES operates as a highly robust predictor of customer churn. Customers reporting high-effort interactions are up to four times more likely to defect than those experiencing low-effort interactions 17. Furthermore, research from Gartner and the Corporate Executive Board suggests CES is 1.8 times more predictive of customer loyalty than CSAT 15. Data indicates that customers scoring six or seven on a seven-point CES scale maintain a 92 percent retention rate, compared to only 41 percent for those scoring one or two 17. While highly actionable for process improvement and operational efficiency, CES is transactionally focused and does not capture emotional engagement or broader brand perception, necessitating its integration with overarching relational metrics 218.
| Metric Classification | Measurement Focus | Standardized Scale | Analytical Scope | Empirical Predictive Strength |
|---|---|---|---|---|
| Net Promoter Score (NPS) | Brand advocacy and likelihood to recommend. | 0 - 10 (Promoters minus Detractors). | Relational (Long-term brand health). | Disputed predictive validity for aggregate revenue growth; correlates moderately with user retention. |
| Customer Satisfaction (CSAT) | Satisfaction with a specific product, service, or interaction. | 1 - 5 or 1 - 10. | Transactional (Immediate post-event). | Strong predictor of immediate retention, transaction quality, and localized service efficiency. |
| Customer Effort Score (CES) | System friction and ease of task resolution. | 1 - 5 or 1 - 7. | Transactional (Immediate post-event). | Highly predictive of customer churn, operational friction, and service loyalty. |
| American Customer Satisfaction Index (ACSI) | Weighted facets of satisfaction, expectations, and quality. | Proprietary weighted index based on multiple questions. | Relational and Macroeconomic. | Strong historical correlation with stock market returns, profitability, and macroeconomic performance. |
Survey Design and Non-Response Bias Mitigation
To gather objective and statistically significant feedback, quantitative survey instruments must be systematically designed to minimize error. Survey data is universally susceptible to four primary sources of error: sampling error, coverage error, measurement error, and non-response error 1920. Mitigating these errors requires a sophisticated blend of behavioral design and post-collection statistical adjustment.
The Tailored Design Method
The Tailored Design Method (TDM), originally formulated by Don Dillman in 1978 and heavily revised for digital mediums, constitutes a rigorous framework for survey design grounded in sociological social exchange theory 192021. The methodology posits that individuals are motivated to participate in research only when the perceived rewards of responding outweigh the perceived costs, and when trust is established that the survey results will be utilized effectively 192223.
TDM operationalizes this exchange through exhaustive pre-survey planning, concise questionnaire construction, appropriate sequencing, personalized communication, and the continuous tracking of responses 22. Moving away from a monolithic "one-size-fits-all" approach, modern TDM adapts procedures to distinct demographic environments, adjusting the delivery mode and interaction cadence 2023. For example, studies leveraging TDM principles have achieved response rates matching traditional four-contact paper mail strategies simply by optimizing digital pre-notices, personalizing parameters, and minimizing cognitive load 2023.
Statistical Corrections for Non-Response Bias
Non-response bias occurs when the achieved respondent sample systematically differs from non-respondents in ways that impact the study's core variables 24. Because non-respondents cannot be surveyed by definition, non-response bias is fundamentally a property of the final statistic rather than the survey itself 24. According to stochastic formulas, non-response bias is directly proportional to the covariance between the response propensity and the survey variable 24.
To correct for this, statisticians deploy several post-collection weighting and imputation methods. Inverse Probability Weighting (IPW) models the response probability using auxiliary variables to rebalance the achieved sample to better reflect the target population 24. The theoretical underpinning of IPW relies on the Missing At Random (MAR) assumption, which states that the probability of missing data depends only on observed variables, not on the missing values themselves 24.
Propensity Score Models are widely utilized to calculate the fitted probability that a given case will become a survey respondent. In complex panel surveys, logistic regression or classification trees are used to generate these propensity scores 25. Empirical evaluations of the Agricultural Resource Management Survey indicated that classification tree weighting outperforms standard logistic regression in reducing the mean bias of estimates 25.
Post-stratification and generalized calibration weighting are also deployed to adjust sample margins to match known population benchmarks. Calibration constraints use iterative procedures to ensure that weights bring individual-level survey data into line with the broader population structure 252627. In longitudinal studies where variables are correlated across waves, Multiple Imputation (MI) procedures serve as a robust alternative to weighting. MI replaces missing data with predicted values based on auxiliary data, utilizing techniques such as nearest-neighbor substitution or regression modeling to draw on the predictive power of outcomes from previous research waves 2428.
Psychometric Reliability and Measurement Consistency
Survey measurement instruments must demonstrate both validity, defined as the accuracy in measuring the intended construct, and reliability, defined as the consistency of measurement over time and across items 29. In the analysis of quantitative feedback scales, Cronbach's alpha is the predominant statistical coefficient utilized to measure internal consistency and reliability 29303132.
Cronbach's alpha quantifies the degree to which items within a scale correlate with one another, providing an estimate of reliability by examining the covariance among items relative to the total variance 2930. The coefficient yields a value between 0 and 1. A coefficient equal to or above 0.70 generally denotes acceptable and satisfactory reliability in social sciences and business research, indicating that the scale items consistently measure the same underlying variable 293031.
However, coefficients that exceed 0.90 often suggest item redundancy. Redundancy implies that the survey includes superfluous questions measuring the exact same facet in slightly different words, which artificially inflates the alpha score without adding substantive measurement value or improving construct validity 3031. Analysts must also consider that a low alpha value may simply be an artifact of a low number of questions in the scale rather than an inherent lack of reliability 30. Ensuring high internal consistency is critical; without established reliability, any inferences drawn regarding customer sentiment or subsequent causal relationships are mathematically invalid 2931.
Cross-Cultural Response Styles
When multinational organizations deploy standardized metrics globally, they frequently interpret score variations as absolute differences in product satisfaction or brand loyalty. However, extensive cross-cultural research indicates that systemic response styles - defined as the tendency to respond to questionnaire items based on culturally ingrained habits independent of the specific item content - heavily distort raw numerical data 333435.
Geographic Variations in Response Patterns
Response biases generally manifest in three distinct mathematical forms across rating scales: Acquiescence Response Style (ARS), Extreme Response Style (ERS), and Middle Response Style (MRS) 36.
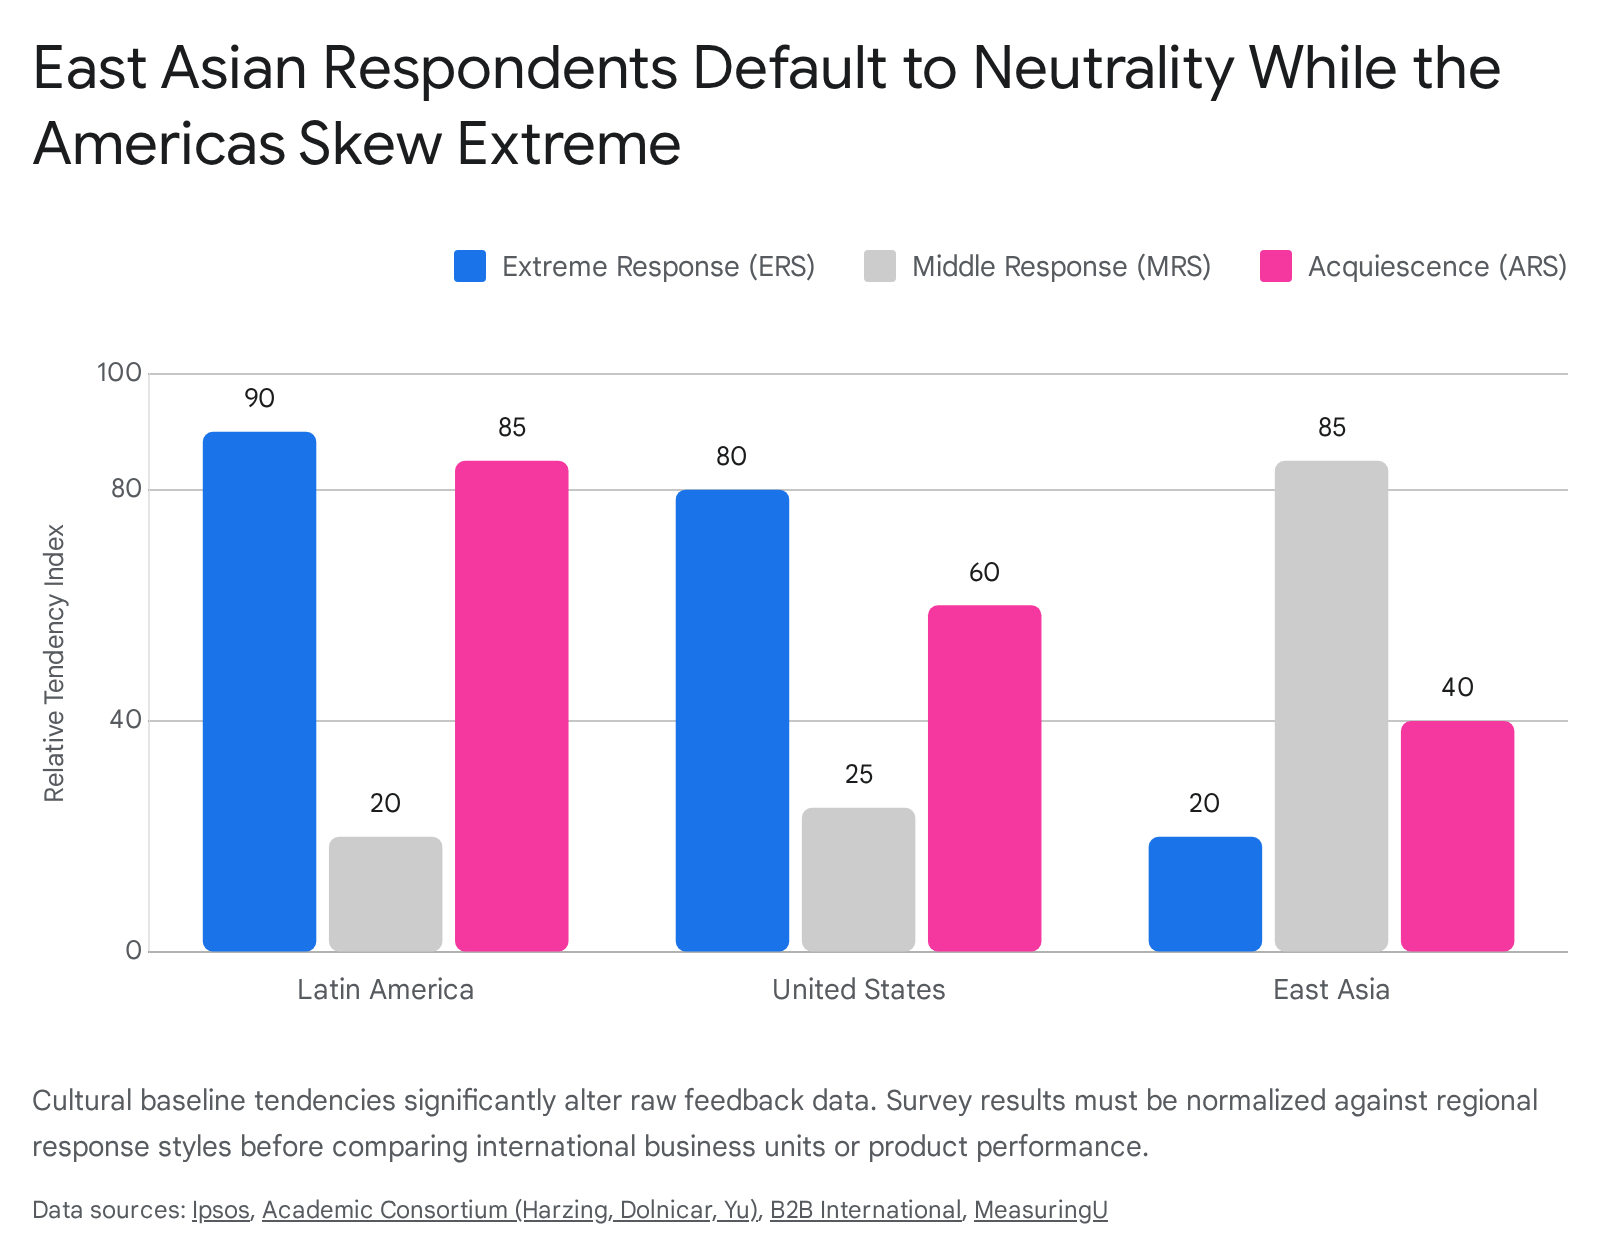
Acquiescence is the generalized tendency to agree with statements regardless of content, often termed "yea-saying." Extreme Response Style is the propensity to select the outermost points of a rating scale, such as exclusively choosing 1 or 5 on a 5-point Likert scale. Middle Response Style is the inclination to systematically avoid extremes and select neutral or midpoint options 353637.
Data extracted from massive cross-national studies reveal strict geographic clustering for these behaviors. Respondents from Latin American, Mediterranean, and Middle Eastern markets display significantly higher rates of ERS and ARS 3641423839. In studies evaluating semantic differential ratings and Likert scales, Middle Eastern respondents frequently answer on the extreme positive end of all scales, exhibiting the lowest overall standard deviation in scale usage 42. Similarly, re-analyses of consumer behavior in the European Union found that Southern European respondents in Italy, Spain, and Greece consistently demonstrate higher extreme response indices than those in Northwestern Europe 3538.
Conversely, respondents from East Asian nations - specifically Japan, China, Singapore, and South Korea - exhibit a high prevalence of MRS and are statistically less likely to utilize extreme ratings 34364142. In benchmark psychometric studies, United States respondents were found to be 41 percent more likely to select extreme responses compared to Japanese respondents. In contrast, Japanese respondents selected neutral responses 33 percent more frequently than their American counterparts 38.
Cultural Dimensions and Survey Behavior
These response styles are not random artifacts; they correlate heavily with national cultural characteristics, which are frequently mapped using Geert Hofstede's cultural dimensions theory 40414243. Hofstede's framework indexes national preferences across axes including Power Distance, Individualism versus Collectivism, Masculinity versus Femininity, and Uncertainty Avoidance 4142.
Cultures scoring high on Power Distance - the degree to which unequal power distribution is accepted - and Collectivism exhibit heightened acquiescence bias 333441. In high power-distance environments, respondents may feel culturally constrained from expressing direct disagreement, deferring instead to the perceived authority of the survey investigator or the corporate brand 3344.
Similarly, Individualistic and Masculine cultures, such as the United States and Australia, demonstrate significantly higher ERS. This correlates with cultural emphases on assertiveness, decisiveness, and individual expressiveness, where selecting an extreme response is viewed as a demonstration of sincerity and conviction 34384043. In contrast, cultures valuing restraint, modesty, and the preservation of social harmony default to MRS to avoid appearing overly judgmental or disruptive 3443.
Language also acts as a profound variable; English-language questionnaires tend to elicit a higher level of middle responses globally, while questionnaires administered in a respondent's native language result in more extreme response styles, indicating that cognitive fluency impacts scale utilization 3334. Recognizing these cultural baseline shifts is mathematically vital; an NPS of 20 in Japan may represent an equivalent level of underlying brand advocacy as an NPS of 50 in Brazil 3642.
Qualitative Discovery and Interview Frameworks
While quantitative metrics provide scale and identify macro-trends, they fail to supply granular context. Qualitative research methods, specifically customer discovery interviews, are required to understand the mechanistic "why" behind numerical deviations. However, qualitative feedback is highly vulnerable to social desirability bias, confirmation bias, and the use of leading questions 454647.
Subjectivity, Objectivity, and Reflexivity
Historically, customer feedback research has bifurcated into objective data, such as quantitative metrics and usage logs, and subjective data, including open-ended qualitative responses and unstructured interviews. Objective data offers measurability, reproducibility, and verifiability, acting as a grounding force against emotional bias 48545549. Subjective data captures nuanced human experiences, detailed workarounds, and contextual drivers that rigid quantitative matrices completely overlook 48545051.
In contemporary research paradigms, the "Subjective-Objective Harmony Framework" asserts that these two are not opposing forces but necessary, complementary elements 48. Relying exclusively on quantitative data leaves analysts blind to root causes, while relying solely on qualitative feedback lacks the statistical rigor necessary for executive capital allocation 4754. To bridge this epistemological gap, modern researchers deploy reflexivity. Reflexivity requires researchers to critically examine how their own assumptions, hypotheses, and positionalities influence the design of the research and the interpretation of the data, ensuring that quantitative survey instruments are not inadvertently tainted by subjective researcher bias from the outset 4552.
Cognitive Bias Avoidance in Interview Phrasing
Standard customer discovery processes frequently yield false positives. When presented with a novel product idea, human subjects are biologically wired for social harmony and tend to offer polite validation rather than objective truth 5361. Social desirability bias ensures that respondents provide answers that make them look favorable or appease the interviewer 3754.
To mitigate this, practitioners utilize stringent conversational frameworks designed to bypass hypotheticals. The "Mom Test" framework, developed by Rob Fitzpatrick, operationalizes this avoidance by shifting the subject matter completely away from the researcher's proposed solution, focusing exclusively on the customer's past behavior and current operational reality 53546364.
The methodology establishes strict linguistic constraints for qualitative researchers: * Eliminate Future Hypotheticals: Questions such as "Would you pay for a product that does X?" invite over-optimistic speculation and are structurally flawed 65. Researchers are instructed to ask, "How much does your current solution cost?" or "Talk me through the exact workflow the last time this problem occurred" 5463. Past behavior serves as the only reliable predictor of future action 5466. * Conceal the Solution: Mentioning a specific solution triggers the respondent's defensive politeness. Effective qualitative discovery occurs when the respondent is unaware of what the researcher is attempting to build, forcing the subject to discuss their systemic challenges organically 616355. * Demand Tangible Commitments: If a customer cannot articulate a specific action they have already taken to solve the problem - such as building a complex spreadsheet workaround or purchasing suboptimal competitor software - the pain point is demonstrably not severe enough to monetize 535463. True validation requires observing actual friction or securing a tangible commitment, such as a monetary deposit or an unprompted introduction to a decision-maker with budget authority 546566.
By strictly parsing qualitative feedback through these rules, researchers learn to ignore compliments and hypothetical commitments, extracting only empirical behavioral data concerning actual spending, time loss, and operational friction 6364.
Artificial Intelligence in Feedback Analysis
The exponential growth of digital touchpoints and the sheer volume of unstructured feedback necessitate the automation of qualitative processing. Large Language Models (LLMs) and advanced natural language processing (NLP) architectures are increasingly deployed to conduct thematic and sentiment analysis at an industrial scale 566957.
Semantic Understanding versus Lexical Rules
Legacy sentiment analysis systems relied on rigid, rule-based lexicons that scored text via simple keyword matching 695758. If a customer review contained the word "slow" or "expensive," it was universally logged as a negative attribute. These systems struggled severely with unstructured, organic language 6958.
Modern LLMs utilize semantic vectorization, processing the deep contextual relationship between words.
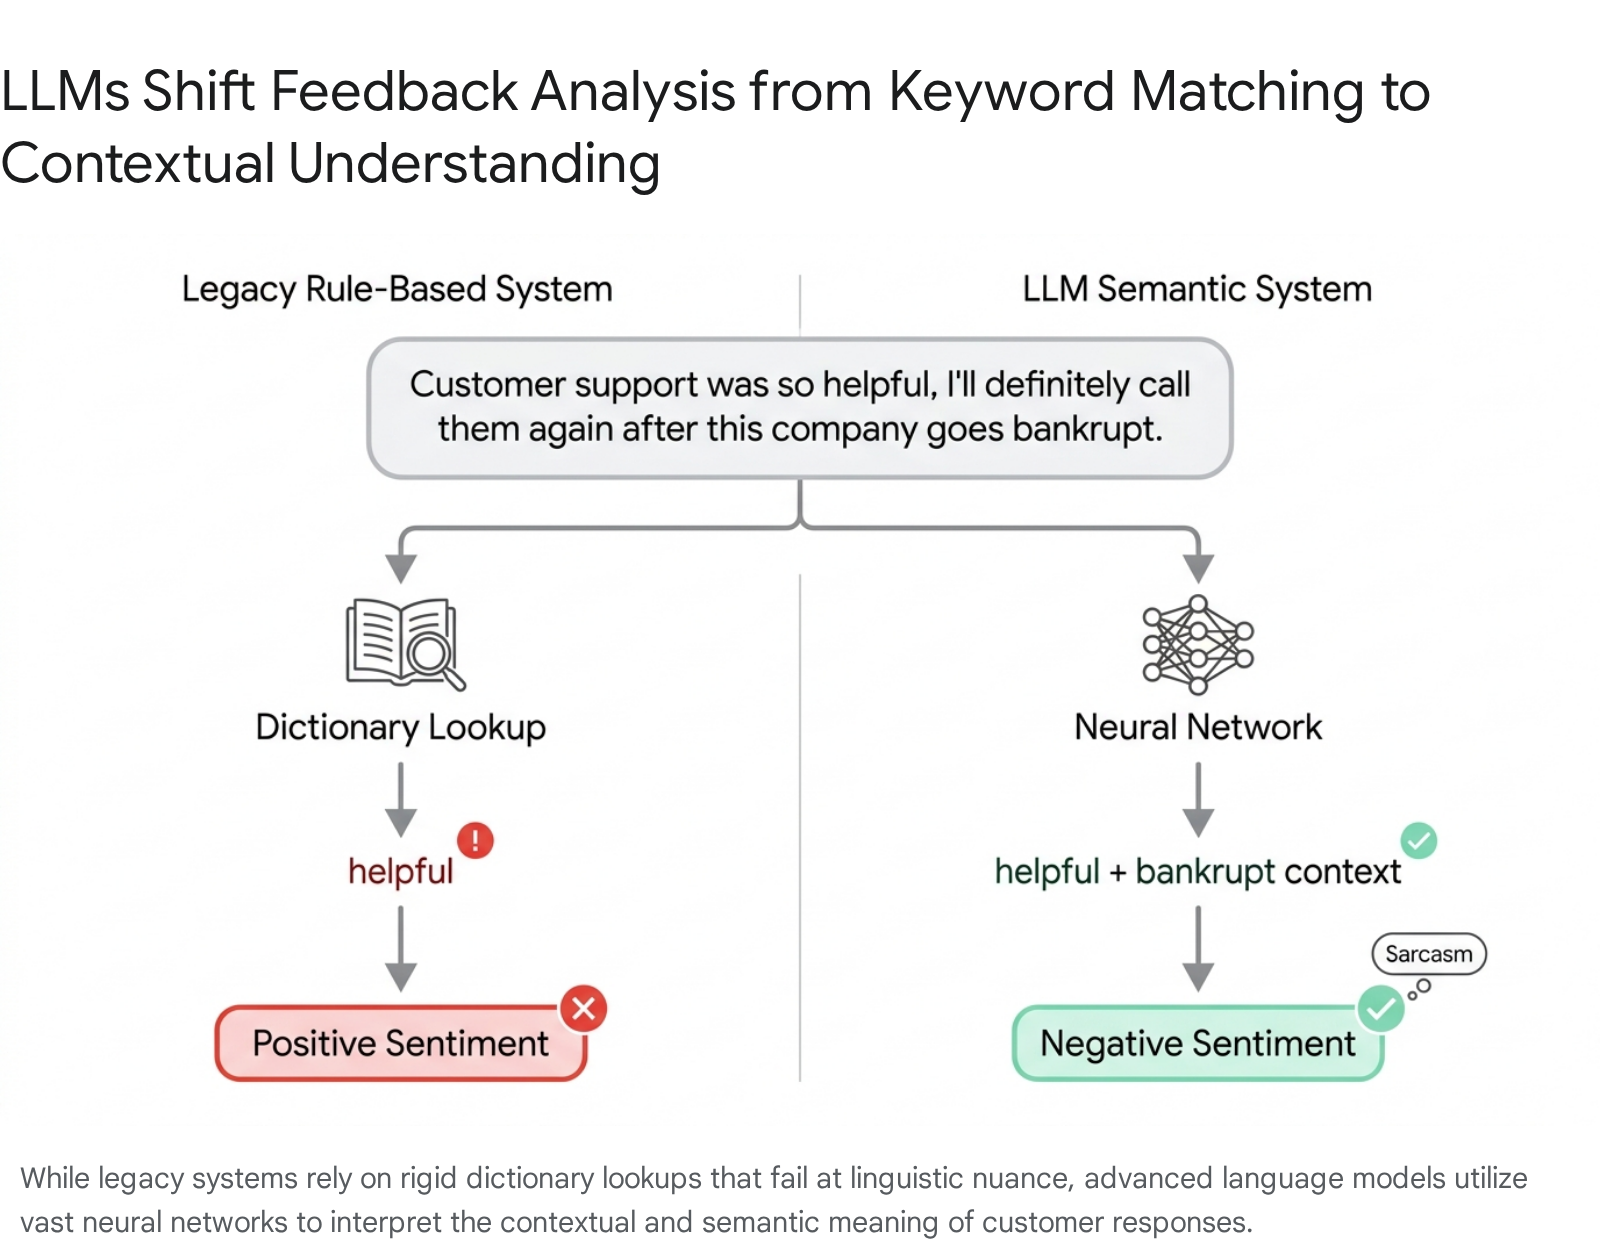
This enables the model to understand that distinct phrases like "takes forever to load," "super laggy," and "waited 30 seconds" all cluster around a singular thematic concept of poor latency, grouping them intelligently 6959. By grasping context rather than just vocabulary, LLMs can dynamically extract hundreds of mutually exclusive topics and build structured hierarchies from raw text in real-time 575960. Furthermore, when performing deductive coding - applying pre-defined analytical codes to new data - LLMs achieve accuracy and consistency rates that often rival or exceed trained human coders, frequently reaching inter-rater reliability markers of 80 percent or higher 6961.
Algorithmic Limitations and Linguistic Nuance
Despite their vast processing advantages, LLMs introduce novel methodological vulnerabilities into customer research. While highly proficient at deductive tasks, LLMs demonstrate variable reliability in inductive thematic generation, which involves deriving novel themes entirely from raw data without a preconceived framework 6162.
The application of LLMs frequently results in a documented loss of nuance. Models tend to overgeneralize topics and erase minority viewpoints, struggling to identify the subtle interpretive themes, cultural subtleties, or niche professional domain knowledge that human ethnographers detect instinctively 56. Furthermore, LLMs struggle severely with complex pragmatic language, specifically sarcasm, negation, and idiomatic expressions 58. A sarcastic phrase relying on a mismatch between literal wording and situational context is frequently interpreted literally by the AI. For instance, evaluating an algorithmic response to the phrase, "Sure, because I have all the time in the world," often reveals that the LLM interprets the text as genuine enthusiasm, completely missing the underlying frustration 5863. To combat this, researchers are actively testing external interventions like explicit sarcasm removal algorithms, text paraphrasing, and adversarial text augmentation, which have been shown to increase model robustness and sentiment accuracy by up to 21 percent in specific domains 63.
Typology of Algorithmic Bias
When integrating artificial intelligence into feedback infrastructure, organizations risk systematizing interpretive errors at an unprecedented scale. Algorithmic bias in machine learning manifests when systems repeatedly produce imbalanced or prejudiced outcomes due to flawed programming architectures or skewed data environments 647965.
There are several distinct categories of AI bias pertinent to feedback analysis: * Training Data and Selection Bias: If the historical datasets used to train the LLM exclude certain demographics, use informal language disparately, or reflect institutional prejudices, the model will output skewed interpretations. For example, text classifiers trained predominantly on formal English may misinterpret the sentiment of regional dialects or socio-cultural slang, systematically discarding valuable feedback from underrepresented user bases 5664658166. * Algorithmic Design Bias: The mathematical architecture itself may prioritize specific features over others. In qualitative analysis, LLMs exhibit a strong tendency to "force-fit" coherence, identifying logical consistency where human evaluators see divergent opinions. This leads to the overfitting of common themes and the homogenization of the data 566264. * Automation Bias: This refers to the human psychological propensity to over-trust automated systems. When human researchers uncritically accept an LLM's thematic summary of customer feedback due to the speed of its output, they fail to act as a rigorous validation layer. This dynamic allows the model's blind spots to seamlessly dictate product strategy and resource allocation 6264.
Responsible integration of LLMs in software engineering and market research demands strict prompting literacy, continuous human-in-the-loop oversight, and hybrid methodologies that cross-validate AI categorizations with manual human checks 616264.
Causal Inference and Structural Equation Modeling
The final frontier of customer feedback science lies in advancing from observational correlation to definitive causation. Simply demonstrating that high satisfaction scores correlate with high retention rates does not prove that improving satisfaction will mathematically cause greater retention 78367. Confounding variables - such as product pricing, switching costs, or regional market monopolies - often govern both metrics simultaneously, creating the illusion of a direct relationship 68.
To deduce true causal relationships and allocate capital effectively, researchers utilize Structural Equation Modeling (SEM) and formal Causal Inference frameworks.
Structural Equation Modeling in Feedback Analytics
SEM is a sophisticated multivariate statistical technique used to model complex relationships between observed variables (e.g., specific survey responses regarding app interface, delivery speed, or product quality) and unobserved latent constructs (e.g., perceived value, trust, and total customer loyalty) 697071.
Rather than relying on the single-variable output of an NPS or CSAT survey, SEM allows analysts to build a comprehensive, multi-layered map of the customer experience. By calculating loading scores and path coefficients via methods like Partial Least Squares (PLS), analysts can pinpoint exactly which dimensions of service quality exert the strongest causal force on customer commitment 7172. For example, a structural equation model evaluating an e-commerce platform can empirically prove that while "trust" significantly impacts "customer commitment," it may not directly cause "customer loyalty" without the mediating variable of "perceived service quality" 71. This level of granularity prevents organizations from investing heavily in attributes that do not actually drive purchasing behavior.
Counterfactual Frameworks and Business Experimentation
Modern causal inference utilizes advanced mathematical frameworks, specifically Structural Causal Models (SCMs) pioneered by Judea Pearl and the Potential Outcomes framework (Rubin Causal Model), to formally define causal assumptions 6873. These models seek to answer counterfactual questions: what exactly would a customer's purchasing behavior have been if a specific feedback-driven intervention had not occurred?
In digital business applications, A/B testing provides the standard mechanism for scalable causal analysis. However, basic A/B testing often suffers from exceptionally high false-positive rates when complex confounding variables are ignored; studies indicate that inadequate causal inference practices in technology companies lead to false positive rates of 23 to 37 percent, driving billions in misallocated resources 67.
To refine these estimates, organizations are increasingly utilizing techniques such as Double Machine Learning. This approach isolates the precise causal effect of a specific treatment variable (e.g., improving customer support responsiveness) on an outcome (e.g., gross sales) while simultaneously using machine learning to mathematically control for hundreds of other complex, non-linear confounders 74. This rigorous, experimentally grounded approach ensures that organizations act only on validated causal links, maximizing the return on investment for any customer experience initiative.