Influencer Marketing Performance and ROI Benchmarks by Tier 2026
Industry Capitalization and Market Trajectory
The global influencer marketing industry has transitioned from an experimental digital strategy into a foundational commercial infrastructure. Following a period of systemic digital transformation, the sector reached an estimated valuation between $32.55 billion and $34.1 billion by the conclusion of 2025 and into early 2026, representing a robust year-over-year growth rate of 35.63% 1234. This valuation indicates that creator marketing has eclipsed the total global outdoor advertising market, maintaining a compound annual growth rate that points toward a $52.1 billion market capitalization by 2030 4.
Investment trajectories across the enterprise sector reflect this macroeconomic shift. Industry analyses from the World Advertising Research Center (WARC) and enterprise benchmarking reports indicate that 87.49% of brands expect to increase their influencer marketing budgets in 2026, with over 72% of organizations planning aggressive budget expansions of 50% or more 25. Furthermore, 26% of marketing agencies and enterprise brands now allocate over 40% of their total digital marketing budgets to influencer partnerships, solidifying the channel as a primary growth lever rather than a supplementary tactic 166.
The physical scale of this ecosystem is underscored by the expansion of service providers, which grew by 520% over a six-year period to encompass nearly 7,000 dedicated agencies, platforms, and analytics firms 1. However, this rapid capital influx has introduced severe demands for performance accountability. As overall global advertising spend is projected to reach $1.30 trillion in 2026, marketing executives face intense pressure to justify creator expenditures using standardized financial metrics such as Customer Acquisition Cost (CAC), Average Order Value (AOV), and Return on Investment (ROI) 78. Organizations are moving decisively away from legacy vanity metrics - such as raw impressions and follower counts - toward deterministic revenue attribution models.
Econometric Modeling of Creator Returns
The financial efficacy of influencer marketing is consistently validated across diverse econometric studies and platform data. The industry average baseline return on investment currently sits between $5.20 and $5.78 for every single dollar allocated to creator campaigns 1910111314. When compared to traditional digital advertising formats such as display or programmatic ads, influencer marketing delivers approximately 11 times the aggregate ROI, operating as a highly efficient mechanism for overcoming modern ad fatigue 41012.
Recent large-scale econometric benchmarking provides even more granular performance expectations. The 2026 Nielsen and CreatorIQ ROI Benchmark Study, which analyzed 6,400 brand campaigns across 28 countries representing $4.8 billion in media spend, found that the true average ROI has escalated to $6.93 for every dollar spent - a 19.9% improvement over previous historical benchmarks 12. This upward trajectory in efficiency is largely attributed to improved algorithmic targeting, advanced social commerce integrations, and enhanced server-side measurement capabilities that capture previously unattributed consumer touchpoints.
Peak campaign performance reveals the absolute ceiling of the channel's profitability. Top-performing initiatives consistently yield between $18 and $20 in return per dollar invested, particularly in high-margin categories such as beauty, wellness, and digital software 110111216. These superior returns are not achieved through arbitrary viral events, but rather through systematic, data-driven relationship structuring. For instance, influencer campaigns where selection was driven by artificial intelligence and first-party brand audience data delivered an average ROI of $9.14 per dollar spent, outperforming the baseline by 31.9% 12.
The durability of creator partnerships functions as the primary amplifier for financial returns. Long-term ambassador programs - defined as continuous creator relationships lasting six months or longer - record an average return of $11.28 per dollar spent, outperforming transactional, one-off campaign structures by a significant margin 12. This data indicates that relational consistency breeds deeper audience trust, which in turn lowers the relative cost of acquisition over time. Academic literature corroborates this, with mediation analyses confirming that strategic investment in social media influencers drives measurable financial gains precisely because brand awareness and parasocial trust partially mediate the relationship between exposure and purchase intent 13.
Despite these strong aggregate returns, analysts at WARC note that creator ROI suffers from high levels of volatility. Studies reveal that up to 45% of creator ad spend on major platforms like Meta is wasted through poor creative execution, and only 27% of creator content effectively links consumer intent to the sponsoring brand 18. This volatility highlights the operational risk of treating influencer marketing as a monolithic strategy rather than a highly variable media channel requiring rigorous creative auditing.
Audience Saturation and Tier Dynamics
A persistent dynamic in creator economics is the inverse relationship between audience size and engagement efficiency. As an influencer's follower count increases, the organic engagement rate reliably decreases - a phenomenon driven by audience heterogeneity, algorithmic saturation, and the dilution of parasocial intimacy 19141516. Peer-reviewed studies highlight that this pattern underscores the diminishing marginal returns inherent to cooperative strategies within bilateral markets; as an audience broadens, the influencer's specific niche authority weakens, eroding the incremental benefits of the brand partnership 16.
The creator market is highly concentrated at the base. Nano-influencers, defined as creators with 1,000 to 10,000 followers, currently dominate the ecosystem, comprising 75.9% of the total influencer base on Instagram and 87.68% on TikTok 129. Despite their smaller individual reach, budget allocations are aggressively shifting downward toward these tiers. Data indicates that 73% of brands actively prefer partnerships with micro and mid-tier creators due to superior cost-efficiency, niche authority, and verifiable conversion metrics 11023.
Nano and Micro Influencer Dominance
Micro-influencers (10,000 to 100,000 followers) generate an average engagement rate of 3.86%, compared to the 1.21% average observed among mega-influencers (1 million+ followers) 4. When analyzing absolute financial outcomes, micro-influencer campaigns deliver the highest baseline ROI in the industry at $7.14 per dollar spent, while nano-influencers yield a highly competitive $6.52 4.
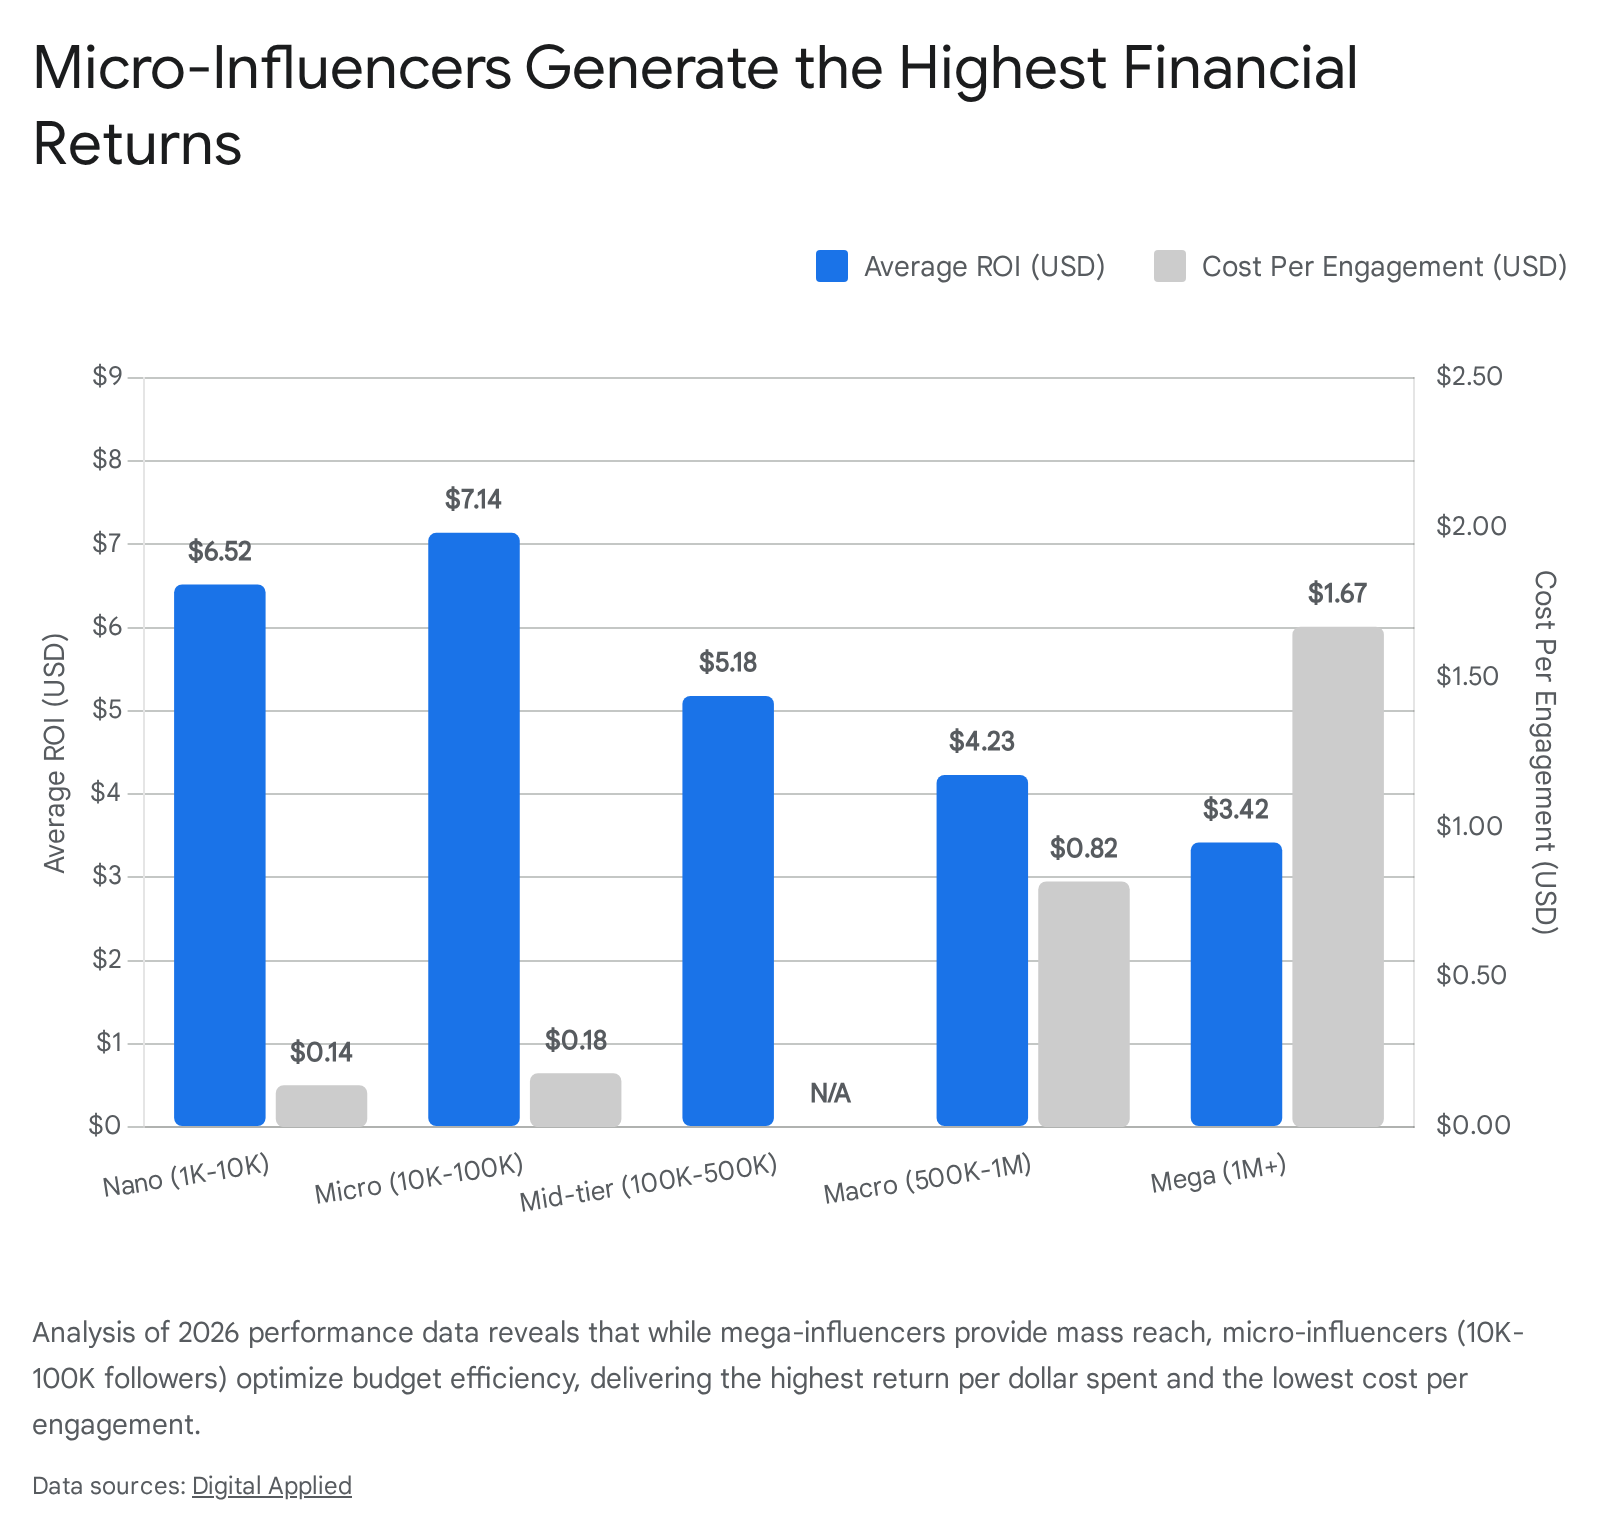
The cost-per-engagement (CPE) metrics heavily favor these smaller creators. Brands pay an average of $0.14 per engagement with a nano-influencer and $0.18 with a micro-influencer, compared to $0.82 for macro-influencers and $1.67 for mega-influencers 4. Consequently, brands prioritizing CPE over absolute reach consistently outperform organizations engaged in follower-chasing strategies. A standard budget allocation distributing $5,000 across ten micro-influencers routinely delivers five to eight times the aggregate engagement of a single $5,000 partnership with a macro-influencer 24. Furthermore, micro-influencers achieve a 2.4x higher overall conversion rate than their mega-influencer counterparts, as smaller audiences exhibit significantly higher purchase intent and trust in the creator's specialized recommendations 4.
Macro and Mega Influencer Utility
Despite the diminishing marginal returns in direct conversion, macro and mega-influencers remain vital for specific, upper-funnel strategic objectives. Industry data indicates that 84% of major product launches still heavily utilize top-tier influencers due to their capacity to generate rapid cultural momentum and scale 4. Mega-influencers provide 4.1x greater absolute reach per post than micro-influencers and command substantially higher Earned Media Value (EMV) multipliers, making them indispensable for broad awareness campaigns where immediate direct-response conversion is not the primary KPI 425.
The optimal media allocation emerging in 2026 relies on a hybrid portfolio approach. High-performing organizations deploy approximately 30% of their creator budget toward macro-influencers for top-of-funnel brand visibility, and the remaining 70% toward micro and nano-influencers to harvest that intent and drive bottom-funnel conversions. This specific 30/70 macro-to-micro ratio has demonstrated a 23% improvement in overall campaign ROI compared to single-tier allocation strategies 9.
| Influencer Tier | Follower Count | Avg. Engagement Rate | Avg. Conversion Rate | Cost Per Engagement (CPE) | Avg. ROI (per $1) |
|---|---|---|---|---|---|
| Nano | 1K - 10K | 4.84% - 8.00% | 2.41% | $0.01 - $0.14 | $6.52 |
| Micro | 10K - 100K | 3.86% - 4.00% | 2.18% | $0.15 - $0.18 | $7.14 |
| Mid-Tier | 100K - 500K | 1.90% - 2.50% | N/A | $0.15 - $0.50 | $5.18 |
| Macro | 500K - 1M | 1.20% - 1.64% | 1.42% | $0.50 - $0.82 | $4.23 |
| Mega / Celeb | 1M+ | 0.70% - 1.21% | 0.91% | $1.67 - $10.00+ | $3.42 - $2.87 |
| Table 1: Aggregate Performance Benchmarks by Influencer Tier for the 2026 Fiscal Year 492425. |
Social Commerce Ecosystems and Platform Architecture
The realization of influencer marketing ROI is inextricably linked to the structural and architectural differences between digital platforms. User intent, algorithmic distribution logic, and the maturity of native social commerce integrations dictate how effectively a creator's audience awareness translates into trackable corporate revenue.
TikTok and Algorithmic Discovery
TikTok commands the highest engagement rates across the digital landscape, operating primarily as an entertainment-first discovery engine rather than a traditional social network. The platform's algorithm is intensely optimized for behavioral signals, watch time, and completion rates, distributing content based on viral hooks and immediate relevance rather than established follower graphs 2627. As a result, average engagement rates on TikTok span between 5.2% and 8.7%, heavily outperforming other networks 17. Nano-influencers on TikTok routinely achieve engagement rates exceeding 10.3%, as the algorithm democratizes reach for high-quality content regardless of the creator's historical follower count 110.
From a commercial perspective, TikTok has evolved into an aggressive closed-loop ecosystem. TikTok Shop generated $33.2 billion in global gross merchandise value (GMV) in 2024, more than tripling its year-over-year volume 9. The platform is exceptionally efficient at capturing impulse-driven, top-of-funnel purchases, with 78% of active users reporting they have purchased a product after viewing creator content 10. Consequently, 50% of surveyed marketers currently identify TikTok as delivering the absolute strongest ROI among all social platforms for rapid consumer conversion 910.
Instagram and Aesthetic Commerce
While TikTok dominates raw engagement and algorithmic discovery, Instagram maintains market dominance in total capital allocation and brand preference. In 2026, U.S. brand spending on Instagram influencers alone reached $2.21 billion, and 57.1% of brands designate it as their preferred platform for creator campaigns 10. Instagram's architecture is meticulously designed to cater to mid-to-bottom funnel consumer journeys, supported by highly mature commerce features such as in-app checkouts, native product tagging, and seamless integration with Meta's broader advertising ecosystem 9.
Engagement rates on Instagram are mathematically lower, averaging between 1.5% and 3.86% for micro-creators, and capping around 0.48% for standard brand-generated posts 21729. However, Instagram's demographic skews slightly older and possesses higher aggregate purchasing power, making it the premier environment for polished, product-driven storytelling, aesthetic lifestyle positioning, and complex multi-touch attribution campaigns 930. Furthermore, the platform's Reels format generates 67% higher engagement than static feed posts, making short-form video an essential component of any Instagram-centric strategy 29.
YouTube and Considered Purchases
YouTube functions as the deep-engagement anchor of the creator ecosystem. Unlike the fleeting nature of short-form feeds, YouTube facilitates long-form, highly educational content that drives considered purchases rather than immediate impulse buys. Average engagement rates on standard videos range from 2.1% to 3.8%, though specific verticals like travel and gaming routinely achieve higher interaction velocities 91731. The platform's enduring search visibility grants YouTube videos the longest shelf-life of any creator content, resulting in residual ROI that compounds over months or years after the initial capital deployment. The integration of YouTube Shorts has also successfully captured short-form audience attention, boasting average engagement rates of 3.21% and providing creators with an effective top-of-funnel discovery mechanism to funnel viewers toward their long-form content 4.
The Chinese Market as a Predictive Model
The future trajectory of Western social commerce can be reliably forecasted by examining the current maturity of the Chinese digital ecosystem. Valued at a projected $474 billion in 2024, the Chinese social commerce market operates almost entirely on closed-loop infrastructures where product discovery, extensive research, financial transactions, and post-purchase advocacy occur without the user ever leaving the host application 18. Two dominant platforms perfectly represent the dichotomy of this market and provide a blueprint for understanding modern consumer behavior: Douyin and Xiaohongshu.
Douyin's High-Velocity Infrastructure
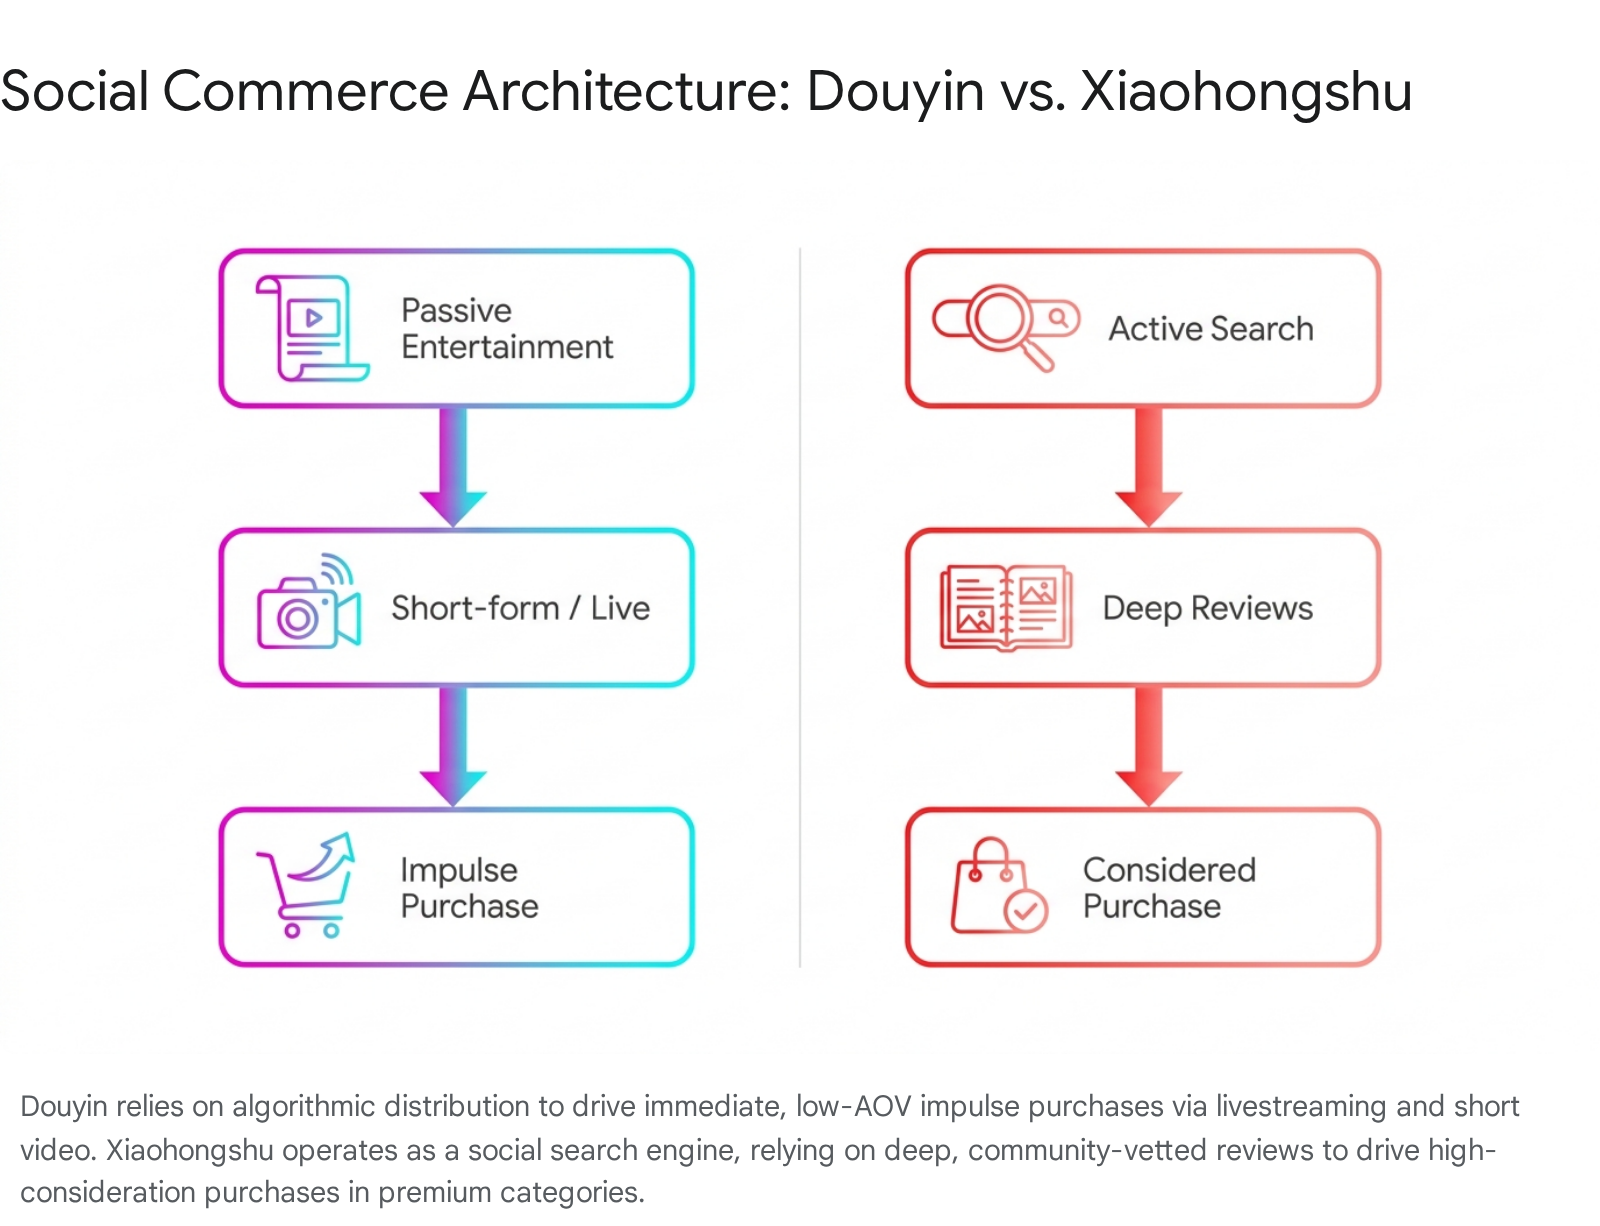
Douyin, the domestic Chinese predecessor to TikTok operated by ByteDance, boasts over 700 million daily active users and commands an average daily usage of 89 minutes 18. Its commerce model is predicated on entertainment-led, high-frequency impulse purchases. The underlying algorithm relies heavily on an "interest graph," utilizing advanced artificial intelligence to continuously serve highly targeted short-form videos and live-streaming broadcasts 33.
Douyin's live commerce architecture is highly advanced and integrated, driving extraordinary conversion rates between 5% and 20% during peak digital shopping festivals 18. The platform excels in driving immediate sales velocity for mass-market consumer goods typically priced under ¥200 (approximately $28) 18. E-commerce revenue on Douyin exceeded 3.5 trillion yuan in 2024, highlighting the sheer scale and profitability of algorithmic impulse shopping when paired with frictionless, one-tap payment systems 33.
Xiaohongshu and High-Trust Consumer Intent
In sharp contrast to Douyin's high-velocity feed, Xiaohongshu (Little Red Book) operates as a community-driven lifestyle search engine, supporting over 300 million active users 3019. The platform is structurally similar to a hybrid of Instagram and Pinterest but functions primarily as a high-trust product review repository. Unlike Douyin's passive algorithmic feed, over 65% of Xiaohongshu's traffic is generated via active user search queries, demonstrating incredibly high, pre-existing purchase intent 35.
Xiaohongshu's audience is overwhelmingly concentrated among affluent, urban, millennial, and Gen Z demographics who utilize the platform for high-consideration purchases, particularly in luxury, premium beauty, and specialized travel 271835. Recognizing this intent, the platform executed a strategic reorganization to merge its e-commerce buyer and merchant operations into a seamless "Marketplace" tab directly on the home screen 192021. This infrastructure allows brands to track the full data lifecycle - from initial content exposure to user interaction, and finally to transactional conversion - all within a secure, walled data garden 20.
Enterprise Economics and Business-to-Business Applications
While consumer goods initially dominated creator marketing, Business-to-Business (B2B) applications represent the fastest-growing subcategory in the 2026 digital economy. Total B2B influencer expenditure reached $4.1 billion, reflecting a massive 47% year-over-year increase 4. This rapid adoption is driven by fundamental shifts in corporate procurement behavior and information consumption.
Modern B2B buying committees - which typically involve 6 to 10 distinct stakeholders - increasingly rely on external subject matter experts, independent analysts, and industry luminaries to validate complex purchasing decisions 2240. As generative AI engines flood the internet with synthesized content, corporate buyers face a trust deficit; consequently, 87% of B2B decision-makers report trusting human thought leadership over traditional corporate advertising 40.
B2B influencer marketing demonstrates exceptional financial efficiency in navigating this trust deficit. While traditional B2B marketing channels average a 5:1 ROI, dedicated B2B influencer awareness campaigns routinely deliver between 3x and 5x returns, and specialized bottom-funnel initiatives perform even better 911. When integrated into targeted lead generation and demand capture strategies - specifically within the enterprise software and SaaS verticals - influencer initiatives command up to an 11x ROI compared to traditional digital advertising, generating leads of significantly higher quality 4.
A comprehensive 2026 benchmarking study by Forrester Research and Ogilvy, which analyzed 3,100 B2B campaigns across 22 industry verticals, found that the average B2B influencer ROI escalated to 647% 23. In high-friction industries characterized by long sales cycles, such as cybersecurity and cloud infrastructure, influencer-led demand generation produced an impressive average of $8.20 in validated pipeline revenue for every $1 invested 23. Additionally, multi-stakeholder campaigns that engaged three or more influencers to surround a single corporate buying committee outperformed single-influencer strategies by 73% in closed-deal attribution 23.
Because of these outsized returns, the perception of B2B influencer marketing has shifted from an experimental edge-case to a strategic necessity. Currently, 89% of B2B organizations maintain dedicated influencer marketing budgets, up from 81% in 2024 23. The average annual allocation for B2B influencer programs reached $312,000 in 2026, marking a 58% increase over prior years 23. These funds are primarily deployed across LinkedIn and industry-specific podcast networks, where text-based and audio insights generate 3.2x more qualified leads than standard paid social media 423.
| Metric Category | B2C Influencer Average | B2B Influencer Average |
|---|---|---|
| Primary Platform Focus | Instagram, TikTok, YouTube | LinkedIn, YouTube, Podcasts |
| Average Campaign ROI | ~5.78x | 6.47x (up to 11x in SaaS) |
| Key Performance Indicator | Direct Sales, Cost Per Acquisition | Pipeline Revenue, Lead Quality, Trust |
| Sales Cycle Impact | Immediate / Impulse | 58% reduction in enterprise sales cycle |
| Dedicated Budget Adoption | ~86% of brands | 89% of organizations |
| Table 2: Operational and Financial Dynamics of B2C versus B2B Influencer Marketing 4691123. |
Attribution Frameworks and Measurement Methodologies
The most severe operational challenge currently facing the influencer marketing sector is the accurate attribution of performance. Upwards of 79% of marketers report struggling to accurately measure influencer ROI, and 48% cite attribution as their most significant capability gap 2443. Historically, brands relied on Earned Media Value (EMV) or simplistic last-click attribution models to gauge success.
However, EMV merely estimates media equivalency without measuring actual business outcomes, and last-click methodology is structurally biased against creator content 1314. Influencers typically operate in the upper and middle segments of the consumer funnel, seeding intent and building brand affinity. In a last-click model, the consumer who views an influencer's video but later searches for the brand organically will have their purchase incorrectly credited to direct traffic or a branded Google search ad, actively masking the creator's true ROI 13.
The Evolution of the IMPACT Framework
To counteract this measurement gap, sophisticated organizations in 2026 deploy structured, multi-dimensional evaluation criteria, commonly referred to as the IMPACT framework. This methodology moves beyond vanity metrics to assess genuine business contribution through the following sequence: Impressions and Reach (evaluating total unique exposure against target audience size), Meaningful Engagement (weighing active signals like saves and shares over passive likes), Purchase Attribution (calculating direct conversions via trackable links), Audience Quality (scoring demographic alignment and follower authenticity), and Content Performance (measuring creative reuse and lift) 14.
By analyzing these variables holistically rather than in isolation, brands can establish an accurate Cost Per Acquisition (CPA) and Return on Ad Spend (ROAS) that reflects the influencer's complete contribution to the sales cycle. For standard digital tracking, a U-shaped or position-based attribution model - allocating 40% credit to the first touch, 20% evenly across middle touches, and 40% to the final conversion driver - is heavily recommended for appropriately valuing the influencer's introductory impact 1444.
Marketing Mix Modeling and Causal Incrementality
As deterministic user tracking faces unprecedented regulatory and technical constraints, the ultimate source of truth in 2026 relies on Bayesian Marketing Mix Modeling (MMM) and causal incrementality testing. Rather than attempting to track the fragmented journey of an individual user, modern MMM applies multivariate statistical regression to aggregated historical data 444546474849. This top-down approach quantifies the exact revenue impact of specific influencer expenditures while simultaneously controlling for external market variables like seasonality, competitor pricing actions, and broader economic conditions 444648.
When MMM is combined with "always-on" incrementality tools that utilize geo-holdout experiments - intentionally withholding influencer media in specific geographic markets to measure baseline sales against active markets - Chief Marketing Officers can isolate the true, causal return on ad spend 134647. This layered methodology allows organizations to make highly confident budget allocation decisions across online and offline channels without relying on invasive user-level surveillance 454749.
| Attribution Methodology | Mechanism | Primary Advantage | Key Limitation |
|---|---|---|---|
| Last-Click Attribution | Credits 100% to final touchpoint | Simple to implement, standard in legacy analytics | Chronically undervalues influencer upper-funnel intent |
| Position-Based (MTA) | Credits first (40%), middle (20%), last (40%) | Balances discovery and conversion value | Heavily impacted by cookie deprecation and signal loss |
| Incrementality Testing | Geo-holdout or A/B audience splits | Proves absolute causal lift and revenue generation | Requires high data quality and market stability to run |
| Marketing Mix Modeling | Statistical regression on aggregate data | Privacy-compliant, accounts for offline/external factors | Complex to calibrate, relies on historical data volume |
| Table 3: Comparison of 2026 Influencer Marketing Measurement Models 131444464748. |
Server-Side Infrastructure and API Integrations
The necessity for advanced modeling is driven entirely by the collapse of legacy tracking infrastructure. The deprecation of third-party cookies by Safari (ITP) and Firefox (ETP), the gradual phase-out by Google Chrome, strict data privacy regulations (GDPR, CCPA), and Apple's App Tracking Transparency (ATT) have fundamentally altered digital tracking 50515253. Client-side pixel tracking, which relies on placing a cookie in a user's browser, is actively suppressed by built-in browser protocols and ad blockers, resulting in massive data gaps 5154.
The Transition to Server-to-Server (S2S) Tracking
To maintain conversion visibility in this post-cookie environment, brands have rapidly transitioned to Server-to-Server (S2S) tracking and Conversions APIs (CAPI). Under a server-side architecture, when a consumer clicks an influencer's specialized affiliate link, the system generates a unique, first-party ClickID that is not dependent on a browser cookie 5355.
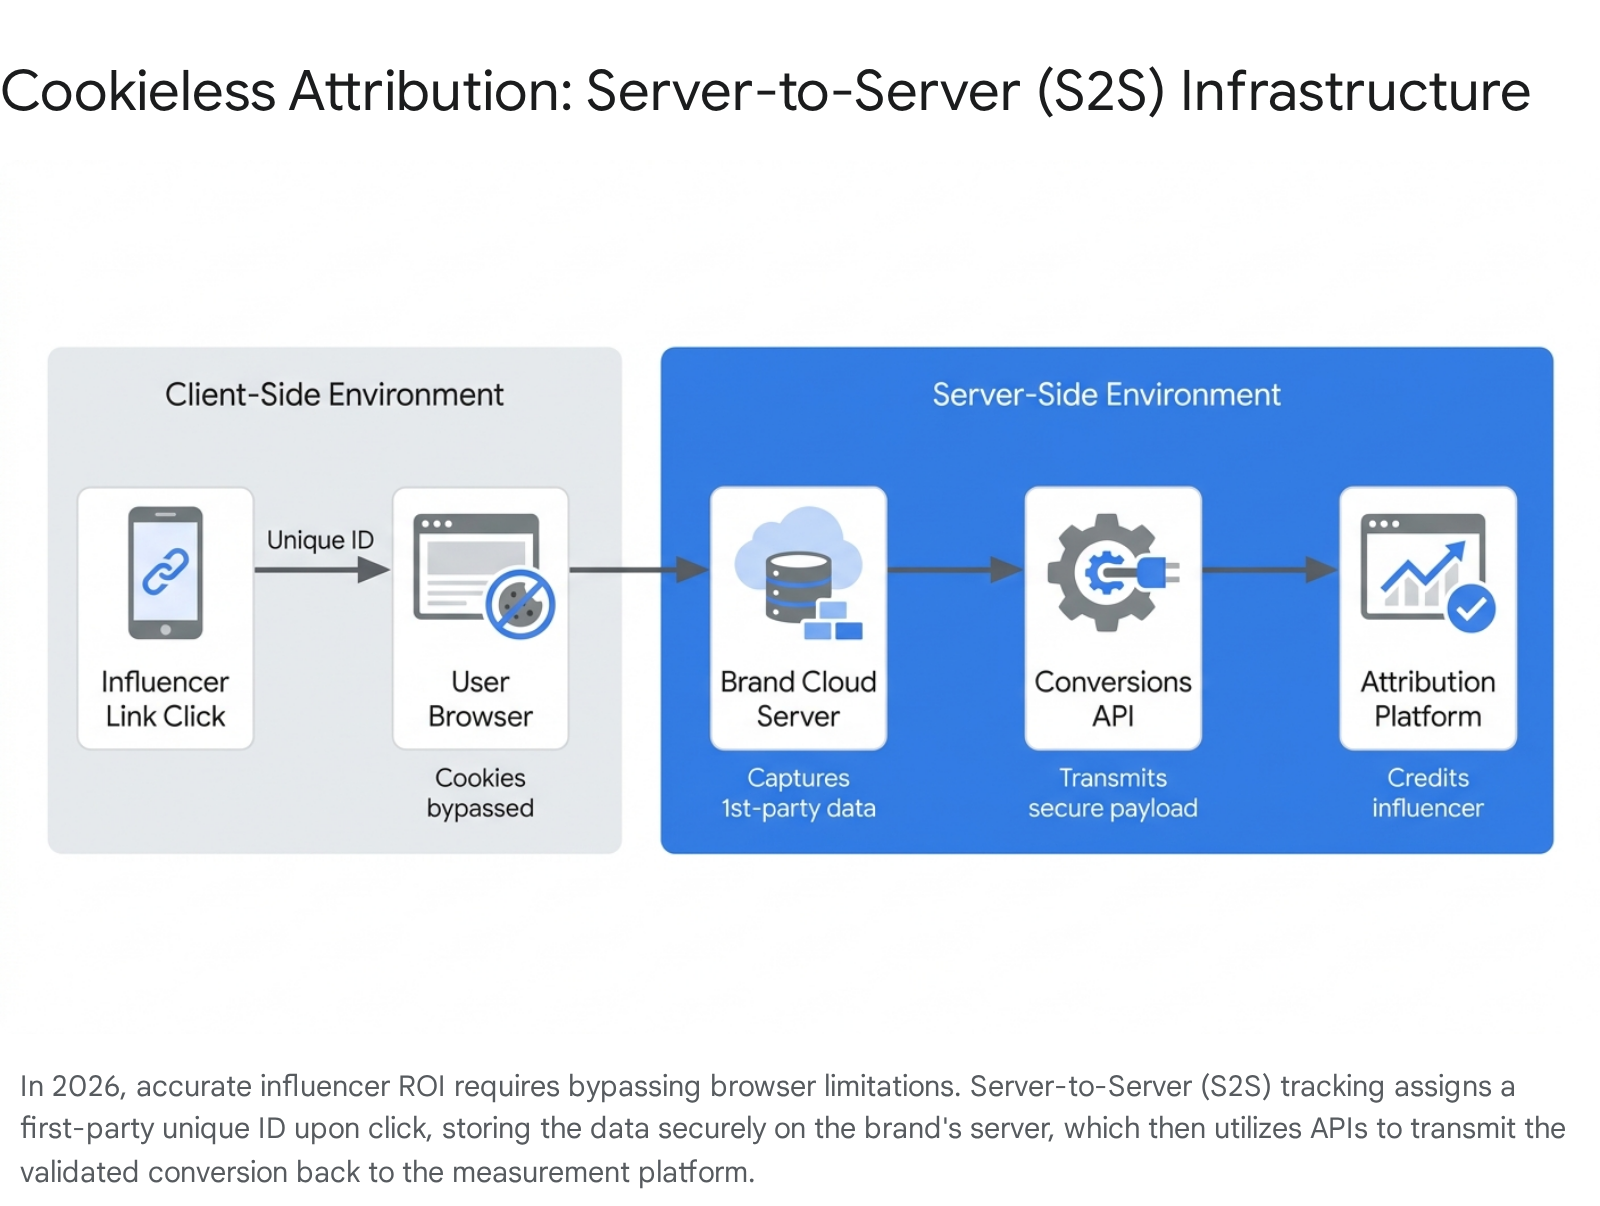
When that consumer subsequently completes a purchase, the brand's proprietary cloud server captures the conversion data and transmits it directly back to the affiliate tracking platform or ad network via a secure Application Programming Interface (API) 515254. This transmission occurs entirely back-end, bypassing browser-level ad blockers, cookie consent limitations, and device-level privacy constraints 5254. Major ad platforms, including Meta, TikTok, and Snapchat, have deployed their own conversion APIs, establishing server-side tracking as the only viable method for deterministic influencer affiliate tracking in 2026 54.
Zero-Party Data Integration
The shift to server-side infrastructure operates in tandem with the prioritization of zero-party data. Unlike inferred third-party data or observed first-party website analytics, zero-party data is information that a customer intentionally and proactively shares with a brand, such as detailed product preferences submitted through a quiz 50. By coupling influencer traffic with zero-party data capture experiences, brands enrich their internal CRM profiles with highly accurate intent signals. These compliant datasets can then be pushed via APIs to ad platforms to create highly efficient lookalike audiences, driving down overall customer acquisition costs without violating data privacy boundaries 50.
Systemic Fraud and Artificial Intelligence Dynamics
The maturation of the influencer ecosystem in 2026 is deeply intertwined with the deployment of artificial intelligence. AI adoption represents the critical dividing line between highly optimized brand portfolios and stagnant marketing programs. Approximately 66.4% of marketing professionals report definitively improved campaign outcomes following the integration of AI tools, particularly for predictive performance forecasting, workflow automation, and algorithmic creator matching 1710.
Crucially, AI plays an existential role in securing ROI by neutralizing systemic fraud. The influencer fraud industry - characterized by the deployment of automated bot networks, synthetic profiles, and purchased engagement pods - continues to drain enterprise capital, costing brands an estimated $1.3 billion annually 14. A recent joint study by Kantar and IZEA found that brand concern over fake influencers escalated to 76%, largely driven by a 91% year-over-year surge in AI-generated synthetic profiles attempting to mimic authentic human engagement 2. To combat this, advanced machine learning models now execute deep demographic audits, analyzing real-time sentiment, follower growth velocity curves, and geographic alignment to generate definitive "Audience Quality Scores" before any contract is signed 1429.
Concurrently, brands are increasingly exploring legitimate, fully disclosed AI-generated virtual influencers. By 2026, corporate spending on virtual creators reached $1.37 billion, accounting for roughly 4.2% of the total influencer marketing spend globally 4. Remarkably, these virtual entities generate an average engagement rate of 5.67% - approximately three times higher than human influencers with equivalent audience sizes 4. While virtual influencers fundamentally lack the organic parasocial authenticity of human creators, their commercial utility is clear: they present zero controversy or PR risk, allow for total brand creative control, require zero production downtime, and operate with dramatically lower overhead costs, making them highly attractive for specific, controlled campaign executions 4.
The 2026 data confirms that influencer marketing operates as a measurable, highly profitable commercial engine. To capture the documented $5.78 to $6.93 baseline ROI, organizations must abandon vanity metrics and follower-chasing mentalities. Success requires prioritizing highly engaged micro-influencers, adapting to closed-loop social commerce infrastructures, and deploying rigorous, API-driven server-side tracking to prove absolute financial contribution in a privacy-restricted digital economy.