Income effects on daily emotional experience and life satisfaction
Foundational Concepts and Definitions
The relationship between financial resources and human happiness constitutes one of the most extensively scrutinized inquiries in behavioral economics, psychology, and public policy. Historically, the academic consensus rested on paradigms such as the Easterlin Paradox and early empirical studies suggesting that while income correlates with well-being, the psychological benefits of money exhibit rapid diminishing returns and eventually plateau. To comprehend this relationship, empirical research relies upon a fundamental distinction between two dimensions of subjective well-being: evaluative well-being and experienced well-being 12.
Evaluative Well-Being
Evaluative well-being refers to an individual's summary assessment of their life when they pause to reflect upon it 12. This metric captures overarching life satisfaction and is fundamentally cognitive. It is frequently measured using instruments such as Cantril's Self-Anchoring Scale, wherein respondents are asked to visualize a ladder with steps numbered from zero to ten, where zero represents the worst possible life and ten represents the best possible life 2. Decades of cross-sectional and longitudinal research have consistently demonstrated that evaluative well-being rises indefinitely with income, showing an approximately linear relationship with the logarithm of income across virtually all socioeconomic strata and geographic boundaries 23.
Experienced Well-Being
Experienced well-being, conversely, measures the emotional quality of an individual's everyday life 12. Often referred to as hedonic well-being or emotional well-being, it assesses the real-time frequency and intensity of specific affective states, such as joy, fascination, anxiety, sadness, and anger 2. While evaluative well-being is a reflective judgment, experienced well-being focuses on how individuals feel during the actual moments of their lives 1. The trajectory of experienced well-being as a function of income has been the subject of profound academic conflict, driven primarily by variations in how researchers define, capture, and quantify these transient emotional states 456.
Methodological Frameworks of Early Literature
The contemporary debate regarding income and experienced well-being is anchored by two foundational studies that reached highly publicized, contradictory conclusions: Kahneman and Deaton (2010) and Killingsworth (2021). The divergence in their findings was largely the byproduct of distinct methodological architectures, particularly regarding data collection temporalities and measurement scales 5.
The Plateau Hypothesis
In 2010, researchers Daniel Kahneman and Angus Deaton analyzed data from the Gallup-Healthways Well-Being Index 2. The dataset encompassed more than 450,000 responses from residents across all fifty United States, collected between 2008 and 2009 via telephone interviews using a dual-frame random-digit dial methodology 2. The original sample of 709,183 observations was rigorously refined; researchers deleted 14,425 observations for unreliable income reporting, 172,677 for missing income data, and 14,510 as outliers, resulting in a loss of 28.4% of the original sample 2.
To measure emotional well-being, the Gallup survey asked dichotomous (yes/no) questions about whether respondents experienced specific emotions "yesterday" 27. The primary finding of this study was that while life evaluation rose steadily with log(income), emotional well-being increased only up to a specific threshold. Kahneman and Deaton reported a flattening pattern where the affective benefits of income plateaued between $60,000 and $90,000, with $75,000 subsequently serving as the commonly cited threshold 28. Beyond an annual household income of $75,000, the data indicated no further progress in daily emotional well-being 8. Based on historical inflation tracking from the U.S. Bureau of Labor Statistics, $75,000 in 2010 possesses the equivalent purchasing power of approximately $113,500 in 2026 dollars, positioning this psychological threshold within the bounds of a comfortable, middle-class standard of living 910.
The Linear-Log Paradigm
In 2021, Matthew Killingsworth challenged the 2010 consensus by utilizing Ecological Momentary Assessment (EMA) 1. Killingsworth developed a smartphone application titled "Track Your Happiness," which prompted participants at random, algorithmically determined intervals throughout the day to report their emotional state in real-time 16. By requesting data regarding how the individual felt "right now," this method mitigated the retrospective recall bias inherent in asking participants to evaluate their emotions from the preceding day 110.
The sample consisted of 33,391 employed, working-age adults (ages 18 to 65) living in the United States, generating over 1.7 million continuous-scale reports 1. Participants rated their current feelings on a continuous response scale ranging from "Very bad" to "Very good" 17. The sample was restricted to households earning at least $10,000 annually to reduce confounding effects associated with unemployment or extreme poverty, and the median household income of the sample was $85,000 1.
Killingsworth's findings contradicted the established plateau model. His data demonstrated a linear-log pattern wherein average experienced happiness rose consistently with log(income) well beyond the previously established $75,000 threshold 6. The data showed no evidence of an asymptote or satiation point, even at income levels exceeding $200,000 per year 67.
Comparison of Methodological Parameters
The discrepancies between the 2010 and 2021 findings necessitated a critical examination of their methodological variables. Table 1 outlines the structural differences that contributed to the conflicting conclusions.
| Methodological Parameter | Kahneman & Deaton (2010) | Killingsworth (2021) |
|---|---|---|
| Data Collection Instrument | Gallup-Healthways Telephone Survey | "Track Your Happiness" Smartphone Application |
| Sample Size | ~450,000 respondents | 33,391 respondents (1.7 million reports) |
| Measurement Temporality | Retrospective (recall of emotions from "yesterday") | Real-time (random ecological momentary assessment) |
| Measurement Scale | Dichotomous (Yes/No) | Continuous sliding scale ("Very bad" to "Very good") |
| Data Exclusions | Dropped 28.4% of data for missing/unreliable income 2 | Restricted to household incomes ≥ $10,000 1 |
| Primary Conclusion | Emotional well-being plateaus at ~$75,000 | Emotional well-being rises linearly with log(income) indefinitely |
The Adversarial Collaboration and Synthesis
Recognizing the stark contradiction in their empirical findings, Kahneman and Killingsworth engaged in an "adversarial collaboration" mediated by Professor Barbara Mellers 46. This epistemological process, originally championed by Kahneman, resolves scientific disputes by requiring disagreeing parties to jointly analyze pooled data under the supervision of a neutral third-party arbiter 6. The objective was to search for a coherent interpretation that could reconcile the two datasets, resulting in a 2023 synthesis published in the Proceedings of the National Academy of Sciences 468.
Identification of the Ceiling Effect
The critical breakthrough of the adversarial collaboration occurred when the researchers re-evaluated the measurement scales utilized in the 2010 study 811. The authors determined that Kahneman and Deaton had fundamentally mislabeled their dependent variable 711. Because the 2010 study utilized dichotomous questions (measuring the presence or absence of specific emotions), a large majority of respondents quickly reached the maximum positive score 48. In the critical region of higher incomes, approximately 85% of responses were at the scale's maximum 12.
Consequently, the measurement instrument suffered from a severe ceiling effect, rendering it insufficiently sensitive to distinguish among varying degrees of happiness among individuals who were already reasonably happy 411. The arbiter and authors concluded that the 2010 study did not measure general happiness; rather, it functioned effectively as an instrument measuring the absence of unhappiness 468. The plateau observed at $75,000 was not the point at which happiness ceased to increase, but rather the point at which income could no longer further reduce foundational misery 8.
Quantile Regression Analysis
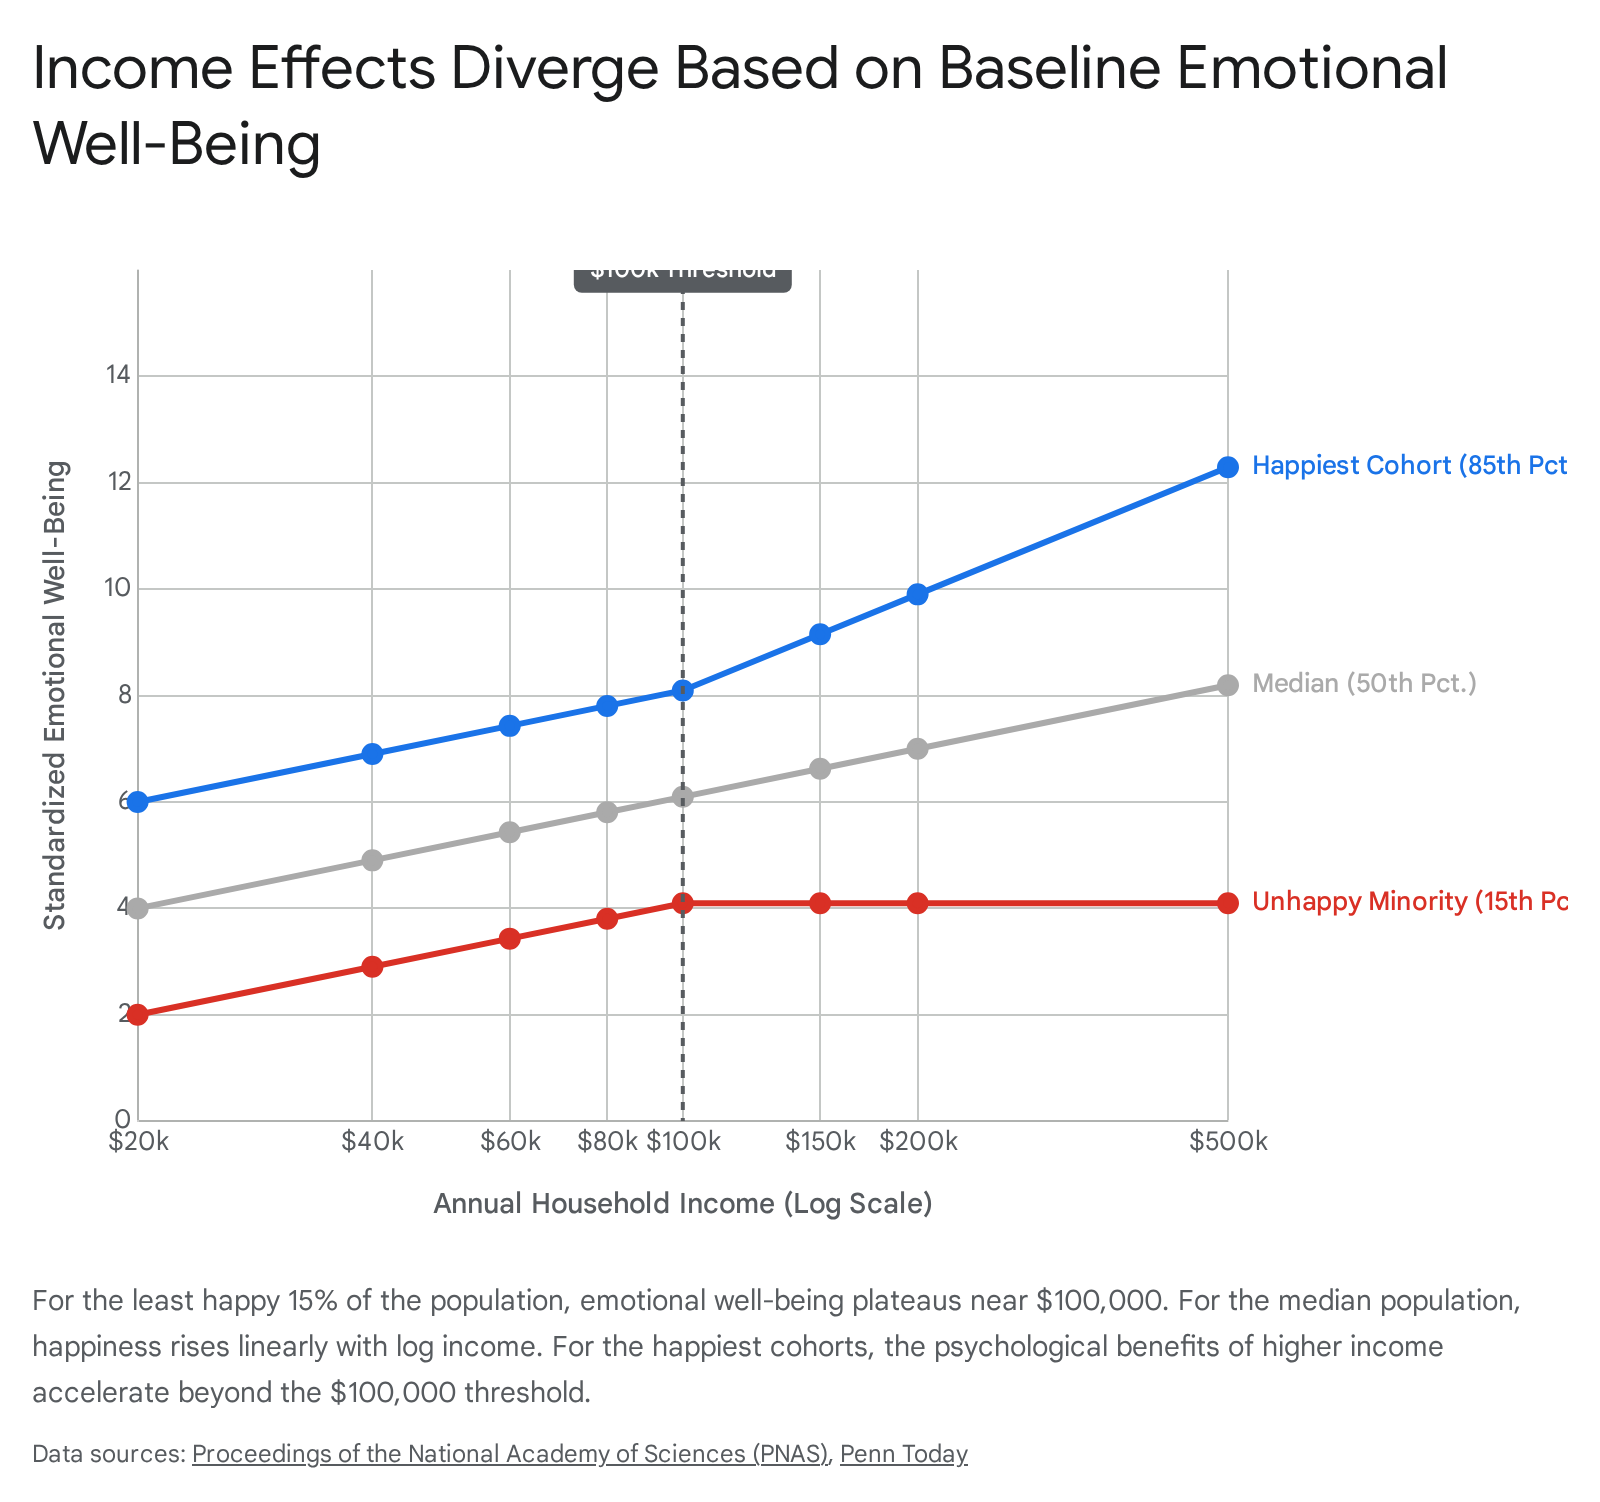
Applying this insight to Killingsworth's more sensitive 2021 dataset, the research team hypothesized that the relationship between income and happiness is not homogeneous across the population 56. Instead of analyzing the data strictly through average associations, they employed piecewise quantile regression to compute separate slopes in the lower range of incomes (less than $100,000) and in the higher range (above $100,000) for different percentiles of baseline emotional well-being (specifically, the 15th, 30th, 50th, 70th, and 85th percentiles) 413.
This analytical approach revealed that both original studies were partially correct, but their findings applied to different psychological sub-cohorts. The function linking income to emotional well-being changes systematically depending on an individual's baseline emotional health 6.
The Satiation Threshold of the Unhappy Minority
For the least happy 15% to 20% of the population, the relationship between income and happiness mimics the original Kahneman and Deaton findings 4. Within this unhappy minority, emotional well-being increases rapidly at lower income tiers 46. The marginal utility of a dollar is highly effective at alleviating suffering for those experiencing resource scarcity. However, this increase levels off abruptly at approximately $100,000 per year (adjusted for inflation from the original $90,000 upper bound of Kahneman and Deaton's critical income bracket) 4612.
Beyond the $100,000 threshold, the slope of happiness versus income for the 15th percentile becomes near-zero and statistically nonsignificant 4. The data indicates an absolute plateau, signifying that no amount of additional financial resources improves the daily emotional experience of this specific, deeply unhappy cohort 4.
Accelerating Returns of the Happy Majority
In stark contrast to the unhappy minority, the "happier majority" experiences continuous emotional benefits from rising income. For individuals residing in the middle of the happiness distribution (the 30th to 50th percentiles), daily emotional well-being gains remain roughly linear with log(income) across all measured income brackets 46.
Most notably, for the happiest 30% of the population, the correlation between money and happiness actually accelerates beyond the $100,000 mark 46. For individuals who already possess a strong baseline of psychological well-being, excess capital compounds their ability to generate positive emotional states 614. In the high range of incomes, very happy people gain significantly more emotional utility from increased income than unhappy people do 4.
Psychological Mechanisms of the Income Effect
The quantitative data derived from quantile regression points toward complex physiological and psychological realities. The divergence in happiness curves is driven by what money is empirically capable of resolving versus what remains beyond the reach of financial capital.
Limits of Financial Capital on Clinical Misery
The $100,000 plateau observed in the unhappy minority represents the financial limit of misery alleviation 48. The synthesis authors posited that certain profound miseries cannot be resolved through financial means 8. Principal among these are clinical depression, complex bereavement, and severe heartbreak 4615.
When an individual suffers from conditions such as Prolonged Grief Disorder (PGD) or Persistent Complex Bereavement Disorder (PCBD), the psychological architecture of the brain undergoes severe functional alterations 1516. Affective neuroscience indicates that prolonged, maladaptive grief activates a neurological pathway that initiates a cascade of neurotransmitters, actively inhibiting the brain's reward-seeking system 16. This prolonged grief increases long-term risks for severe physical morbidities, including cardiovascular disease, immune dysfunction, impaired sleep, and suicidal ideation 151617. Studies show that 40% of bereaved individuals meet the criteria for major depression one month after loss, with 24% still exhibiting symptoms two months later 17.
Because clinical depression and traumatic grief physically inhibit the brain's capacity to process reward and pleasure, an influx of financial capital fails to generate subjective well-being. Earning $100,000 effectively mitigates the compounding stress of housing insecurity, starvation, and lack of basic healthcare, but earnings of $200,000 or $500,000 provide no pharmacological or psychological cure for an inhibited reward system 418. As Killingsworth summarized, "if you're rich and miserable, more money won't help" 6.
Agency, Time Scarcity, and Stress at High Incomes
For individuals not burdened by clinical misery, money serves primarily as an instrument of autonomy. Killingsworth notes that a greater feeling of control over one's life explains approximately 75% of the positive association between money and happiness 19. As income scales, it provides the freedom to dictate the terms of one's daily existence, allowing individuals to trade money for time, targeted experiences, and convenience.
However, the relationship between income and daily experience is not uniformly positive across all psychological dimensions. A 2025 study in Communications Psychology analyzing 2.05 million U.S. adults from the Gallup Daily Poll found that while higher income is associated with greater life satisfaction, it is also associated with a higher prevalence of stress past a certain threshold 20. At lower income levels, as income increases, stress decreases. However, the data reveals a turning point: for household incomes above approximately $63,000 to $105,000 (depending on the demographic sub-group), respondents become increasingly likely to experience daily stress 20. Researchers hypothesize that stress at higher income values relates to lifestyle factors associated with affluence, professional demands, and time scarcity, rather than basic needs deprivations 2021.
Variability Reduction in Higher Income Brackets
Further research indicates that higher incomes not only raise average well-being but also systematically alter the distribution of happiness. A 2023 study from Yale School of Management analyzed data using the Cantril ladder and demonstrated that as incomes rise, the variability in well-being declines 22. Wealthier individuals are more similar to each other in their reported well-being than individuals with fewer financial resources 22. The narrowing of the happiness range among wealthier demographics stems almost entirely from a drastic reduction in the share of people rating their well-being poorly 22. High income systematically eliminates the lowest tiers of human misery, creating a tighter, more uniformly satisfied cohort at the top of the economic distribution 22.
Extreme Wealth and Upper-Bound Satiation
While the 2023 synthesis established that happiness continues to rise for the majority past $100,000, it left open the question of whether absolute satiation occurs at extreme levels of wealth. Independent research published in 2024 sought to map the far right tail of the economic distribution.
Life Satisfaction Among High Net-Worth Individuals
To evaluate the upper bounds of the income-happiness correlation, Killingsworth (2024) compared a large U.S. sample of standard earners (N = 33,269) with two distinct samples of high-net-worth individuals (N = 49 and N = 2,129) possessing a median net worth between $3 million and $7.9 million 319. Data from the ultra-wealthy is historically difficult to obtain, as high-net-worth individuals are disinclined to spend time taking psychological surveys 19.
The analysis revealed that wealthy individuals report substantially and statistically significantly higher life satisfaction than middle-class earners making $500,000 per year 3. Furthermore, the magnitude of the difference was profound: the difference in life satisfaction between the ultra-wealthy and middle-income earners ($70,000 to $80,000) was nearly three times as large as the difference between middle-income earners and low-income populations 319.
Logarithmic Scaling at the Top of the Distribution
The inclusion of high-net-worth individuals demonstrated that differences in wealth and income ultimately accounted for closing 58% of the gap between the lowest observed satisfaction scores and the absolute maximum of the scale 3. This provides strong empirical evidence against the concept of absolute satiation for the healthy majority. The relationship remains logarithmic - meaning an individual must double their income to achieve the same unit increase in well-being - but the trend line continues upward far past incomes of hundreds of thousands of dollars per year 323.
Macroeconomic Variables and Cross-Cultural Contexts
While the Killingsworth-Kahneman synthesis provides a robust model for United States residents, the relationship between income and happiness exhibits high plasticity when subjected to different macroeconomic variables, cultural structures, and degrees of systemic inequality.
Income Inequality and the Easterlin Paradox
The Easterlin Paradox, formulated in 1974, posited that while wealthy individuals within a given country are happier than poor individuals, countries do not inevitably become happier as their national wealth increases over the long term 2426. Recent longitudinal data resolves this paradox by identifying income inequality, often measured by the Gini coefficient, as the primary modulating variable 2526.
An analysis of eleven years of panel data from 31 provinces in mainland China utilizing fixed-effects models demonstrated that the Gini coefficient acts as a severe buffer against the psychological benefits of GDP growth 2728. In temporal relationships within China, a 46.70% increase in GDP per capita correlates with a 0.38 unit increase in subjective well-being 2728. However, a 0.09 increase in the Gini coefficient results in a 1.47 unit decrease in subjective well-being 27. Crucially, when the Gini coefficient surpasses 0.609, indicating severe income inequality, the psychological benefits of GDP per capita growth vanish completely 2728. According to Relative Deprivation Theory, extreme inequality triggers negative social comparisons that erode well-being regardless of absolute income gains 27.
The Latin American Paradox and Cultural Modulators
The influence of cultural variables frequently overrides strict economic determinism. Epidemiologists and economists have long documented the "Latin American Paradox," wherein Latin American countries, and Latino populations within the United States, exhibit disproportionately high levels of life satisfaction and happiness relative to their modest average income levels 31. Analysis using IPUMS Health Survey data suggests that Latino populations are statistically less sensitive to economic factors compared to non-Latinos 31. Within these populations, socio-cultural variables - such as robust family structures, religiosity, and strong communal relationships - act as the primary determinants of happiness, compensating for lower financial capital 31.
Subjective Well-Being in Non-Monetary Societies
Further contextualizing the Western data, a 2024 study by the Institute of Environmental Science and Technology of the Universitat Autònoma de Barcelona (ICTA-UAB) measured subjective well-being in 19 isolated, small-scale Indigenous communities globally 29. Among the 2,966 individuals surveyed, only 64% of households possessed any cash income 29.
Despite extreme monetary poverty relative to Western metrics, these communities reported remarkably high average levels of life satisfaction, with scores matching or exceeding those in wealthy industrialized nations 29. This indicates that while money is a primary driver of autonomy and misery alleviation in highly financialized, unequal societies, it is not an inherent biological prerequisite for high evaluative well-being when alternative social, communal, and environmental support structures are intact 29.
Regional Variations
Table 2 outlines how the income-happiness correlation has shifted over time across different global regions, largely dictated by shifts in systemic inequality and national wealth.
| Region / Population | Trend in Income-Happiness Correlation | Primary Macroeconomic Driver / Context |
|---|---|---|
| United States | Increasing since the 1970s | Rising GDP per capita combined with rising inequality 25 |
| Europe (16 Nations) | Increasing since the 1970s | Rising GDP per capita combined with rising inequality 2530 |
| Latin America | Decreasing since 1997 | Falling regional income inequality 2530 |
| China (Provincial) | Plateaued/Nullified when Gini > 0.609 | High Gini coefficient overrides absolute GDP gains 2728 |
| Urban vs. Rural | Urban populations generally report higher LS | Driven by access to education and infrastructure, though rural areas often report higher positive affect 31 |
Methodological Limitations and Ongoing Critiques
The adversarial collaboration, while resolving the immediate discrepancy between the 2010 and 2021 datasets, has been subjected to ongoing statistical and methodological critiques regarding its analytical assumptions and data collection methods.
Ecological Momentary Assessment Selection Bias
While the 2021 Killingsworth study and the subsequent 2023 synthesis provided a temporally accurate measure of well-being, the reliance on smartphone-based Ecological Momentary Assessment introduces specific selection biases. Research into EMA participation indicates consistent demographic and psychological differences between individuals who accept invitations to participate in high-frequency smartphone studies and those who decline 32.
Participants in smartphone-based studies are statistically more likely to be younger, female, possess higher educational attainment, report better baseline health, and have higher incomes 3233. Non-EMA studies demonstrate that lower levels of openness and higher levels of conscientiousness predict greater completion of longitudinal survey designs, skewing the psychological profile of the sample 32. Furthermore, participation rates among older adults and certain minority populations tend to be significantly lower due to technological barriers or differential survey response motivations 3234. Consequently, while the Killingsworth dataset was vast, the rigorous demands of real-time digital sampling may inherently under-sample the most severely distressed, digitally disenfranchised, or cognitively impaired populations 13235.
Causality, Cross-Sectional Data, and Structural Breaks
Both the original studies and the 2023 synthesis rely heavily on cross-sectional data 36. Statisticians, including Andrew Gelman, caution against drawing strict causal interpretations from these average associations 36. The cross-sectional nature of the data reveals that people with higher incomes report higher happiness at a given moment, but it does not definitively prove that directly providing an individual with more money will proportionately increase their happiness. Changes in income rarely occur in a vacuum; a significant increase or decrease in income is generally inextricably linked to major life events - such as promotions, job loss, divorce, retirement, or injury 36. The average associations capture the totality of these life circumstances, meaning the "income effect" is heavily confounded by the sociological and personal environments that facilitate high earnings.
Additionally, a critical re-analysis by Bennedsen (2023) challenged the specific placement of the $100,000 plateau 13. The 2023 synthesis relied on an a priori assumption, defining the threshold based on Kahneman's 2010 inflation-adjusted estimates 1213. Bennedsen applied econometrics techniques designed to detect "structural breaks" to locate the optimal threshold in a purely data-driven manner by minimizing the sum of squared residuals 13. This alternative optimization suggested that the optimal satiation threshold actually sits between $175,000 and $250,000. When setting the threshold optimally at $200,000, Bennedsen found a flat relationship between income and well-being above the threshold regardless of which part of the happiness distribution was considered, suggesting satiation may still occur for the broader population, albeit at a significantly higher income bracket than previously believed 13.
International Replications
Despite domestic critiques, the core architecture of the Kahneman-Killingsworth synthesis has found preliminary support in international replications. A 2024 analysis using the 2012 Health Survey for England (n = 7,179) replicated the findings using a completely different collection technique 40. Analyzing the UK National Health Service's well-being variables, researchers found that for the unhappy minority (the 5th to 35th percentiles), extra income had no association with happiness above a £50,000 threshold 40. Conversely, for the median and majority of the UK population, the log-linear relationship continued above the £50,000 mark 40. This cross-cultural replication provides a strong update in favor of the 2023 synthesis, demonstrating that the dual-cohort nature of the income-happiness relationship is not exclusively an artifact of the American economic system.
Conclusion
The evolution of the academic consensus regarding money and happiness illustrates the critical importance of measurement sensitivity and population heterogeneity in behavioral science. The 2023 adversarial collaboration successfully resolved a decade of contradictory findings by demonstrating that the psychological utility of money is heavily dependent upon an individual's baseline emotional health.
For the majority of the population, money provides continuous, accelerating returns in emotional well-being and life satisfaction by expanding personal agency and control. However, for an unhappy minority, income exhibits a strict plateau at approximately $100,000. Beyond the point of basic physical security, financial capital is an ineffective treatment for deep psychological and emotional wounds, such as clinical depression and traumatic grief. While macroeconomic variables - including national GDP, urban density, and systemic inequality - dictate how deeply an individual's well-being is tethered to their financial status, the fundamental synthesis holds: money can prevent and alleviate circumstantial hardship, but it cannot cure fundamental misery.