Global and United States firearm mortality rates
Methodologies in Global Firearm Data Collection
The quantitative measurement of firearm mortality on a global scale requires the integration of diverse datasets sourced from criminal justice systems, public health records, and specialized international surveys. Understanding the divergence in firearm violence between the United States and peer nations necessitates a foundational review of how these mortality figures are aggregated, categorized, and interpreted across jurisdictions.
Primary Data Sources and Aggregators
Global firearm mortality data relies on a network of international monitoring organizations. The United Nations Office on Drugs and Crime (UNODC) compiles intentional homicide data globally by triangulating records from national law enforcement agencies and public health systems 12. Law enforcement data is primarily generated during the investigation of crime events and submitted via the annual United Nations Survey of Crime Trends and Operations of Criminal Justice Systems (UN-CTS) 2. Conversely, public health data is derived from death certificates processed by medical examiners or health authorities 2. To establish standardized per capita rates, these absolute mortality figures are assessed against demographic data from the United Nations World Population Prospects, which provides official estimates and projections for 237 countries and areas 2.
Beyond the UNODC, the Global Burden of Disease (GBD) study, coordinated by the Institute for Health Metrics and Evaluation (IHME), provides comprehensive age-standardized mortality rates that allow for direct cross-national comparisons of physical violence, self-harm, and unintentional injuries 34. Furthermore, the Small Arms Survey manages the Global Violent Deaths (GVD) database, tracking both direct conflict deaths and civilian homicides to evaluate progress toward the United Nations Sustainable Development Goal 16.1, which aims to reduce all forms of violence and related death rates 5. Because weapon utilization is not universally recorded across all national databases, researchers frequently caution that aggregate firearm mortality values may represent baseline underestimates 1.
Definitional Variances in Homicide and Violence
A critical challenge in global epidemiology is establishing uniform definitions of violence. The UNODC strictly defines "intentional homicide" based on three mandatory elements: the objective killing of a person by another person, the subjective intent of the perpetrator to kill or seriously injure the victim, and the legal element of unlawfulness 12. This rigid categorization ensures that justifiable homicides - such as legitimate self-defense killings by civilians or lethal interventions by law enforcement - are systematically excluded from intentional homicide statistics because they are not legally prohibited under national statutes 126. However, killings classified as acts of terrorism are universally included within intentional homicide aggregates, regardless of internal jurisdictional definitions 12.
In certain comparative studies, such as those analyzing differences between the United States and Canada, definitions remain largely consistent. Both nations exclude justifiable homicides from standard criminal homicide counts, allowing for reliable bilateral comparisons of official police reports 6.
Mortality Categorization by Intent
Firearm mortality is generally disaggregated into three primary categories of intent: intentional homicide, intentional self-harm (suicide), and unintentional (accidental) deaths 47. Depending on the jurisdiction and reporting standard, a fourth category - deaths of undetermined intent - may also be recorded 87. The distinction between these categories is vital, as the epidemiological drivers of firearm suicide fundamentally differ from the socioeconomic and criminological drivers of firearm homicide. Consequently, aggregated "gun death" metrics, while useful for establishing the total public health burden, often obscure the specific mechanisms of mortality affecting different demographic cohorts 89.
Macro-Level Global Firearm Mortality Trends
A longitudinal review of global mortality indicators reveals that firearm violence is not distributed evenly across populations. Instead, it is highly concentrated in specific geographic regions and deeply correlated with local socioeconomic stability, the presence of organized crime, and national firearm regulatory frameworks.
Regional Concentrations of Firearm Violence
Global data indicates that out of approximately 250,000 to 280,000 civilian gun-related deaths occurring worldwide annually, nearly 66% are concentrated in just six nations: Brazil, the United States, Venezuela, Mexico, India, and Colombia 87. When examining violent deaths strictly inflicted by firearms, the geographic disparity is stark. According to the Small Arms Survey, firearms are the instrument of death in 81% of violent fatalities in North America, 71% in South America, 68% in Central America, and 62% in the Caribbean 10. In contrast, firearms account for only 36% of violent deaths in Southeastern Asia and 32% in Southern Asia 10.
Latin America and the Caribbean consistently report the highest per capita rates of firearm homicide. In 2023, Jamaica recorded the highest firearm homicide rate among measured countries at 41.9 to 44.7 deaths per 100,000 residents 81114. El Salvador, Venezuela, and Honduras frequently record total firearm mortality rates exceeding 23 to 45 deaths per 100,000 78. These extreme mortality rates are largely driven by gang warfare, systemic institutional fragility, illicit narcotics trafficking, and the widespread availability of unregulated small arms 11.
Nations with Negligible Firearm Mortality
At the opposite end of the spectrum, numerous developed nations maintain firearm mortality rates approaching zero. Japan, utilizing some of the most restrictive civilian gun control laws globally, routinely reports total firearm death rates of 0.02 to 0.04 per 100,000 people 8712. Similarly, the United Kingdom, which implemented severe restrictions on civilian handgun ownership following the 1996 Dunblane massacre, maintains a firearm mortality rate of approximately 0.04 to 0.20 per 100,000 812. In 2023, Iceland reported zero firearm homicides 11. These jurisdictions demonstrate that high-income, politically stable states with comprehensive firearm regulation consistently isolate their populations from high rates of lethal gun violence.
Global Longitudinal Trends
Historically, global age-standardized mortality rates for suicide by firearm displayed a decreasing tendency from 1990 to 2019, with an Annual Percent Change (AAPC) of -2.0% 1314. This downward trend was largely driven by substantial mortality reductions in the Americas and European regions throughout the 1990s and early 2000s 13. However, recent updates from the Global Violent Deaths database indicate a disruption of broader downward trends in violent fatalities. In 2021, the global rate of firearm killings rose to 3.3 per 100,000 population, marking the first registered increase in global violent death rates since 2016 10. Men constituted 91% of these global firearm victims, though the rate of female violent deaths also experienced its first notable increase since 2016 10.
Comparative Analysis of High-Income Peer Nations
To accurately evaluate the performance of the United States regarding firearm violence, it is necessary to compare it against peer nations - specifically, high-income democracies within the Organisation for Economic Co-operation and Development (OECD) that possess advanced economies, robust healthcare systems, and stable political institutions.
Aggregate Mortality Comparisons in the OECD
When isolated among 65 high-income countries and territories, the United States consistently ranks as the most violent in terms of firearm mortality. Specifically, among World Bank high-income countries with populations exceeding 10 million, the United States ranks first for age-adjusted rates of firearm homicides 3.
The per capita contrast between the United States and its OECD peers is vast. In analyses of age-adjusted firearm homicide rates, the United States experiences a rate 19 times greater than France and 77 times greater than Germany 3. The United States also exhibits 33 times the rate of firearm homicide seen in Australia 3. While a nation like Canada recorded an overall firearm mortality rate of approximately 2.11 per 100,000 (incorporating suicides and homicides), the United States crude rate exceeded 13.1 to 14.6 per 100,000 in the early 2020s 1516.
Table 1: Civilian Firearm Ownership and Aggregate Mortality Rates in Selected High-Income Nations
| Country | Estimated Civilian Firearms per 100 People | Total Firearm Mortality Rate per 100,000 | Firearm Homicide Rate per 100,000 |
|---|---|---|---|
| United States | 120.5 | 13.10 - 14.60 | 4.12 - 4.50 |
| Canada | 34.7 | ~2.11 | 0.50 - 0.70 |
| Norway | 28.8 | ~1.50 | 0.07 |
| Germany | 19.6 | ~1.00 | 0.10 |
| Australia | 14.5 | 0.76 - 0.88 | 0.09 - 0.18 |
| United Kingdom | 4.6 | 0.20 | 0.04 |
| Japan | 0.3 | 0.02 - 0.04 | 0.02 |
Note: Data points represent aggregated multi-year baseline estimates (roughly 2017 - 2024) compiled from the Small Arms Survey, UNODC, and IHME Global Burden of Disease datasets. Ranges denote variations across specific reporting years 1112151718.
The United States as a Statistical Outlier
The United States diverges not only in homicides but in the total prevalence of firearm-related lethality. Across all demographic groups - including children, adolescents, and women - the United States ranks at or above the 92nd percentile globally for overall firearm mortality 4. A comparative review by the Commonwealth Fund demonstrated that death rates from physical violence utilizing firearms in individual United States states are closer to the rates seen in sovereign nations experiencing active conflict than to the rates of peer OECD countries 4.
Even the safest regions within the United States present statistical anomalies when viewed internationally. For example, New Hampshire consistently records the lowest age-adjusted firearm homicide rate in the United States (1.1 per 100,000); however, this "low" rate remains three times greater than the highest rate recorded in Western Europe 3. Conversely, Washington, D.C., records rates exceeding 14.4 per 100,000, aligning closer to the national rates of Brazil or Jamaica 3.
Financial and Public Health Burdens
The immense scale of firearm mortality generates profound public health and economic burdens. In the United States, researchers estimate that firearm violence costs the national economy roughly $557 billion annually, utilizing 2022 data 4. This figure comprises $2.8 billion spent on direct healthcare, mental health, and emergency services, while the vast majority represents the monetized value of quality-of-life losses, pain, and lost well-being 4. The estimated cost is $274,000 per victim and over $25,000 per injured patient, equating to an average cost of $1,700 per United States taxpayer annually 4.
The burden is similarly tracked via Disability-Adjusted Life Years (DALYs). In Canada, for instance, firearm injuries were responsible for 39,789 DALYs in 2019 (comprising years of life lost and years lived with disability), representing a rate of 108.9 per 100,000 15. In recognition of this mounting burden, the United States Surgeon General officially declared firearm violence a public health crisis in 2024, citing that over half of United States adults have either personally experienced a gun-related incident or have a family member who has 419.
Disaggregation of Firearm Mortality by Intent
Analyzing total aggregate "gun deaths" frequently obscures the distinct epidemiological patterns underlying suicide, homicide, and unintentional fatalities. Effective public health responses require analyzing these categories as separate, albeit related, phenomena.
Firearm Suicide Epidemiology
In both the United States and several of its peer nations, suicide constitutes the majority of all firearm deaths. In Canada, suicides account for approximately 80% of all gun deaths; in Australia, the proportion fluctuates between 70% and 76% 1720. In the United States, suicides consistently account for over half of all firearm deaths, representing 56% to 60% of the total in recent years 19.
However, while the proportion of gun deaths attributed to suicide is similar across these nations, the absolute rates differ drastically. Because access to firearms strongly correlates with an increased risk of completed suicide, the high prevalence of firearms in the United States yields unparalleled suicide numbers 17. Only 12 countries globally report a rate of self-harm by firearm as high as the United States 4. From 2012 to 2022, the number of firearm suicides in the United States increased by 31%, culminating in over 27,000 deaths annually - the highest number on record for the CDC 1921. Cumulatively, this resulted in nearly 100,000 more firearm suicides than homicides over that decade 19.
Demographically, firearm suicide heavily impacts older males. In the United States, males are seven times more likely than females to die by gun suicide, with the rate among males aged 70 and older dwarfing any other demographic subgroup 822. A similar pattern is observed in Australia, where the highest rates of self-harm by firearm occur among individuals aged 60 and older 9.
Intentional Firearm Homicides
The trajectory of firearm homicides contrasts sharply with suicides. In the United States, the firearm homicide rate experienced a sustained decline from 1993 (8.4 per 100,000) to 2014 (4.0 per 100,000) before violently reversing course 23. The rate surged during the COVID-19 pandemic, with total firearm homicides increasing by 69% from 2012 levels to reach nearly 21,000 in 2021 1921. By 2024, the volume of gun homicides decreased by 27% to 15,364, yet firearms still accounted for 76% of all homicides nationwide 21. Handguns remain the predominant weapon, utilized in roughly 53% of all United States gun murders 21.
In contrast, neighboring Canada reported a homicide rate of 1.9 per 100,000 in 2023, approximately one-third of the United States rate 6. Crucially, the non-firearm homicide rates between the two countries are nearly identical (1.24 per 100,000 in the US versus 1.18 in Canada); the entirety of the overarching mortality gap is driven by the United States' exponentially higher rate of homicides committed specifically with a firearm 6. In Canada, firearms are present in roughly 38% of homicides, compared to the 76% to 80% norm in the United States 623.
Demographically, firearm homicides are heavily concentrated among young males and present severe racial disparities. In the United States, Black and American Indian/Alaska Native (AIAN) populations endure the highest firearm mortality rates. Between 2000 and 2020, the homicide rate for Black males increased dramatically, and unlike the White population (where 80% of firearm deaths are suicides), approximately 80% of firearm deaths among Black individuals are homicides 1922.
Unintentional Firearm Fatalities
Unintentional or accidental firearm deaths constitute a much smaller fraction of the global burden. In 2013, researchers documented approximately 47,000 unintentional firearm deaths worldwide 7. In the United States, accidental discharges and undetermined intent account for approximately 400 to 500 deaths annually 87. While statistically smaller than suicides and homicides, these incidents predominantly occur in jurisdictions with high household firearm prevalence and less stringent safe-storage regulations.
The Rural and Urban Divide in Firearm Violence
A pervasive narrative in public discourse frames gun violence as an almost exclusive affliction of dense urban centers. However, exhaustive epidemiological and criminological data from North America and Australia demonstrate that rural areas bear a substantial, and frequently higher, per capita burden of firearm mortality.
Shifting Paradigms in United States Rural Mortality
Analysis of the National Vital Statistics System in the United States from 2001 to 2020 reveals a widening divide between rural and urban firearm mortality, with rural counties assuming the greater burden 824. While total intentional firearm deaths were roughly equivalent between the most urban and rural counties in the 1990s, the trend has decisively shifted 824.
Between 2001 and 2010, the most rural counties exhibited a 25% higher overall firearm death rate than the most urban counties 824. This disparity is driven entirely by suicides. Rural counties experienced a 54% to 76% higher gun suicide death rate than major cities 8. Conversely, urban centers maintained a 46% to 50% higher rate of gun homicides 8. Because gun suicides vastly outnumber gun homicides annually, the sheer volume of self-harm in agricultural and remote communities pushes their per capita firearm mortality risk significantly past that of urban environments 824.
Geographic Disparities in Canadian Firearm Crime
Canada exhibits comparable geographical disparities. In 2023, one-quarter (26%) of all police-reported crimes in Canadian rural areas were violent, compared to 22% in urban areas 25. More explicitly, the rate of firearm-related violent crime in rural Canada was nearly twice as high (47 per 100,000 population) as the rate in urban areas (25 per 100,000) 25. A severe north-south divide also exists; the violent crime rate in the rural provincial North was three times higher than in the rural provincial South 25.
The instruments of violence also shift by geography. In Canadian urban centers, handguns are the predominant weapon, present in the vast majority of firearm crimes 2526. In rural areas, violent incidents more frequently involve long guns (rifles or shotguns) or unknown firearm types 25. Furthermore, a population-based study in Ontario demonstrated that males living in rural areas were up to 70% more likely to die by suicide than their urban counterparts, largely due to the intersection of socioeconomic isolation and the high prevalence of agricultural long guns 2728.
Regional Firearm Injury Distribution in Australia
Data from Australia affirms that this rural-urban dynamic is a consistent feature of developed nations with dispersed populations. A longitudinal cohort study of firearm injuries in New South Wales (2002 - 2016) found that the overall rate of firearm injuries was more than twice as high in outer regional, rural, and remote areas (3.8 per 100,000) than in major cities (1.6 per 100,000) 9.
Similar to North America, the specific intent of the injury correlated with geographic remoteness. Assault injury rates were highest in major cities (0.8 per 100,000), while rates of intentional self-harm (1.8 per 100,000) and accidental injuries (1.2 per 100,000) were heavily concentrated in outer regional and remote locales 9. The Australian Institute of Health and Welfare notes that rates of firearm-related hospitalizations and deaths are four and six times higher, respectively, for residents of remote areas compared to urban residents 29.
Table 3: Geographic Distribution of Firearm Violence by Intent
| Geographic Classification | Primary Driver of Firearm Mortality | Predominant Weapon Type | Mortality Risk Relative to Counterpart |
|---|---|---|---|
| Urban / Major Cities | Intentional Homicide / Assault | Handguns | Higher absolute volume of homicides; lower overall per capita death rate. |
| Rural / Remote Areas | Intentional Self-Harm (Suicide) & Accidents | Rifles / Shotguns (Long Guns) | Lower volume of homicides; significantly higher overall per capita death rate. |
Note: Trends are synthesized from vital statistics and law enforcement data across the United States, Canada, and Australia 892425.
Firearm Mortality Among Children and Adolescents
The most pronounced divergence between the United States and global norms lies in the impact of firearm violence on youth populations. The epidemiological profile of pediatric mortality in the United States has fundamentally transformed over the past two decades.
Shifting Causes of Youth Mortality in the United States
Historically, motor vehicle collisions were the leading cause of death for children and teenagers in the United States. However, between 2000 and 2021, motor vehicle fatalities among youth declined by 49% due to stringent automotive safety regulations 30. Concurrently, the child firearm mortality rate doubled from a recent low in 2013 (1.8 per 100,000) to 3.7 per 100,000 in 2021 3031. Consequently, in 2020, firearms officially surpassed motor vehicles to become the leading cause of death for American children and adolescents (ages 1-19) 1930.
In 2021, 2,571 child deaths were attributed to firearms in the United States. Including homicides, suicides, and unintentional discharges, gun violence now accounts for over 8% of all deaths among Americans under the age of 20 330.
International Comparisons of Youth Firearm Deaths
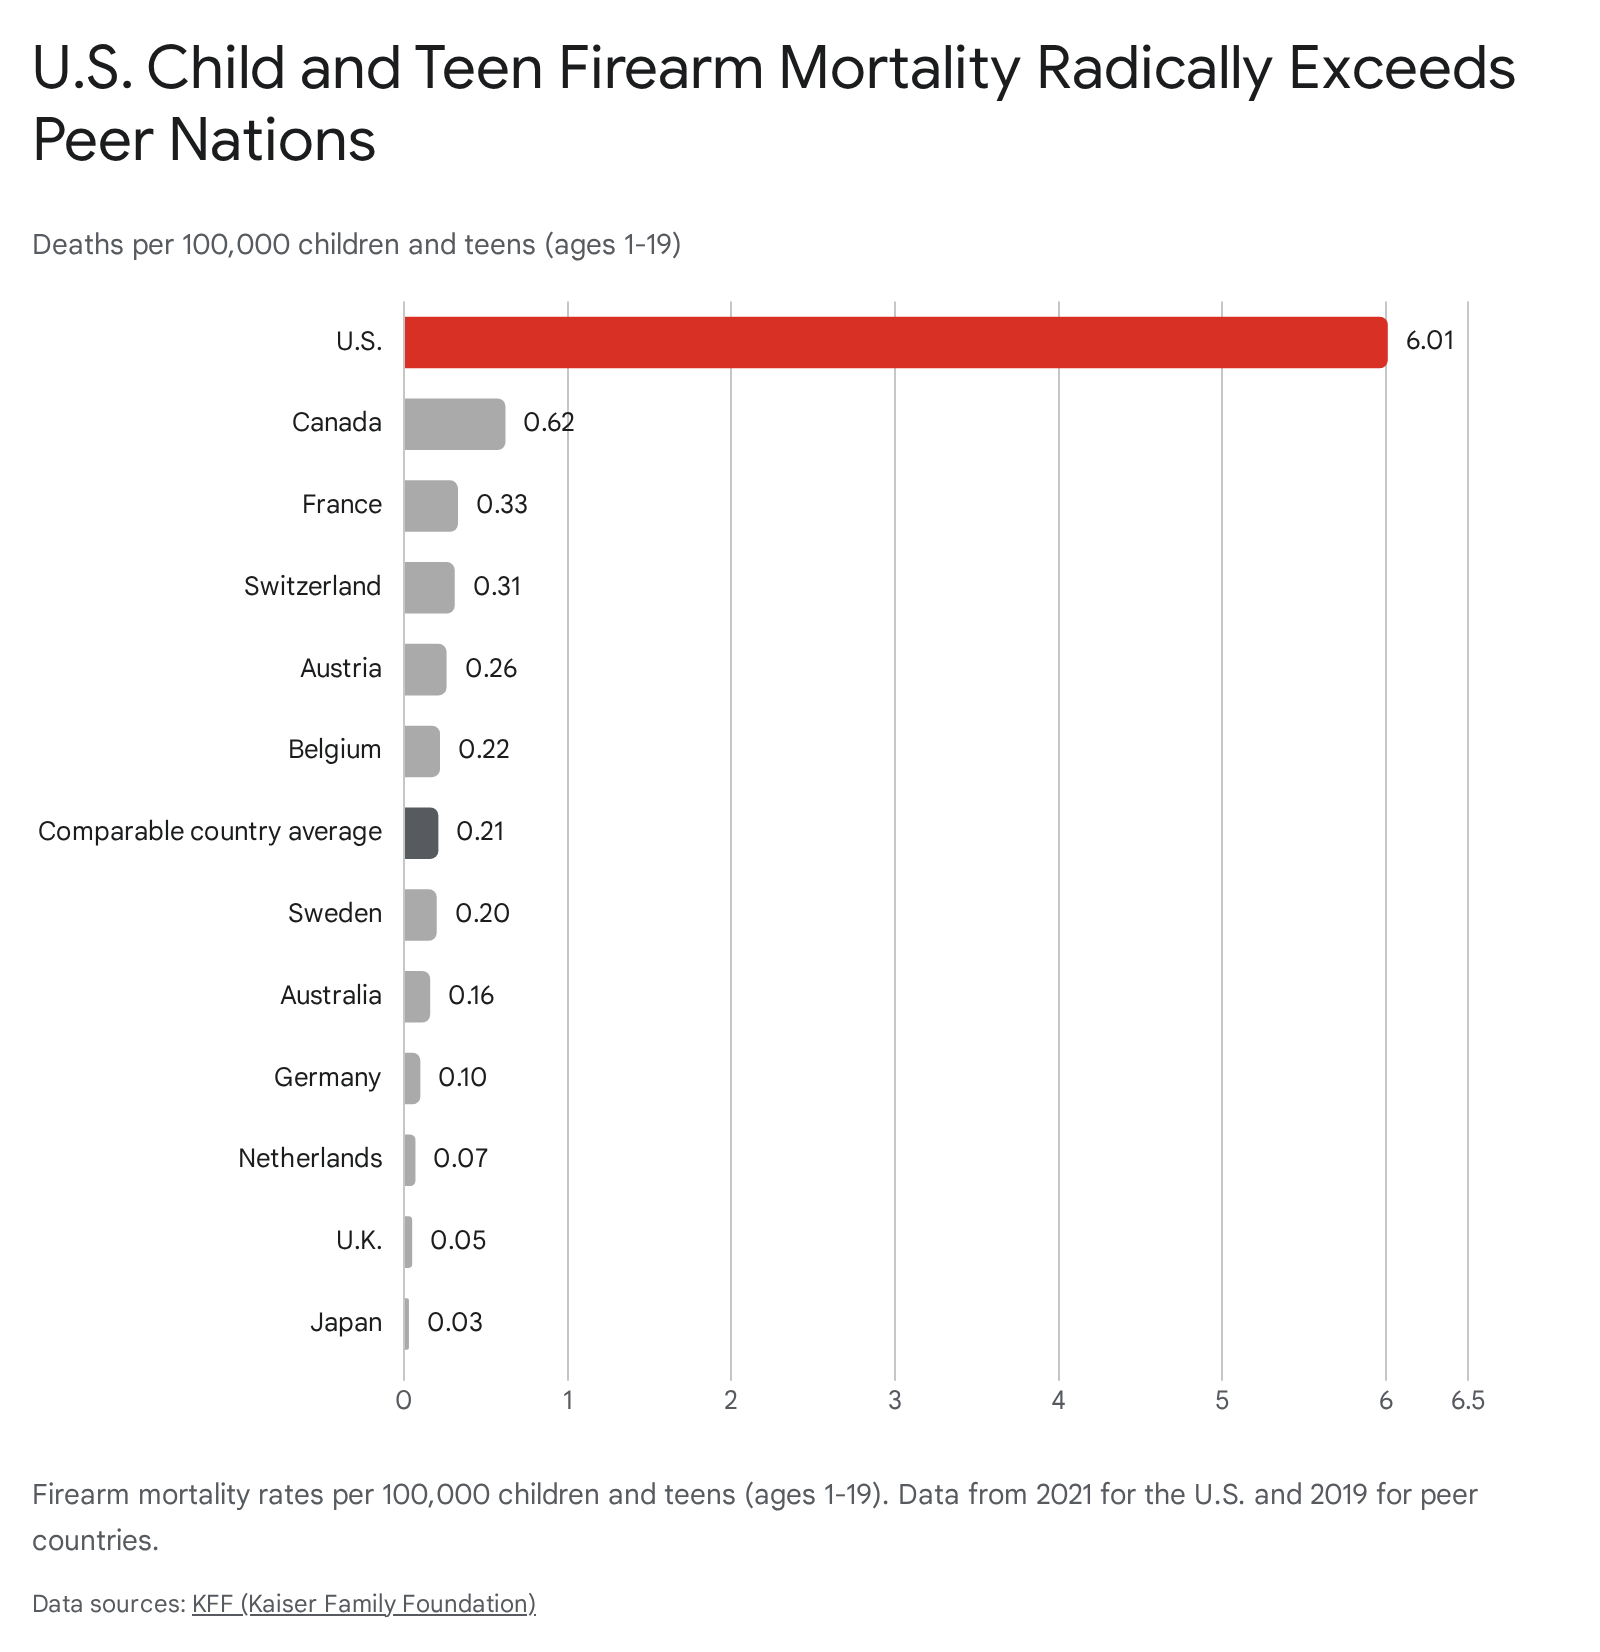
This phenomenon is entirely unique to the United States among developed nations. In no other similarly large, wealthy country are firearms ranked in the top four causes of death for youth, let alone as the leading cause 31.
When comparing age-adjusted rates, the United States child and teen firearm mortality rate of 6.01 per 100,000 is unprecedented. It is nearly 10 times higher than Canada (0.62), 37 times higher than Australia (0.16), and more than 120 times higher than the United Kingdom (0.05) 30.
Furthermore, the United States leads peer nations in every specific subcategory of youth firearm death, including pediatric suicides, where the United States rate of 1.8 firearm suicides per 100,000 youth vastly outpaces the comparable country average of 0.2 3031.
Racial Disparities in Pediatric Firearm Mortality
The burden of pediatric firearm mortality is not distributed equally across demographics within the United States. An analysis of mortality trends from 2016 to 2020 revealed stark racial disparities. The firearm mortality rate for Black youth was 12.88 per 100,000, representing a risk 4.14 times higher than that of White youth 35. Specifically regarding homicides, the rate among Black youth was 10.20 times higher than that of their White peers 35. Conversely, suicide rates were disproportionately elevated among American Indian and Alaska Native (AIAN) youth, highlighting the complex, intersectional nature of gun violence in America 35.
Prevalence and Measurement of Public Mass Shootings
While public mass shootings account for fewer than 2% of all annual gun deaths in the United States, they command unparalleled media attention and provoke intense international debate 4.
Contested Methodologies in Mass Casualty Data
Accurately comparing the prevalence of mass shootings internationally is hindered by conflicting methodological definitions. Discrepancies revolve around the minimum fatality threshold and the inclusion of specific situational contexts. For example, the United States Federal Bureau of Investigation (FBI) defines a mass shooting based on active shooter profiles in populated areas, while the Gun Violence Archive logs any incident where four or more people are shot or killed, excluding the shooter 3632.
Furthermore, international comparative studies frequently diverge based on the inclusion of gang violence, armed robberies, and organized terrorism. A controversial 2015 study by the Crime Prevention Research Center (CPRC) suggested that the United States ranked 11th globally in per capita mass shooting deaths, trailing nations like Norway, Serbia, and France 36. However, methodological reviews indicated this was a statistical artifact: calculating an average annual per capita rate over a short timeframe (2009 - 2015) in nations with very small populations allowed singular, anomalous terror events - such as the 2011 Anders Breivik attack in Norway, which killed 69 people, or the 2015 ISIL attacks in Paris - to wildly skew the data against the steady volume of 133 domestic shootings in the United States over the same period 36.
Comparative Frequencies in Developed Nations
When utilizing consistent definitions that exclude state-sponsored conflict and organized terrorist networks, the United States emerges as the undisputed epicenter of public mass shootings among developed democracies. Data collected by the Rockefeller Institute of Government, which tracks traditional public mass shootings with four or more fatalities, identified 109 incidents in the United States between 2000 and 2022 3633.
In contrast, across 35 other economically and politically comparable countries combined, there were only 35 such incidents over the same 22-year span 33. Despite comprising only 33% of the aggregated population of these 36 nations, the United States accounted for 76% of the public mass shooting incidents and 70% of the resulting fatalities 33. Other researchers assert that despite housing less than 5% of the global population, the United States experiences approximately 31% of the world's public mass shootings 33.
Firearm Prevalence and Legislative Frameworks
The profound statistical divergence in mortality outcomes between the United States and peer nations is intrinsically tied to structural differences in civilian firearm prevalence and the legislative frameworks governing their acquisition, storage, and utilization.
Global Civilian Firearm Ownership Rates
The volume of firearms in circulation within the United States is without global parallel. The Small Arms Survey estimates that there are over 393 million civilian-held firearms in the United States, yielding a rate of 120.5 firearms for every 100 residents 1234. The United States houses nearly 48% of the world's 875 million estimated civilian-controlled firearms 7.
The closest high-income peer is Canada, with an estimated 34.7 firearms per 100 residents, followed by Iceland (31.7), Austria (30.0), Norway (28.8), and Germany (19.6) 121834. While these European nations possess substantial civilian arsenals, they maintain negligible firearm homicide rates 1118. This demonstrates that absolute firearm volume is not the sole determinant of gun violence; rather, mortality outcomes are mediated by the regulatory structures dictating who has access to firearms and under what conditions.
Permissive Versus Restrictive Licensing Policies
International gun control paradigms broadly divide into two categories: permissive and restrictive. The United States operates under a uniquely permissive system. Grounded in the Second Amendment, the legal baseline assumes an individual right to bear arms. Consequently, almost any adult of a designated age is permitted to acquire a firearm unless a regulatory agency explicitly proves they belong to a prohibited class (e.g., individuals with specific felony convictions or documented mental health adjudications) 35.
Conversely, peer nations in Europe and the Commonwealth universally deploy restrictive licensing systems. Under this framework, civilian gun ownership is not a guaranteed legal right but a conditionally granted privilege. The presumption is reversed: "nobody but" specifically approved individuals may possess firearms 35. Applicants must proactively provide the licensing authority with evidence of good character and, crucially, a valid, legally recognized reason for requiring the weapon 3536.
In nearly all comparable nations - including the United Kingdom, Germany, Japan, Canada, and Australia - personal self-defense is explicitly rejected by statute as a valid reason for firearm acquisition 3537. Licenses are strictly limited to verified sporting, hunting, or professional applications.
Table 4: Comparative Firearm Regulatory Frameworks in Selected Jurisdictions
| Jurisdiction | Guiding Policy Framework | Is "Self-Defense" a Valid Reason for Licensing? | Handgun Accessibility | Mandatory National Registry | Licensing Wait Times & Checks |
|---|---|---|---|---|---|
| United States | Permissive (Constitutional Right) | Yes | Readily available | No national registry | Point-of-sale check; minimal waiting periods federally |
| Canada | Restrictive (Privilege) | No | Frozen/Heavily restricted | Restricted classes only | 28-day wait; extensive background & reference checks |
| United Kingdom | Restrictive (Privilege) | No | Banned for most civilians (post-1996) | Yes, all firearms | Extensive medical and police interviews; 5-year renewal |
| Australia | Restrictive (Privilege) | No | Highly restricted (club members only) | Yes, all firearms | 28-day wait; mandatory safety courses; 3-5 year renewal |
| Japan | Restrictive (Privilege) | No | Banned for civilians | Yes, all firearms | Stringent written/practical exams; rigorous mental health screening |
Note: Table synthesized from comparative analyses of international firearm legislation. Policies reflect baseline national frameworks; sub-national jurisdictional variations may exist 35363738.
Impact of Legislative Interventions on Mortality Trends
The implementation of restrictive legislative frameworks frequently correlates with measurable, sustained declines in firearm mortality. Following the Port Arthur massacre in 1996, the Australian government enacted the National Firearms Agreement, which banned various semi-automatic rifles, initiated a massive federally funded buyback program that removed roughly 650,000 weapons from circulation, and established strict safe-storage mandates 293940. Subsequent epidemiological evaluations demonstrated an accelerated decline in both firearm suicides and homicides, alongside an absence of mass shootings for over two decades 2940.
Similar policy interventions have yielded comparable results globally. In the United Kingdom, the banning of civilian handguns following the 1996 Dunblane tragedy cemented the nation's firearm mortality rate as one of the lowest in the developed world 1237. In Montenegro, a 2007 law restricting the carriage of firearms to private property without explicit police permission resulted in a significant decrease in firearm homicides 16. In Israel, a 2006 policy shift by the Defense Force that mandated soldiers leave their weapons on base during weekend leave yielded a 40% decline in the military suicide rate 16.
In summary, global data indicates that the divergence in firearm mortality between the United States and its OECD peers is not the result of inherent differences in baseline human criminality or mental illness. Rather, the statistical anomaly of the United States - manifesting in elevated rates of suicide, homicide, and public mass shootings - is the direct epidemiological outcome of unparalleled civilian firearm prevalence operating within a highly permissive, decentralized regulatory environment.