Fastest organic audience growth channels in 2026
The Macro-Environment for Audience Discovery
The mechanics of audience acquisition have undergone a structural transformation by 2026. The global digital landscape now encompasses 5.24 billion social media users, representing a 64.8% penetration rate across the global population, with growth increasingly driven by older demographics and emerging markets rather than Generation Z 12. Internet users spend an average of 6 hours and 39 minutes online daily, dedicating approximately 2 hours and 21 minutes specifically to social platforms 2. Despite this massive user base, organic growth strategies from previous eras have largely decayed.
The primary driver of this decay is the transition from social-graph distribution to interest-graph distribution. Historically, platforms distributed content based on follower networks. In 2026, algorithmic distribution heavily prioritizes content relevance, watch-time completion, and early engagement velocity over historical follower counts 1. Consequently, existing accounts with large but passive followings face declining organic reach, while new accounts starting from zero possess unprecedented opportunities to trigger viral distribution if their content signals high relevance to niche communities 34.
Simultaneously, the integration of generative artificial intelligence into search and discovery behaviors has fundamentally altered top-of-funnel acquisition. Audiences increasingly rely on AI-assisted search engines and chatbots for product discovery and educational content, circumventing traditional search engine results pages. However, user sensitivity to automation has matured; content overtly identified as AI-generated experiences an average engagement penalty of 12% 1. Therefore, successful audience acquisition in 2026 relies on a hybrid approach: leveraging high-variance algorithmic platforms for initial discovery, optimizing for AI-driven search environments, and rapidly transitioning acquired attention into owned media channels.
Cross-Platform Engagement and Distribution
Evaluating the efficacy of various channels requires distinguishing between passive consumption and active engagement. Standard engagement rates - calculated as total interactions divided by either follower count or total impressions - serve as the primary benchmark for audience resonance. Across the industry, interaction metrics like comments have seen widespread declines, dropping by 16% on Instagram and 24% on TikTok year-over-year, indicating a broader behavioral shift toward passive scrolling 45. To compensate, algorithms now assign higher weight to high-intent actions, specifically saves, shares, and video completion rates 36.
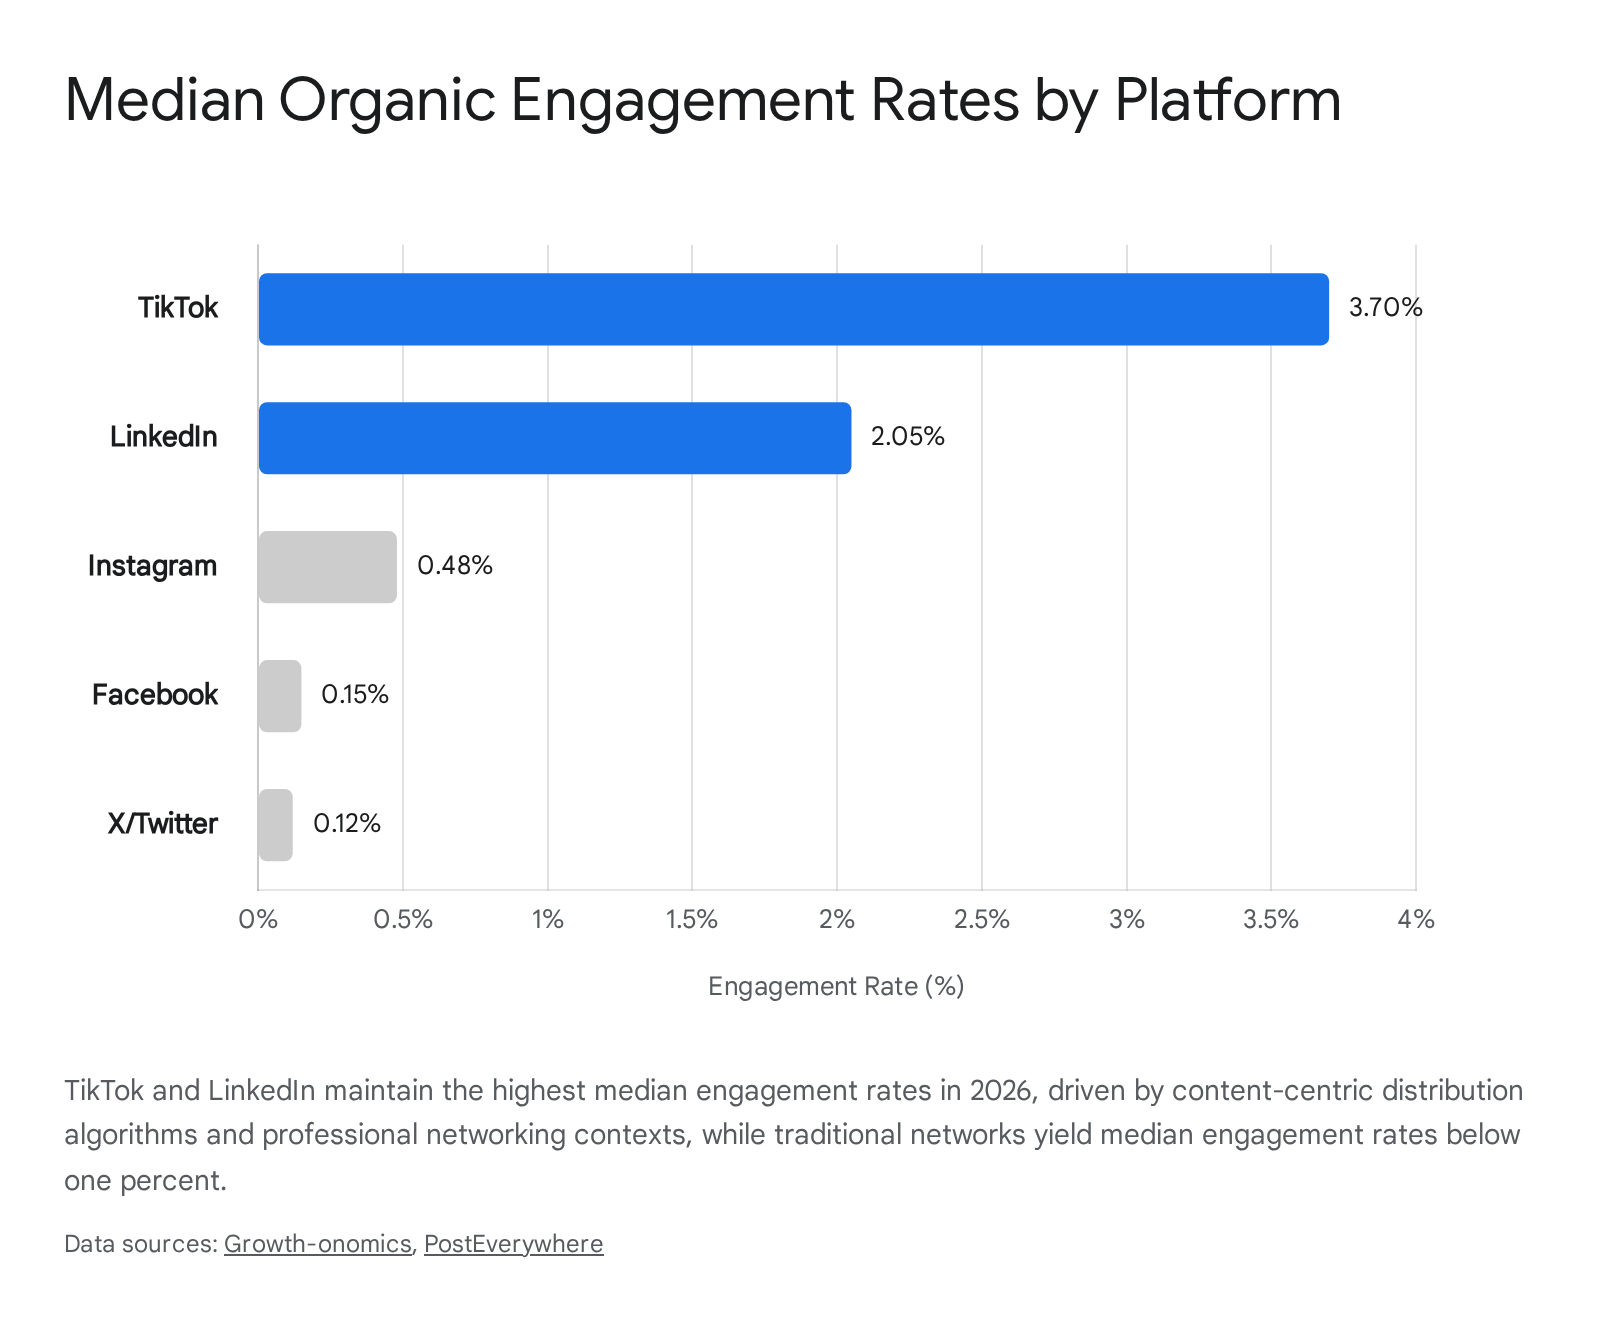
The distribution of engagement across platforms illustrates a stark divide between professional networks, short-form video ecosystems, and legacy social networks.
| Social Media Platform | Median Engagement Rate | Primary Engagement Driver | Annual Trend |
|---|---|---|---|
| TikTok | 3.70% - 4.90% | Shares and video watch-time completion | +49% YoY 678 |
| 2.05% - 5.20% | Comments, carousel swipes, professional networking | +44% YoY 789 | |
| YouTube (Shorts) | 3.00% - 5.91% | Views, likes, and subscription conversions | Stable 6 |
| 0.48% - 0.98% | Saves, Reels watch-time, Direct Messages | -4% YoY 678 | |
| X (Twitter) | 0.03% - 0.12% | Replies, reposts, and bookmarking | Slight Recovery 67 |
| 0.06% - 0.15% | Group interactions, specific industry albums | Gradual Decline 46 |
The Inverse Relationship Between Audience Size and Growth
A fundamental principle governing organic growth in 2026 is the inverse correlation between existing follower count and audience growth velocity. Smaller accounts routinely achieve higher engagement and faster proportional growth than established macro-influencers or enterprise brands. This dynamic is rooted in algorithmic filtration models that test content with highly targeted micro-cohorts before expanding reach 3.
On TikTok, accounts possessing between 1,000 and 5,000 followers expand at an average rate of 269%, which is over eight times faster than the 33% growth rate observed for accounts exceeding 100,000 followers 10. Similarly, on Instagram, nano-influencers (fewer than 10,000 followers) maintain engagement rates above 5%, while macro-influencers (100,000 to 1 million followers) typically see engagement suppressed below 3% 11.
| Influencer Tier | Follower Count | Median Instagram Engagement | Median TikTok Engagement |
|---|---|---|---|
| Nano | 1,000 - 10,000 | > 5.00% 11 | 9.38% - 18.00% 1012 |
| Micro | 10,000 - 100,000 | 3.50% - 8.50% 13 | 8.21% - 12.00% 1012 |
| Mid-Tier | 100,000 - 500,000 | 1.50% - 4.00% 13 | 6.43% 12 |
| Macro | 500,000 - 1,000,000 | 0.80% - 2.50% 13 | 4.87% - 8.00% 1012 |
| Mega / Celebrity | > 1,000,000 | ~ 1.21% 11 | 2.14% - 4.00% 1012 |
For creators building an audience from zero, these benchmarks emphasize that early-stage growth depends entirely on community density rather than broad appeal. High engagement rates signal to the algorithm that the content delivers localized value, which subsequently triggers wider distribution.
High-Velocity Acquisition: Short-Form Video Channels
Short-form video dominates the attention economy, accounting for over 58% of global time spent on social media 1. The format provides the fastest mechanism for organic top-of-funnel discovery, bypassing the need for an existing follower base.
TikTok Discoverability and Content Optimization
With 2.04 billion global monthly active users and users averaging 1 hour and 37 minutes on the platform daily, TikTok remains the primary engine for rapid audience acquisition 1215. The platform's distribution model operates independently of the social graph; the "For You Page" delivers content to users based purely on demonstrated content affinities, resulting in 68% of all video impressions originating from non-followers 12.
For an account starting from zero, evaluating performance requires contextualized benchmarks. A common metric is the reach rate, calculated by dividing average video views by total follower count. Accounts with fewer than 5,000 followers average a 43% reach rate, meaning a creator with 2,000 followers can reliably expect around 860 views per video 16. Achieving over 100% reach rate (e.g., a 1,000-follower account generating 1,500 views) signals strong algorithmic resonance. Reaching 10,000 followers via TikTok typically requires one to four months of consistent output 14.
Retention is the determining factor for viral distribution. The algorithm heavily favors videos under 30 seconds, which currently maintain a 72% watch-through completion rate 112. Furthermore, the average visual hook must capture viewer attention within 3.7 seconds to prevent a scroll 12. Posting frequency directly impacts growth velocity. While posting one to three times daily maximizes algorithmic data collection, a more sustainable cadence of one to four highly strategic posts per week can yield superior engagement if the content consistently drives shares and bookmarks 710.
YouTube Shorts and the Long-Form Ecosystem
YouTube's ecosystem in 2026 demands a bifurcated approach. The platform commands 2.7 billion monthly active users and provides unparalleled monetization potential, but building a dedicated audience from zero solely through traditional long-form video is a protracted process 2. Data indicates that the average new channel requires 20 to 30 highly optimized long-form videos and approximately six to twelve months of consistent publishing to cross the 1,000-subscriber threshold required for basic monetization 15.
To accelerate this timeline, creators utilize YouTube Shorts as an acquisition layer. Shorts benefit from an aggressive discovery algorithm, allowing new creators to reach the 10,000-subscriber mark in two to six months 14. The primary challenge lies in cross-pollination; while Shorts generate rapid visibility, they yield substantially lower ad revenue and audience loyalty compared to long-form content. The most effective strategy involves using short-form vertical video to capture top-of-funnel attention, then directing those viewers toward narrative-driven, long-form content that cultivates trust and drives monetization 1419.
Instagram Reels and Platform Maturity
Instagram's user base matches YouTube at 2.7 billion globally, representing an annual growth stabilization of roughly 4% 11. However, Instagram is a mature platform where general organic reach is heavily saturated. The median engagement rate for standard images and feed posts has compressed to 0.48% 4.
Audience building on Instagram relies entirely on Reels, which generate 36% more reach than standard carousel posts and maintain an average watch-through rate of 61% 17. Creators who post Reels grow their follower bases approximately 47% faster than those relying solely on static content 11. A competitive strategy for 2026 involves dedicating 60% to 70% of total output to Reels for algorithmic discovery, while using the remaining 30% for static carousels designed to build loyalty and encourage content saves among existing followers 7.
Growth on Instagram is hindered by elevated follower loss rates. The platform routinely purges inactive accounts and bots, which constitute approximately 14.1% of all followers 11. Furthermore, creators experience high churn (up to 43% of follower loss) if their content becomes overly promotional, highlighting the necessity of balancing value-driven content with commercial messaging 11.
High-Intent Acquisition: Professional Networks
For B2B audience building, consulting, and service-based industries, LinkedIn possesses an unmatched structural advantage. Despite hosting over 1.2 billion members and 310 million monthly active users, only 3% of the user base posts content more than once per week 2021. This profound imbalance between content consumption and content creation allows new voices to capture disproportionate market share.
LinkedIn Algorithm and Formatting Optimization
LinkedIn's algorithm prioritizes professional value, deep reading, and community discussion. Consequently, engagement rates on LinkedIn routinely outperform traditional social networks, averaging 5.20% by impressions 9.
Format selection dictates performance. The algorithm currently rewards "dwell time" - the amount of time a user spends interacting with a single post. Native document posts (PDF carousels) maximize dwell time by requiring users to click through multiple slides, resulting in an industry-leading 7.00% engagement rate 9. Video content natively hosted on the platform achieves 6.00% engagement, while posts containing external links see click-through rates systematically suppressed by the algorithm 916.
| Content Format | Average Engagement Rate | Strategic Advantage |
|---|---|---|
| Native Document (PDF) | 7.00% | Generates maximum dwell time and high click-through rates 9 |
| Multi-Image Post | 6.45% - 6.60% | Achieves 278% higher engagement than standard video 921 |
| Native Video | 6.00% | High retention, strongly preferred over external links 9 |
| Text & Single Image | 5.30% | Relies on compelling opening hooks; drives strong comment volume 9 |
The Mechanics of LinkedIn Growth
Because LinkedIn leverages professional networks, reach behaves differently than on consumer platforms. A typical post from an account with fewer than 1,000 followers will reach an audience equivalent to 31% of its network 23. Conversely, massive enterprise accounts reaching over 100,000 followers see their relative reach plummet to just 6% 23.
Posting frequency drives compounding returns on LinkedIn. Analysis of over two million posts reveals that transitioning from one post per week to a cadence of two to five posts per week generates an average increase of 1,182 impressions per post, while accelerating to six to ten posts per week yields an additional 5,000 impressions per post 24. Furthermore, high-quality comments on other industry professionals' posts frequently generate more inbound profile views and connections than standalone organic posts, making outbound engagement a mandatory growth tactic 13.
Owned Audience Architecture: Email Newsletters
Social media and video platforms dictate discovery, but algorithm volatility introduces critical business risk. To mitigate this, creators and brands must funnel acquired attention into owned media channels, specifically email newsletters. In 2026, the global email infrastructure supports 4.73 billion users and processes over 392.5 billion emails daily 2526.
The email newsletter economy expanded by 96.2% between 2023 and 2024, driven by platforms like Substack and Beehiiv offering integrated monetization tools 17. The appeal of newsletters lies in their return on investment; email marketing generates an average ROI of $36 to $44 for every dollar spent, heavily outperforming all paid social channels 2518.
Benchmarking Newsletter Performance
Building a newsletter from zero requires understanding standard engagement metrics, which have been complicated by recent technological shifts. Historically, open rates served as the primary indicator of list health. In 2025, platform averages reported open rates exceeding 41% to 43.46% 2619. However, these figures are fundamentally inflated by Apple's Mail Privacy Protection (MPP).
MPP automatically pre-loads tracking pixels on Apple proxy servers before a user actually views an email, registering a "fake open." With Apple controlling nearly 50% of the email client market, reported open rates are routinely inflated by 10 to 20 percentage points 25. Consequently, a jump in median open rates from historical norms of 21.5% to modern figures of 49.3% reflects technological interference rather than increased human engagement 20.
Marketers building an audience from zero must therefore rely on deeper metrics: * Click-Through Rate (CTR): The average CTR ranges from 2.0% to 3.2%, representing true, trackable human engagement 26. * Unsubscribe Rate: A healthy list maintains an unsubscribe rate below 0.25%, with the median sitting near 0.17% to 0.22% 2617. * Bounce Rate: Invalid or blocked emails should remain below 2.0% to protect sender reputation and deliverability 26.
Audience Scaling and the 0-to-1,000 Journey
The acquisition timeline for newsletters involves distinct phases. The initial phase (0 to 100 subscribers) relies heavily on direct network outreach and foundational content creation. The second phase (100 to 1,000 subscribers) demands cross-platform funneling - utilizing high-velocity networks like TikTok or LinkedIn to drive traffic toward high-value lead magnets, such as free templates or industry reports 21.
Reaching financial viability requires patience. For newsletters launched in 2025, the median time elapsed from the first publication to generating the first dollar of revenue was 66 days 1720. Once a critical mass is achieved, typical conversion rates from a free subscriber base to a paid subscription tier average between 5% and 10% 18.
The Compounding Effect of Referral Programs
Surpassing the 1,000-subscriber mark unlocks the most potent organic growth mechanism available to newsletters: automated referral programs. By incentivizing existing readers to share the publication in exchange for digital or physical rewards, creators convert their audience into an acquisition channel.
Data from SparkLoop, a major newsletter referral platform, indicates that implementing a basic referral program boosts subscriber growth by an average of 15% to 35% 222324. More aggressive programs utilizing paid rewards or regular giveaways can escalate growth rates by 50% to 200% 23.
The economic and qualitative benefits of referral-driven audience growth are unmatched: * Acquisition Cost: The average cost per subscriber acquired via referral is $0.17, compared to $1.00 to $5.00 for subscribers acquired via social media advertisements 18. * Audience Quality: Referred customers generate a 16% higher lifetime value (LTV) and exhibit a 37% higher long-term retention rate 25. * Conversion Metrics: Because referred audiences enter the ecosystem with pre-established trust (social proof), their conversion rates to paid tiers are three to five times higher than audiences acquired through cold traffic 25.
Successful referral architecture relies on low-friction milestones. Programs that demand excessive referrals (e.g., 10 or 25 recommendations) for the first reward fail to generate momentum. Offering high-value digital goods - such as exclusive PDFs, templates, or early access - for just one to three successful referrals creates immediate, compounding viral loops 2226.
Search and Generative Engine Optimization (GEO)
While social platforms drive immediate attention, sustainable, long-term audience building relies heavily on search intent. Traditional search engine optimization (SEO) remains a powerhouse; organic search delivers a 702% to 748% ROI for B2B SaaS companies, with an average break-even time of just seven months 3738.
However, the proliferation of AI chatbots has forced a paradigm shift from traditional SEO to Generative Engine Optimization (GEO). By early 2026, AI Overviews appeared on 48% of all Google queries, and platforms like ChatGPT processed over 2.5 billion prompts daily 27. This AI intermediation has reduced overall top-of-funnel traffic volume to traditional websites but drastically increased the quality and intent of the traffic that does arrive.
Website visitors arriving via AI search referrals (such as ChatGPT or Perplexity) demonstrate a conversion rate of 3.49%, representing a 22% increase over traditional organic search conversion rates (2.86%) 28. Because AI engines aggregate and filter information prior to providing a citation link, users who click through to a creator's site possess exceptionally high intent. Optimizing for GEO requires publishing highly structured, authoritative content that includes original research and primary data, as Large Language Models heavily favor citable statistics when generating answers 2741.
Regional Ecosystems: Asia-Pacific Dominance
Audience building strategies are highly geographic. Western tactics relying on Instagram, TikTok, and standalone newsletters do not seamlessly translate to the Asia-Pacific (APAC) region, which generated 71.6% of global social commerce revenue in 2026 42.
Southeast Asia and Social Commerce
In Southeast Asia - where the e-commerce market reached a projected gross merchandise value of $234 billion in 2026 - social commerce is the primary driver of audience monetization 43. Rather than browsing traditional e-commerce storefronts, 82% of consumers in the region discover and purchase new products directly through social media applications 29. Mobile dominance is absolute; 78% of all e-commerce transactions occur on mobile devices, and 68% of regional online shoppers have never made a purchase via a desktop computer 43.
For creators building an audience in Southeast Asia, the goal is rapid integration into live commerce. Conversion rates during live shopping streams on platforms like Shopee Live and TikTok Live routinely hit 4.3% to 7.2%, and can peak near 30% in highly optimized scenarios 42. This dwarfs the 1% to 2% conversion rate typical of traditional static e-commerce. Furthermore, the region overwhelmingly favors micro-influencers (2,000 to 10,000 followers). These localized creators generate engagement rates up to four times higher than mega-influencers, as their audiences value community trust and peer recommendations over celebrity status 4229.
South Korea's Super-App Ecosystem
South Korea presents a unique, hyper-concentrated digital environment. With roughly 95% internet penetration, the nation operates on a mobile-first framework dominated almost entirely by indigenous platforms, specifically KakaoTalk 45.
By 2026, KakaoTalk maintained 49.1 million monthly active users, achieving a staggering 95.1% penetration rate across the total South Korean population 30. The application functions as a multifaceted super-app, integrating messaging, social networking, push notifications, and e-commerce (Kakao Pay and Gift Delivery) 4531.
Building an audience in South Korea requires establishing a robust presence on Kakao Channels and utilizing Kakao's Biz Board advertising and community features 45. Following a recent platform redesign that introduced an Instagram-style visual feed, user engagement and integrated advertising revenue surged, further centralizing the nation's digital attention 31. While global platforms like YouTube maintain significant reach - approximately 42.9 million ad-reachable users - and TikTok continues to capture the Generation Z demographic, foundational audience acquisition in South Korea necessitates deep integration into the Kakao ecosystem 4530.
Conclusion
Building an audience from zero in 2026 demands a highly synchronized, multi-channel strategy that leverages algorithmic discovery while aggressively mitigating platform risk. Creators and brands must abandon the pursuit of vanity metrics and passive followers, focusing instead on optimizing content for deep engagement, watch-time completion, and high-intent shares.
The optimal acquisition blueprint begins with short-form video on TikTok or high-dwell-time document carousels on LinkedIn, exploiting these platforms' algorithmic willingness to distribute relevant content to non-followers. However, due to the volatility of interest-graph distribution and the rise of AI-mediated search, relying solely on social platforms is a structural vulnerability. Acquired attention must be rapidly transitioned into owned media architectures, primarily email newsletters, where compounding referral loops and high-conversion environments secure long-term audience value and monetization. Ultimately, success relies on matching content formats to algorithmic preferences while maintaining the narrative authenticity required to convert fleeting viral attention into dedicated, recurring readership.