Biological age estimation using epigenetic clocks
The Biological Age Paradigm
The distinction between chronological age and biological age serves as a foundational concept in contemporary geroscience. Chronological age measures the absolute time elapsed since an organism's birth, but it frequently fails to reflect the physiological and functional decline of cells, tissues, and organ systems. Because the rate of biological aging is heavily influenced by a complex interplay of genetic inheritance, environmental exposures, lifestyle factors, and metabolic stress, individuals of the exact same chronological age can exhibit vastly different biological ages. As a result, chronological age is often an inadequate predictor of age-related disease onset, cognitive decline, frailty, and overall mortality risk 1223.
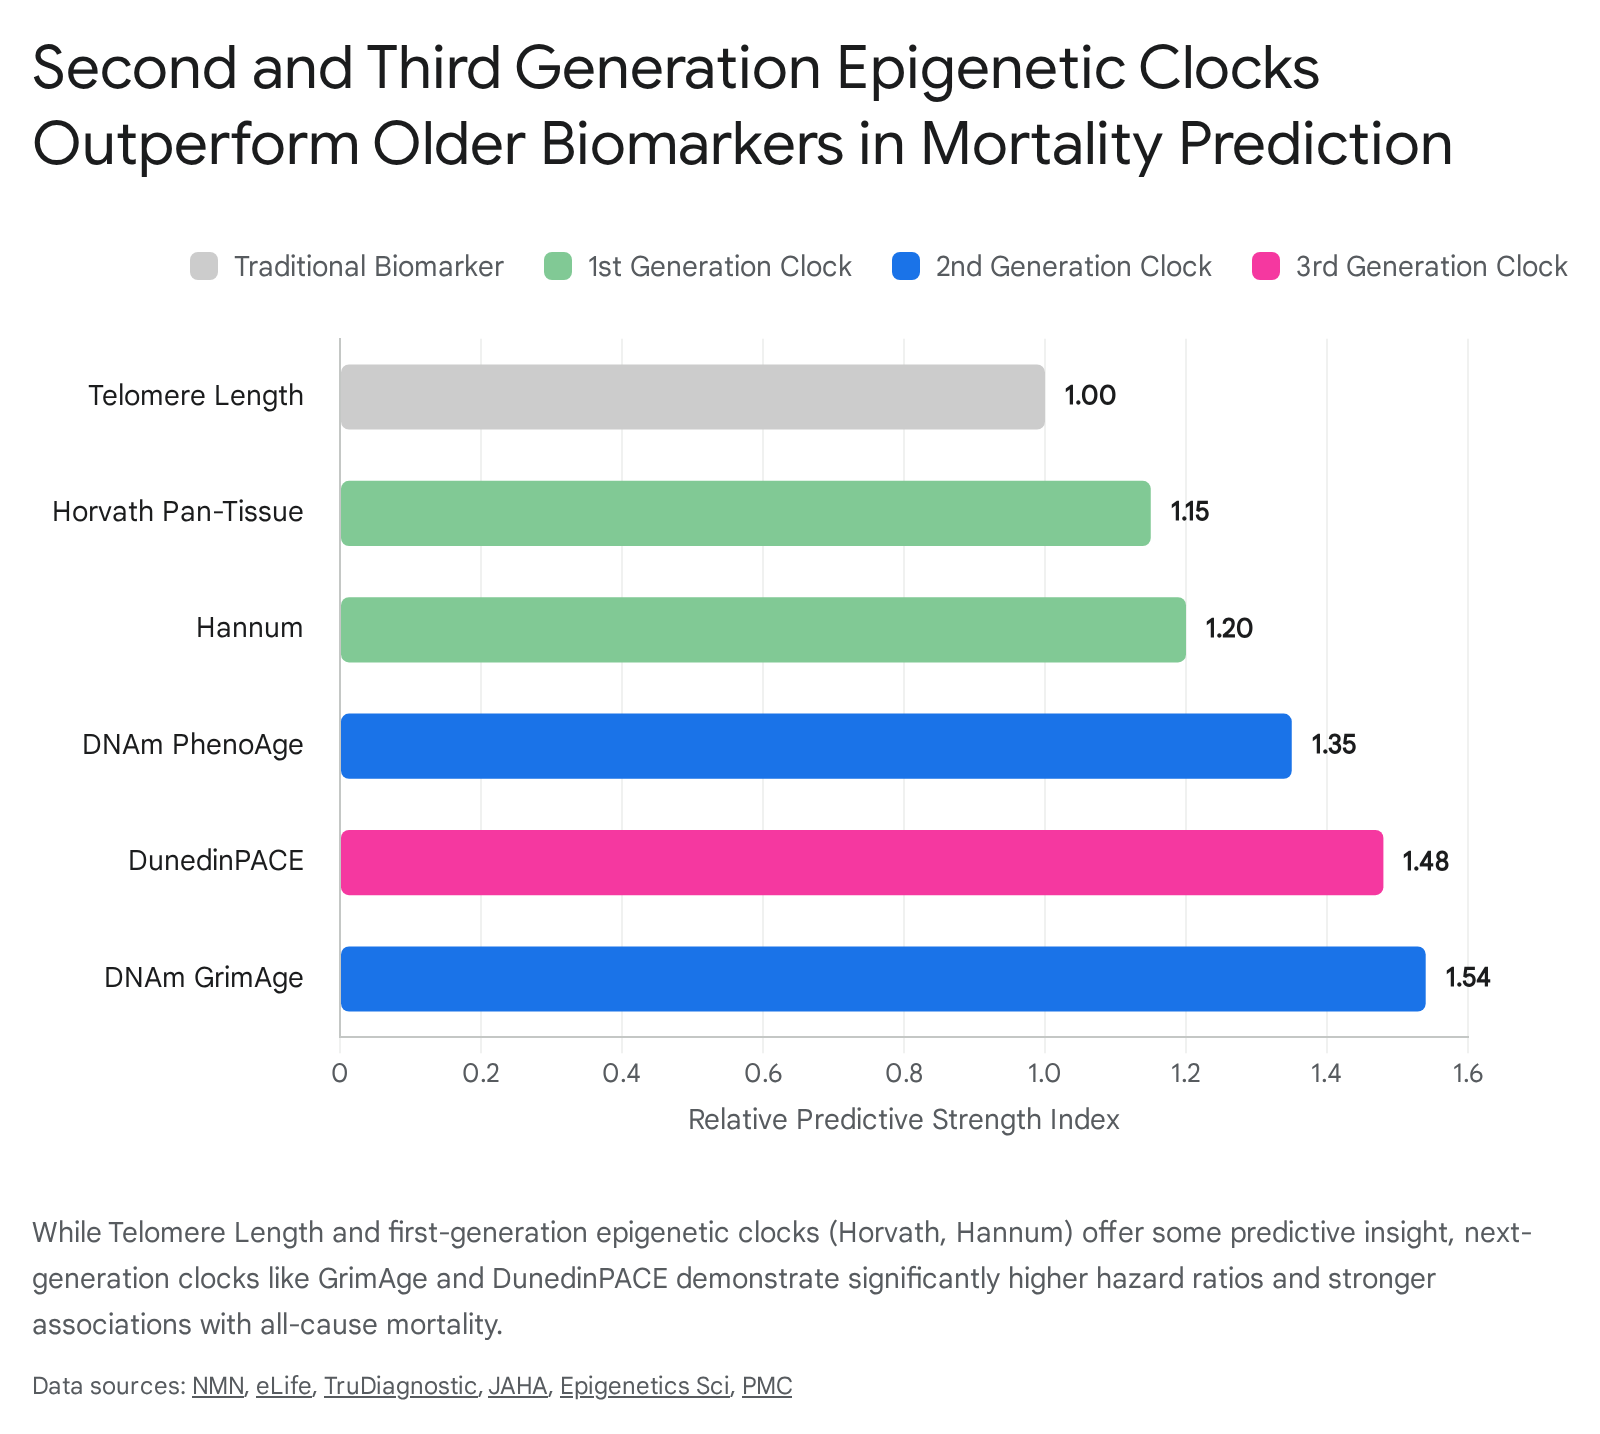
To address this diagnostic limitation, researchers have developed various molecular and phenotypic biomarkers designed to quantify the true rate of biological aging. Historical approaches focused on physical functioning tests, such as the Timed Up and Go (TUG) test or grip strength, alongside cellular markers like telomere length attrition, transcriptomic alterations, proteomic profiles, and metabolomic shifts 3456. Telomere length, the shortening of protective DNA caps at the ends of chromosomes, was long considered the premier molecular aging biomarker 7. However, comprehensive meta-analyses and longitudinal studies demonstrate that epigenetic clocks - computational models based on DNA methylation patterns - substantially outperform telomere attrition and other single-omic biomarkers in mortality prediction and biological age estimation 7. By mapping specific chemical modifications across the genome, epigenetic clocks provide a highly stable molecular signature that tracks both the cumulative deterioration of the human body and its localized adaptive responses 28.
Molecular Mechanisms of DNA Methylation
DNA methylation is a primary epigenetic control mechanism that modulates gene expression without altering the underlying genetic nucleotide sequence. The process involves the covalent addition of a methyl group to the carbon-5 position of a cytosine pyrimidine ring 91011. In mammalian genomes, this modification occurs almost exclusively at cytosine-guanine dinucleotides, commonly referred to as CpG sites 91011.
DNA Methyltransferases and Gene Silencing
The establishment and subsequent maintenance of DNA methylation patterns are governed by a highly conserved family of enzymes known as DNA methyltransferases (DNMTs). During early embryonic development and cell lineage specification, de novo methyltransferases - specifically DNMT3A and DNMT3B - establish the initial genomic methylation landscape 111213. Following this developmental period, DNMT1 is primarily responsible for maintaining these patterns across successive cycles of cellular division and DNA replication, operating alongside necessary co-factors such as the E3 ubiquitin ligase UHRF1 1113.
The regulatory impact of DNA methylation depends heavily on its genomic location. Between 60% and 90% of all mammalian CpG sites are methylated in differentiated cells 911. However, specific regions termed CpG islands - short, dense clusters of CpG sites frequently located within or near gene promoter regions - are generally unmethylated in healthy, transcriptionally active cells 911. When methylation occurs at these promoter-associated CpG islands, it typically leads to robust gene silencing. This transcriptional repression is achieved through direct steric hindrance, which physically obstructs the binding of transcription factors and RNA polymerase to the DNA sequence 111213. Alternatively, methylated CpGs recruit methyl-CpG binding domain (MBD) proteins, which in turn attract histone deacetylases and chromatin remodeling complexes. This cascade induces a tightly compacted, transcriptionally repressive heterochromatin state, preventing gene expression 111214.
Age-Associated Epigenetic Drift and Stochasticity
As an organism progresses through its lifespan, the fidelity of the DNA methylation maintenance machinery gradually declines. This phenomenon, referred to as epigenetic drift, is characterized by a global loss of DNA methylation (hypomethylation) in intergenic regions and repetitive transposable elements, alongside a targeted gain of methylation (hypermethylation) in specific promoter-associated CpG islands 111516. The global hypomethylation observed with advancing age contributes significantly to widespread genomic instability, whereas localized hypermethylation frequently silences critical tumor-suppressor genes and essential developmental pathways 1114.
Simultaneously, the epigenome experiences an increase in stochastic variation or entropy. While young individuals tend to share tightly regulated, consistent methylation fractions at specific CpG sites, older individuals exhibit significant inter-individual variation, demonstrating a divergence from the baseline developmental average 171820. This accumulating stochasticity indicates that biological aging involves not only highly coordinated, programmatic epigenetic shifts but also a substantial random component resulting from cumulative molecular errors and environmental interactions 211920.
Lifespan Epigenetic Trajectories
Early epigenetic clock algorithms often operated on the assumption that biological aging progresses at a relatively constant, linear rate throughout adulthood 2122. However, extensive molecular profiling across the human lifespan indicates that the accumulation of epigenetic alterations follows distinct, highly non-linear trajectories characterized by periods of relative stability punctuated by rapid biomolecular shifts 2223.
Childhood and Early Development Shifts
The most profound and rapid shifts in the human DNA methylome occur during early development. Methylation levels increase rapidly from birth through childhood and adolescence, particularly in genomic regions functionally enriched for immune-developmental pathways 16182324. Some of the largest magnitudes of methylation change, specifically at age-associated CpGs (aaCpGs), take place between birth and one year of age 162223. Following puberty and the conclusion of major developmental milestones, global DNA methylation levels temporarily stabilize as individuals enter early adulthood, representing the establishment of the mature somatic epigenome 162223.
Mid-Life and Late-Life Transitions
Contrary to the assumption of steady decline in adult aging, extensive multi-omic and methylation analyses demonstrate that human aging accelerates during specific mid-life and late-life transitions. By tracking over 135,000 distinct molecules, including RNA, proteins, metabolites, and microbiomic data longitudinally in human subjects ranging from age 25 to 75, researchers identified two distinct periods of rapid biomolecular transformation. These bursts occur, on average, at chronological ages 44 and 60 2526.
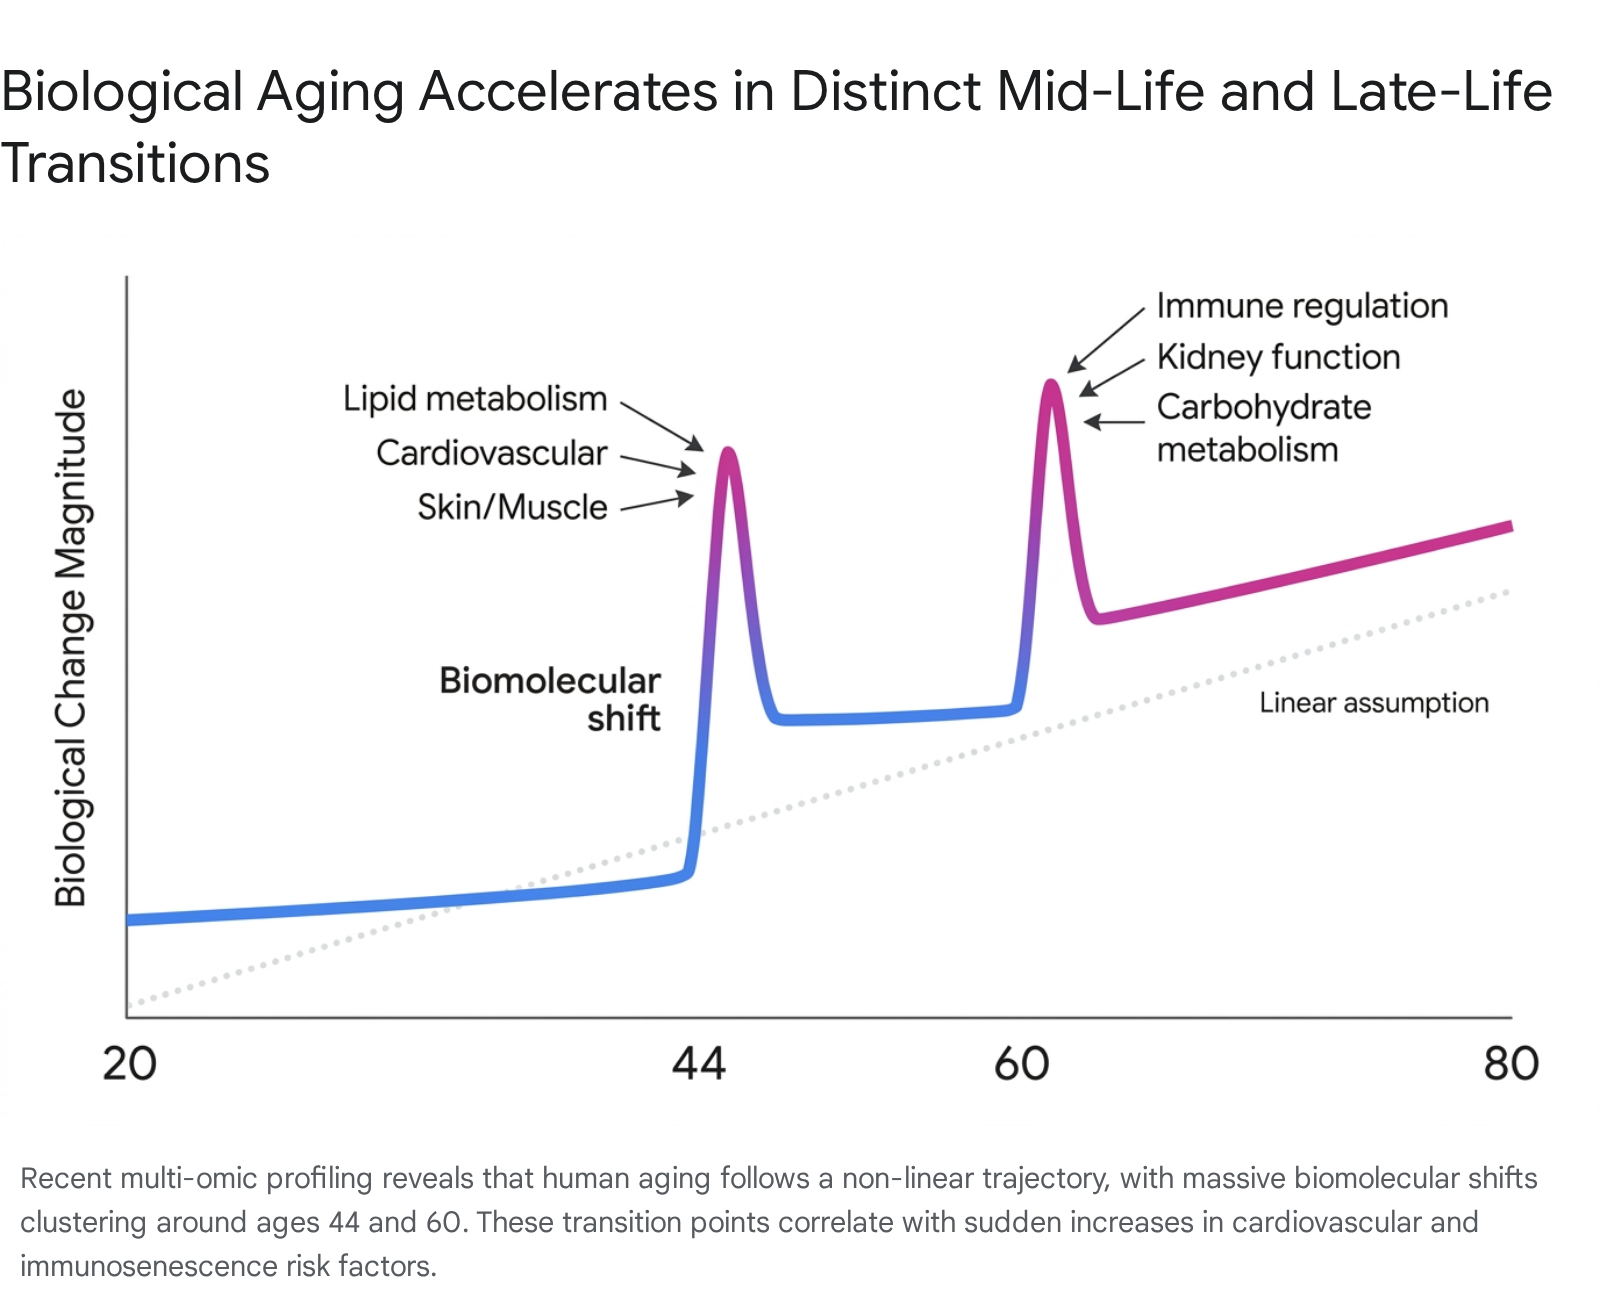
During the mid-40s transition, the methylome and overall molecular profile show pronounced shifts in biological pathways related to lipid metabolism, alcohol and caffeine metabolism, cardiovascular function, and the structural integrity of skin and muscle tissues 2627. In the early 60s transition, analogous acceleration occurs across carbohydrate metabolism, immune system regulation, and kidney function 2628. These molecular shifts closely track with the epidemiological spikes in age-related disease prevalence - such as cardiovascular disease and immune senescence - observed as populations enter their seventh decade of life 2628. Furthermore, independent clustering analyses of epigenetic clock CpGs highlight distinct non-linear shifts occurring around age 65, underscoring the complexity of late-life epigenetic remodeling 22.
First Generation Epigenetic Clocks
The evolution of epigenetic aging biomarkers has progressed through multiple distinct phases. These generations are classified by the specific phenotypes, biological targets, or health outcomes the underlying machine learning models were trained to predict.
First-generation epigenetic clocks were designed explicitly to predict chronological age based on cross-sectional DNA methylation data 293035. Utilizing penalized regression models, such as elastic net regression, researchers selected specific subsets of age-correlated CpG sites that could calculate the precise calendar age of an individual 3132. The accuracy of age prediction for these models is assessed through Pearson correlation analysis comparing the estimated epigenetic age against actual chronological age 33.
| Clock Model | Number of CpGs | Tissue Type | Primary Training Objective |
|---|---|---|---|
| Horvath Pan-Tissue | 353 | Multi-tissue (51 types) | Chronological Age |
| Hannum Clock | 71 | Whole Blood | Chronological Age |
| Zhang Clock | 10 | Blood and Saliva | Chronological Age |
| PedBE Clock | 94 | Buccal Epithelial | Chronological Age (Pediatric) |
The foundational breakthrough in this category was the Horvath Pan-Tissue Clock, developed in 2013 3440. Trained on 8,000 samples arising from 82 methylation array datasets, this clock evaluates 353 specific CpG sites across 51 different healthy tissues and cell types 3234. Of these sites, 193 are positively correlated with age, while 160 are negatively correlated 31. The Horvath clock achieves a remarkable Pearson correlation coefficient of r = 0.96 with chronological age 634.
Simultaneously, the Hannum Clock was developed using whole-blood samples from 656 adults 3132. The Hannum model relies on 71 highly predictive CpG sites 31. While exceptionally accurate for adult blood samples, the Hannum clock exhibits significant estimation biases when applied to non-blood tissues or pediatric cohorts, lacking the pan-tissue flexibility of the Horvath algorithm 3135.
Despite their precision in estimating chronological age, first-generation clocks possess inherent limitations for clinical research. Because their objective function was explicitly optimized to match calendar age, the underlying statistical models actively filter out the biological variance that signifies accelerated or decelerated aging 293531. Consequently, Horvath and Hannum clocks show relatively weak associations with clinical markers of physiological decline, morbidity, and mortality risk 353136.
Second Generation Epigenetic Clocks
To enhance the clinical and epidemiological utility of biological age estimation, second-generation epigenetic clocks were trained on composite health biomarkers, disease incidence rates, and mortality data rather than calendar age 102937. By incorporating health-related phenotypes, these algorithms successfully capture the specific molecular footprint of pathological decline and disease vulnerability 35.
DNAm PhenoAge
Developed utilizing data from the third U.S. National Health and Nutrition Examination Survey (NHANES III), the DNAm PhenoAge clock integrates chronological age with nine specific clinical laboratory markers 4303138. These markers include albumin, creatinine, glucose, C-reactive protein, lymphocyte percentage, mean cell volume, red cell distribution width, alkaline phosphatase, and white blood cell count 431. The elastic net regression model identified 513 CpG sites that correlate tightly with this combined phenotypic state 41031. DNAm PhenoAge significantly outperforms first-generation clocks in predicting 10-year and 20-year mortality, while also demonstrating strong correlations with the activation of pro-inflammatory and interferon pathways 41031.
DNAm GrimAge
Frequently regarded as the preeminent second-generation epigenetic clock, DNAm GrimAge was trained on mortality outcomes from the Framingham Heart Study offspring cohort 4313739. Rather than directly targeting clinical blood panels, GrimAge utilized 1,030 CpG sites to predict a composite of seven specific plasma proteins associated with inflammation, kidney function, and cardiovascular disease, alongside a surrogate metric for smoking pack-years 43031.
Because it was trained directly on lifespan and mortality endpoints, GrimAge (along with its updated iteration, GrimAge2) consistently demonstrates superior performance in predicting all-cause, cardiovascular, and cancer-specific mortality 4746. It frequently serves as the benchmark standard for evaluating disease risk in epigenetic epidemiology, outperforming previous iterations in predicting the onset of chronic obstructive pulmonary disease, type 2 diabetes, and ischemic heart disease 40.
Third Generation Epigenetic Clocks
While second-generation clocks successfully estimate cumulative health span and total biological age at a single point in time, third-generation clocks quantify the instantaneous rate or pace of biological aging 1373941.
DunedinPoAm and DunedinPACE
The defining models in the third generation are DunedinPoAm and its successor, DunedinPACE (Pace of Aging Computed from the Epigenome) 142. These clocks were developed from the Dunedin Study, a highly unique birth cohort of 1,000 individuals tracked longitudinally from their birth in 1972-1973 through midlife 141. Rather than relying on cross-sectional snapshots of older adults, DunedinPACE tracks within-individual decline across 19 specific biomarkers of organ-system integrity measured sequentially at ages 26, 32, 38, and 45 13842.
Because the Dunedin models were trained on young to midlife adults, the algorithm excludes confounding molecular noise from end-stage chronic diseases that alter the epigenome late in life, such as severe heart failure, advanced dementia, or metastatic cancers 41. DunedinPACE functions conceptually as a biological speedometer rather than an odometer. It provides a single-timepoint measurement indicating how fast an individual's body is declining at that exact moment. For example, an individual with a DunedinPACE score of 1.075 is biologically aging at a rate of 1.075 years for every single chronological year that passes 363941.
Comparative Predictive Performance
The utility of epigenetic clocks in clinical settings relies on the measurement of Epigenetic Age Acceleration (EAA) - the residual deviation between an individual's predicted epigenetic age and their actual chronological age 2933434445. A positive EAA indicates that an individual's biological systems are degrading faster than expected for their demographic cohort, correlating with severe health outcomes.
Large-scale evaluations assessing 14 distinct epigenetic clocks against 174 incident disease outcomes over 10-year follow-up periods demonstrate that second- and third-generation clocks substantially outperform first-generation clocks in disease and mortality prediction 374647.
Models like Horvath and Hannum exhibit weak, often non-significant associations with functional outcomes such as grip strength, gait speed, frailty index, and longitudinal cognitive decline 3536.
In contrast, GrimAge and DunedinPACE showcase remarkable robustness. Studies analyzing cohorts from the NHANES and the Framingham Heart Study report that GrimAge maintains strong positive associations with all-cause, cardiac, and cancer mortality 274645. Analyses utilizing restricted cubic spline models and Cox proportional hazards regression show that each 5-unit increase in GrimAge EAA is associated with a 50% increase in all-cause mortality and a 77% increase in cardiovascular mortality 45.
DunedinPACE delivers equivalent, and in certain contexts superior, predictive power, particularly regarding near-term morbidity. Individuals demonstrating an accelerated baseline DunedinPACE face a 54% increased risk for a new chronic disease diagnosis over a seven-year span 353955. Furthermore, in midlife adults selected for disparate cognitive trajectories, faster DunedinPACE and older GrimAge strongly correlated with impending cognitive decline, whereas first-generation clocks showed no predictive capability 36.
Comparisons with Other Modalities
Direct analyses comparing multiple aging biomarker methodologies confirm the clinical superiority of DNA methylation. While telomere length was previously prioritized, massive statistical analyses by the National Institute on Aging (NIA) indicate that all recognized epigenetic clocks substantially outperform telomere attrition measurements in predicting mortality 7. When assessed against physical functioning tests, epigenetic clocks capture distinctly different aspects of the aging process. In pairwise analyses controlling for underlying genetic effects, both DNAm GrimAge and physical assessments like the Timed Up and Go (TUG) test remain strong, independent predictors of mortality, suggesting they complement rather than replicate each other 348.
Ancestry and Genetic Variance in Epigenetic Estimation
A critical structural limitation in the widespread clinical implementation of epigenetic clocks is their profound reliance on training datasets derived overwhelmingly from individuals of Western European descent 103349. Because epigenetic regulation lies at the intersection of environmental exposure and genetics, population-specific genetic architectures heavily influence baseline DNA methylation levels.
Performance Disparities Across Populations
When applied to multi-ethnic cohorts, established clocks frequently yield disparate error rates and systematic biases. In various applications, Black Americans have often demonstrated artificially accelerated epigenetic aging relative to White Americans 10. This accelerated signal persists even after rigorous statistical adjustments for socioeconomic disparities, access to education, and differences in lifestyle factors 10. Similarly, assessments of African, East Asian, and Indigenous populations report significantly higher aggregate prediction errors compared to validation groups of European descent 3249.
To mitigate these geographic and ancestral biases, researchers are constructing highly localized epigenetic models.
| Region / Population | Specialized Epigenetic Clock Model | Target Metric |
|---|---|---|
| East Asian (EAS) | EAS Clock (Taiwan, Japan, China cohorts) | Chronological Age |
| South Korean | Skeletal Muscle Specific Clock | Chronological Age (Tissue Specific) |
| Global / Diverse | African-corrected clocks (excluding meQTLs) | Chronological Age |
The East-Asian Epigenetic (EAS) clock, developed utilizing specific cohorts from Taiwan, Japan, and China, demonstrates tighter residual clustering and enhanced prediction accuracy for individuals of East Asian descent compared to the Horvath or Hannum clocks 50. Similarly, studies examining aging signatures in postmortem skeletal muscle tissue from South Korean populations have identified novel East Asian-specific genetic variants linked to localized epigenetic age acceleration, further highlighting the necessity of diverse cohort sampling and tissue-specific approaches 5152.
Impact of Methylation Quantitative Trait Loci
The primary biological driver of these population disparities is the presence of Methylation Quantitative Trait Loci (meQTLs) and common Single Nucleotide Polymorphisms (cSNPs). Genetic variants at these loci directly dictate whether an adjacent CpG site is physically capable of being methylated, completely independent of the biological aging process 3249.
An estimated 76% of the CpG sites utilized in the foundational Horvath pan-tissue clock are associated with known meQTLs 32. Depending on the specific clock architecture, up to half of the predictive CpG sites may be heavily influenced by inherited genetic variation 49. Crucially, many of these polymorphic sites exhibit high variance in African populations but are functionally invariant in European populations, thereby inducing systemic miscalculations when European-trained clocks evaluate African genomes 49. Researchers have demonstrated that deliberately excluding cis-meQTL CpG sites during clock construction dramatically reduces error rates in non-European cohorts without sacrificing performance in European populations 1049.
Single Cell Resolution and Epigenetic Network Heterogeneity
Traditional epigenetic clocks extract DNA from bulk tissue samples, such as whole blood, saliva, or buccal epithelial swabs. This bulk sequencing yields an average methylation signal that obscures the profound heterogeneity existing between individual cells within the same tissue 211931. As aging tissues accumulate sporadic senescent cells, bulk analysis struggles to isolate the specific cellular drivers of localized organ dysfunction 1931.
In response, novel deep-learning architectures are being deployed at the single-cell level. Frameworks such as ChromAgeNet utilize advanced microscopy and machine learning algorithms to predict age based on structural chromatin changes in DAPI-stained single nuclei, circumventing traditional array-based methylation limits 53. Furthermore, single-cell DNA methylation studies utilizing computational simulations confirm that major age-dependent alterations are driven by the stochastic flipping of CpG states over time - a process where initially hypomethylated regions stochastically gain methylation, and hypermethylated regions lose it 21.
Experimental interventions using CRISPR-guided epigenetic editing targeting specific age-associated CpG sites have revealed substantial genome-wide bystander effects 20. Editing individual clock sites evokes highly reproducible epigenetic modifications at other age-associated regions, suggesting that age-associated DNA methylation changes are coherently co-regulated within an interconnected epigenetic network rather than acting as isolated biomarkers 20.
Causality Enriched Epigenetic Clocks
A fundamental structural flaw in previous epigenetic models is their inability to differentiate between methylation changes that actively drive biological decay and those that occur as neutral byproducts or compensatory defense mechanisms 315455. Because traditional clocks rely on pure statistical correlation, it is difficult to ascertain whether reversing the clock score via a therapeutic intervention actually reverses the underlying aging process.
To address this, researchers developed causality-enriched epigenetic clocks using Epigenome-Wide Mendelian Randomization (EWMR) across 20,509 specific CpG sites linked to eight distinct aging-related traits 83156. This analytical framework parsed age-related CpG changes into two distinct categories, resulting in two novel machine learning models:
- DamAge: This model tracks detrimental methylation changes that actively inflict age-related damage. Elevated DamAge scores correlate directly with mortality risk, functional decline, and specific age-associated pathologies 31545557.
- AdaptAge: This model tracks protective, compensatory methylation shifts. High AdaptAge scores correlate with increased longevity and resilience, effectively capturing the genome's internal adaptive attempts to mitigate biological stress 8315457.
Crucially, when aged somatic cells undergo artificial cellular reprogramming (transforming specialized cells back into a younger, pluripotent state), DamAge levels decrease significantly - indicating true biological rejuvenation - while AdaptAge levels remain largely unaffected or show no distinct pattern 315557. This uncoupling allows researchers to evaluate whether novel anti-aging therapeutics are successfully reversing fundamental systemic damage or merely altering surface-level molecular correlations 315557.
Multi-Omic Integration and Biomarker Fusion
While epigenetic clocks remain the gold standard for measuring long-term biological aging, they are not without limitations. Transcriptomic and proteomic clocks, though highly responsive to short-term physiological stressors, lifestyle interventions, and acute immune states, exhibit less stability over time compared to the durable molecular signatures provided by DNA methylation 58.
Consequently, next-generation geroscience is moving toward multi-omic fusion models. By integrating the stable, long-term baseline of DNA methylation data with the highly dynamic, real-time signaling of proteomic and metabolomic readouts, researchers can achieve a comprehensive assessment of both inherent aging and immediate physiological health 54058. This unified approach reduces single-modality prediction errors and provides highly interpretable, disease-specific metabolic distortions, paving the way for personalized medical interventions aimed at extending human healthspan 25.