B2B Social Media Platform Performance in 2026
The operational mechanics of business-to-business (B2B) marketing and revenue generation have undergone a fundamental restructuring. As of 2026, the mechanisms through which professional buyers discover vendors, validate solutions, and execute purchasing decisions have migrated away from traditional search engines and static corporate websites. Instead, attention and conversion are concentrated within a complex ecosystem of algorithm-driven social platforms, dark social communities, and direct messaging networks.
This transformation is driven by shifting demographic baselines and technological disruption. Millennials and Generation Z currently constitute 71% of all B2B buyers 1. These digitally native cohorts demand immediacy, transparency, and peer-validated interaction, inherently favoring social platforms over traditional corporate communications 2. Furthermore, the widespread integration of generative artificial intelligence into search engines has severely impacted traditional organic web traffic, forcing B2B organizations to seek visibility outside the conventional search ecosystem 34. Determining the optimal social media platform for B2B engagement requires dismantling the assumption that all platforms serve the same function. Attention and conversion are not sequential events occurring on a single domain. Platforms must be categorized by their specific utility within the revenue pipeline: broad algorithmic reach, high-intent validation, private peer-to-peer influence, or regional conversational commerce.
The Macroeconomic Shift Toward Answer Engine Optimization
To understand why social media has become the primary infrastructure for B2B discovery, one must analyze the collapse of traditional search engine behavior. The deployment of generative AI features, specifically Google's AI Overviews, permanently altered the digital research phase in 2025 and 2026.
The Zero-Click Search Phenomenon
For the informational queries that B2B buyers rely upon during their initial research, organic click-through rates (CTR) plummeted by an unprecedented 61% when AI summaries appeared above traditional organic links 3. This phenomenon accelerated the normalization of the "zero-click" search environment. As of 2026, zero-click searches account for up to 60% to 65% of all Google queries, meaning users receive satisfactory answers directly on the results page without ever navigating to a vendor's website 35.
Consequently, organic web traffic for many B2B organizations contracted by an estimated 15% to 25%, representing a massive loss in top-of-funnel lead generation capabilities 4. Buyers are now completing up to 83% of their vendor research before ever initiating direct contact with a sales representative 3. In response, B2B marketing strategies have pivoted from traditional Search Engine Optimization (SEO) to Answer Engine Optimization (AEO) 5.
Evolving Content Structures for AI Crawlability
The objective of Answer Engine Optimization is not to drive direct website clicks, but to ensure that a brand is cited as a primary source within AI-generated summaries 35. Large Language Models (LLMs) formulate these summaries by parsing highly authoritative, consensus-driven platforms. Consequently, social networks with deep conversational data have become critical infrastructure for brand visibility.
Reddit, for instance, currently captures a 40.2% share of AI search citations 6. By establishing a dominant presence on these social platforms, B2B brands secure visibility in AI summaries, influencing buyers during the critical independent research phase. Furthermore, 75% of B2B buy-side stakeholders now utilize social media platforms as their primary search and discovery tools, actively bypassing traditional search engines for vendor evaluation 7. Legacy content formats, such as gated PDFs, are increasingly viewed as obsolete in an AI-driven ecosystem, as they block the crawlability required for LLM ingestion 4.
Evolving Definitions of B2B Pipeline Velocity
To accurately measure the efficacy of social media platforms, organizations must contextualize social engagement within the mathematical reality of B2B sales cycles and pipeline velocity. Sales pipeline velocity measures the speed at which qualified opportunities move through the funnel and generate revenue.
Baseline Conversion Rate Benchmarks
In 2026, the median conversion rate for a B2B website sits at approximately 2.9% 678. This metric fluctuates heavily based on industry constraints; legal services convert at 7.4%, while complex B2B Software-as-a-Service (SaaS) and enterprise software naturally yield lower top-line website conversions between 1.1% and 3.0% 68.
When analyzing the progression of a lead generated through digital channels, the attrition rates are severe. Industry benchmarks indicate that average funnels convert roughly 2.3% to 2.9% of total visitors into raw leads 68. From that pool, an average of 31% convert to Marketing Qualified Leads (MQLs) 678. The drop-off is most pronounced during the handover to sales; only 13% to 21% of MQLs successfully progress into Sales Qualified Leads (SQLs) 67. Eventually, 20% to 30% of those SQLs become measurable pipeline opportunities, with an ultimate win rate of 22% to 37% 68.
| Funnel Stage Progression | Average Conversion Rate | Key Bottlenecks and Frictions |
|---|---|---|
| Website Visitor to Lead | 2.3% - 2.9% 68 | Low traffic intent; lack of role-level personalization; latency. |
| Lead to MQL | 31.0% - 41.0% 678 | Insufficient firmographic data capture; poor lead scoring. |
| MQL to SQL | 13.0% - 21.0% 67 | Sales response time; lack of immediate follow-up. |
| SQL to Opportunity | 20.0% - 30.0% 68 | Inability to access economic buyers; product alignment. |
| Opportunity to Closed-Won | 22.0% - 37.0% 68 | Negotiation friction; failure to multi-thread buying committees. |
Impact of Deal Size on Sales Cycle Length
The length of a B2B sales cycle is intrinsically tied to Annual Contract Value (ACV). Deals under $1,000 routinely close within 14 to 25 days, while enterprise contracts exceeding $100,000 regularly require 170 days to 9 months to finalize 11. Extensive research into sales pipeline dynamics reveals that the optimal velocity threshold for maximizing both revenue growth and win rates is a cycle lasting between 46 and 75 days 9. Organizations compressing cycles below 45 days often sacrifice deal size, while those languishing past 120 days suffer exponential increases in deal mortality 9.
Furthermore, pipeline tracking frequency directly correlates with financial performance. A 2025 analysis of 247 B2B organizations revealed that companies implementing weekly velocity tracking demonstrate 34% annual revenue growth, compared to just 11% for those with irregular tracking patterns, largely due to the ability to identify bottlenecks before they impact revenue generation 9.
Platform Analysis and Advertising Cost Metrics
The evaluation of B2B social media platforms relies on understanding the disparity between the volume of attention and the quality of conversion. High engagement rates do not inherently correlate with pipeline velocity, and low cost-per-click metrics can frequently mask poor lead quality.
LinkedIn Advertising Efficiency and Organic Suppression
LinkedIn remains the undisputed primary platform for B2B lead generation, with 85% of B2B marketers reporting it delivers the best organic results for their organizations 10. However, the mechanics of success on LinkedIn have shifted dramatically. The organic reach of corporate company pages collapsed by approximately 77% between 2021 and 2026, hovering at an average reach of just 1.6% of total followers 11.
To circumvent algorithmic suppression, successful B2B organizations have pivoted toward employee advocacy and founder-led content. Posts originating from personal creator accounts receive 30% higher engagement, and structured employee advocacy programs deliver 561% more reach and eight times the engagement of standard corporate broadcasts 1112. Additionally, native LinkedIn newsletters have generated a 47% engagement uplift compared to standard text posts 11. A comprehensive Q1 2025 analysis of 9,346 B2B LinkedIn posts revealed that content published without external links achieved an 8.89% average engagement rate, whereas posts forcing users off-platform via external links saw engagement drop to 5.01% 13. The same study found that mid-sized companies (5,001 to 10,000 employees) achieved the highest average impressions per post, while massive enterprises (over 10,000 employees) routinely underperformed 13.
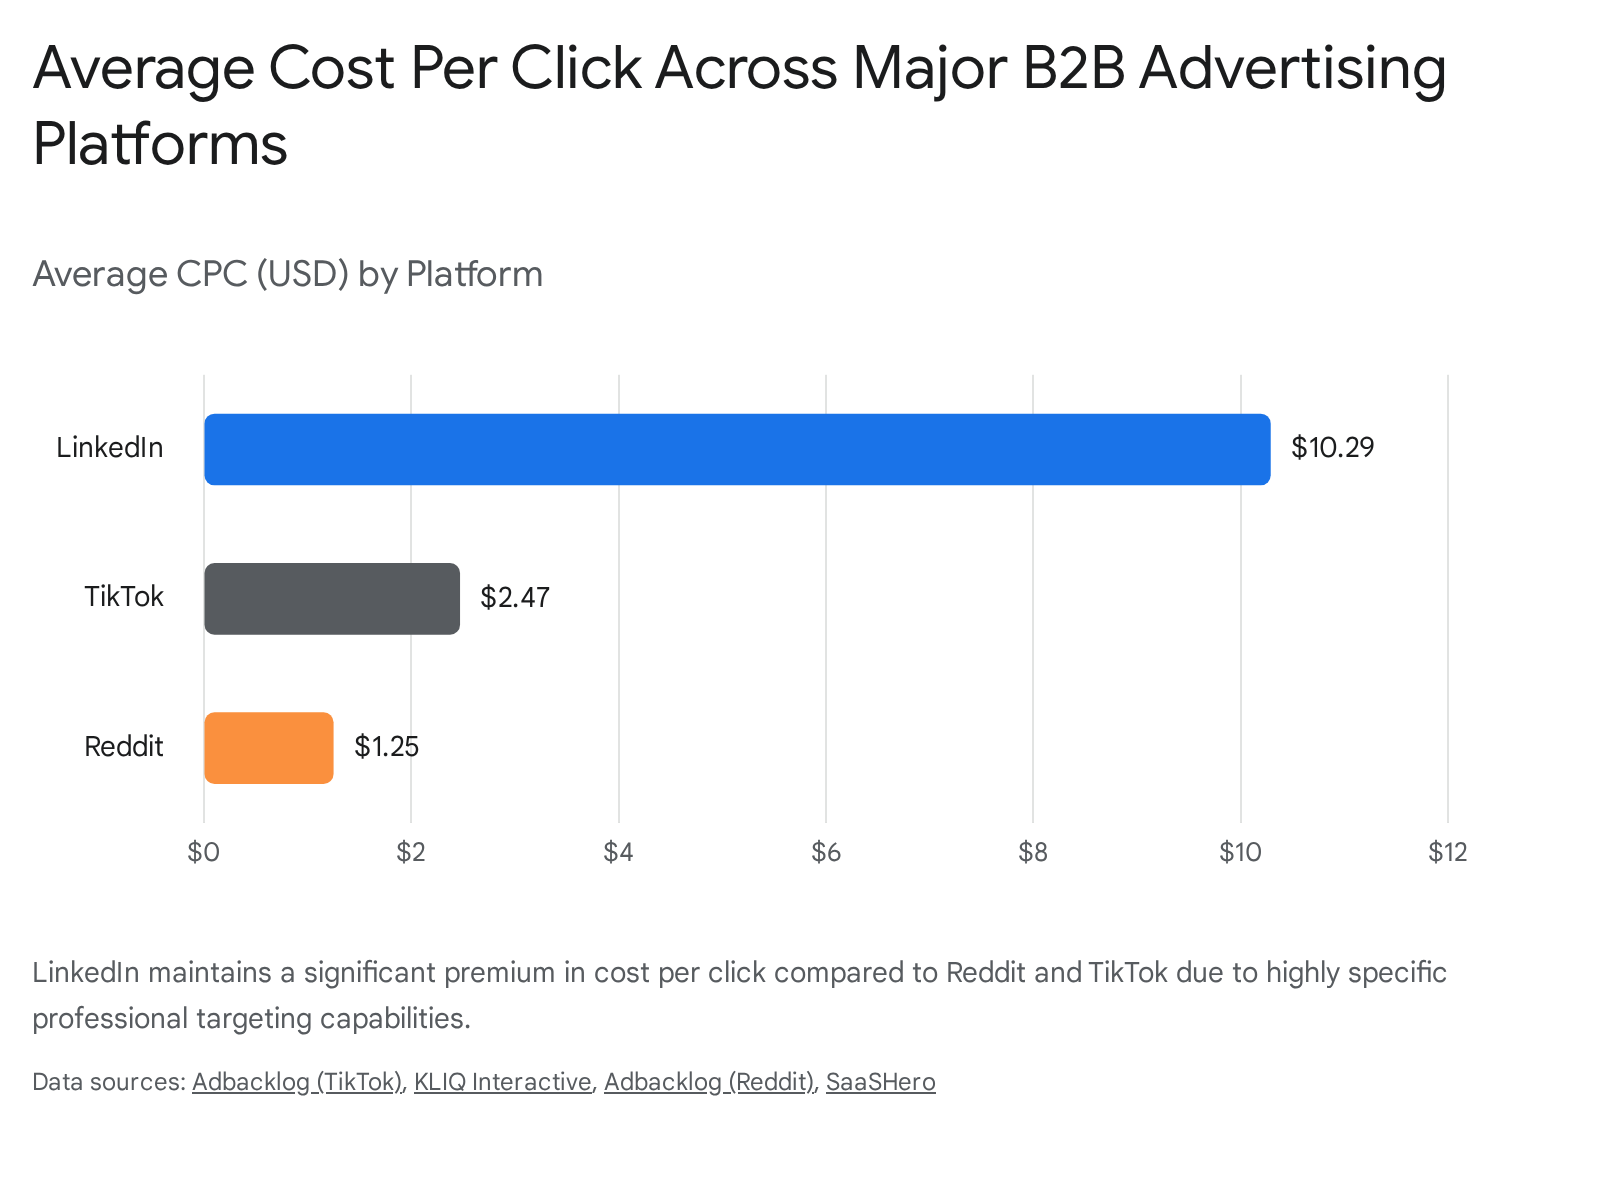
From a paid advertising perspective, LinkedIn operates as a premium environment requiring significant capital allocation. The global average Cost Per Click (CPC) on LinkedIn is $5.58, but targeting highly sought-after B2B decision-makers routinely pushes the CPC between $6.40 and $15.00 1714. The platform's Cost Per Acquisition (CPA) for B2B SaaS companies typically ranges from $150 to $400, while Cost Per Lead (CPL) benchmarks vary from $60 to $500 depending on the specific vertical 14. Click-Through Rates (CTR) for sponsored content average between 0.44% and 0.65%, with single-image formats (0.56%) generally outperforming video (0.44%) and carousel ads (0.40%) 14. LinkedIn Lead Generation Forms, however, convert at a highly efficient 13%, vastly exceeding standard external landing page conversion averages 12.
Despite high initial acquisition costs, the financial unit economics of LinkedIn remain robust for specific business models. LinkedIn advertising generates an average Return on Ad Spend (ROAS) of 113%, outperforming Google Ads at 98% and Meta at 104% 14. This efficiency is derived from the platform's unparalleled ability to filter by firmographic data. Because of this targeting density, LinkedIn is mathematically optimized for B2B organizations executing enterprise deals with an ACV exceeding $10,000 1415. If a company's customer lifetime value cannot support a $400 CPA, paid acquisition on LinkedIn is generally economically unviable 2016.
Reddit Community Validation and Cost Structures
While LinkedIn serves the bottom of the funnel through precise professional targeting, Reddit emerged in 2025 and 2026 as a premier environment for high-intent technical validation and top-of-funnel discovery 1617. Reddit organizes its 121 million daily active users into highly specific, interest-driven communities, allowing B2B marketers to intercept buyers during the deep research phase 17.
The advertising economics on Reddit offer a stark contrast to LinkedIn. Cost Per Click rates on Reddit typically range from $0.50 to $2.00 for B2B software campaigns, allowing advertisers to test multiple creative angles and validate messaging at a fraction of LinkedIn's cost 162318. The Cost Per Action (CPA) for qualified B2B leads on Reddit sits between $50 and $100, significantly lower than the ranges experienced on professional networks 1418. Companies utilizing Reddit advertising have reported ROAS increases of up to 6x, alongside a 63% reduction in cost per sign-up 25.
Reddit's broader utility lies in its role within the digital search ecosystem. As a primary data source for generative AI systems, seeding expert insights within relevant subreddits ensures inclusion in the AI Overviews that buyers rely upon 6. Success on Reddit requires abandoning polished corporate messaging in favor of raw, technical, and highly authentic participation; the platform's user base actively penalizes traditional broadcast advertising 16. As industry practitioners observe, "Reddit teaches, LinkedIn sells," requiring distinct creative approaches for each 16.
Short-Form Video Metrics Across TikTok and YouTube
The assumption that video platforms are exclusively designed for Business-to-Consumer (B2C) marketing has been thoroughly debunked. By 2025, 78% of B2B marketers reported utilizing video, and 41% identified short-form video as the format driving the highest overall ROI 19.
TikTok's user base has aged upward, making it a critical discovery engine for professional buyers 120. TikTok boasts an average organic engagement rate of 4.07%, which is over four times higher than Instagram's 1.22% and vastly exceeds Facebook's 0.09% 2122. From a paid perspective, TikTok's median CPC sits around $0.50, heavily undercutting Meta platforms 2130. For B2B technology and software sectors, the CPA on TikTok ranges from $260 to $500, with conversion tracking heavily reliant on "engaged views" (users watching an ad for six or more seconds before converting) 213132.
YouTube Shorts operates as a direct competitor in the short-form space, delivering an exceptional 5.91% engagement rate 1922. YouTube carries the added advantage of deep trust; 61% of consumers consider YouTube a highly trustworthy source for accurate information, a crucial metric for complex B2B sales 19. Organizations succeeding on these video platforms recognize that attention spans require immediate hooks, with success contingent on delivering dense, educational industry insights.
Meta Platforms and Legacy Retargeting Value
Despite the ascendance of newer platforms, Meta (comprising Facebook and Instagram) retains significant utility within the B2B marketing mix. Meta leads the industry with an average 4.2x ROAS, driven by highly sophisticated algorithmic targeting and Custom Audience capabilities 15.
Facebook remains the most popular platform utilized by marketers overall (57%), maintaining a broad reach that is particularly effective for middle-of-funnel retargeting 33. The average conversion rate for Facebook ads across all industries is 9.21%, though B2B services specifically see conversion rates closer to 10.63% on the platform 34. While Meta lacks the firmographic precision of LinkedIn, its lower CPMs and advanced machine learning models make it an indispensable tool for maintaining brand awareness and recapturing website visitors who initially discovered the brand via organic search or high-cost LinkedIn campaigns 15.
| Social Media Platform | Average B2B CPC (USD) | Average B2B CPA / CPL (USD) | Core Strategic Utility |
|---|---|---|---|
| $5.58 - $15.00 1714 | $150 - $500 14 | High-ACV Lead Generation, Account Targeting | |
| $0.50 - $2.00 2318 | $50 - $100 18 | Technical Validation, AI SEO, Top-of-Funnel | |
| TikTok | $0.50 - $2.50 2131 | $260 - $500 3132 | Algorithmic Reach, Short-Form Video Brand Awareness |
| Meta (Facebook/IG) | Variable | Variable | Sophisticated Retargeting, High-Volume Reach |
Dark Social and the Rise of Community-Led Growth
A critical vulnerability in modern B2B revenue operations is the reliance on traditional marketing attribution software, which systematically fails to track where peer-to-peer influence actually occurs. This invisible ecosystem is referred to as "dark social."
Demystifying Attribution in Private Networks
Dark social encompasses private Slack threads, Discord servers, WhatsApp groups, LinkedIn direct messages, and untraceable email forwards 2336. Research indicates that 77.5% of B2B buyers share content and validate vendors through these encrypted or private channels 36. Furthermore, up to 95% of the time, the winning vendor in a B2B transaction is already positioned on the buyer's internal shortlist prior to the first tracked interaction with the company 24. The reliance on public metrics, such as follower counts, has been widely debunked as a vanity metric; B2B revenue correlates far more strongly with private pipeline influence than public social media following 24.
Because traditional analytics register dark social traffic as "direct" or unassigned web visits, B2B executives frequently misdiagnose the source of their pipeline. This leads to cutting investments in organic social programs simply because attribution software cannot mathematically prove the link between a private Slack recommendation and a closed-won deal 3624. By the time buyers contact sellers, they are now 61% of the way through their purchasing journey - down from 69% in previous years - meaning the most influential stages happen entirely off the radar of standard tracking systems 24.
To capture these high-value buyer intent signals, revenue leaders have shifted toward self-reported attribution frameworks. Mandating a qualitative "How did you hear about us?" field on intake forms reliably surfaces the immense impact of private community recommendations that software attribution models miss 2438. The impact of this shift is measurable: cold outreach reply rates have sunk below 6%, while deals sourced through community channels close faster, exhibit stronger win rates, and yield higher lifetime value 23.
Slack Versus Discord for Ecosystem Development
For organizations aiming to harness dark social by building owned communities (Community-Led Growth), the infrastructural choice almost universally narrows down to Slack or Discord. While both began as chat applications, their economic and behavioral models diverge sharply.
Slack is architected for business productivity and enterprise compliance. It offers over 2,600 application integrations, advanced thread organization, and strict data retention protocols 2526. Consequently, Slack pushes organizations toward account-based revenue, operating essentially as an extension of customer success for existing clients 27. However, its pricing structure ($9 per user per month) and punitive free tier (which deletes message history after 90 days) make it economically hostile to scaling large communities of free prospects 25.
Discord, conversely, optimizes for time spent, broad reach, and community culture 27. With unlimited message history on its free tier and unmatched voice channel capabilities supporting up to 5,000 concurrent users, Discord is ideal for hosting informal industry discussions, live events, and broad lead generation 2526. In the 2026 landscape, hybrid approaches are increasingly common: utilizing Discord to cast a wide net for brand awareness, while reserving Slack for secure implementations with finalized enterprise clients 27.
| Feature / Metric | Slack | Discord |
|---|---|---|
| Primary B2B Function | Customer Retention, Enterprise Workflow | Top-of-Funnel Reach, Community Engagement |
| Free Tier Limitations | 90-day message history limit 2526 | Unlimited message history 2526 |
| Business Integrations | 2,600+ (Extensive CRM connectivity) 2526 | Limited natively 2526 |
| Voice / Live Audio Capacity | Maximum 15 users 2526 | Maximum 5,000 users 2526 |
| Growth Economics | Per-seat costs restrict scaling free users 2527 | Free core functionality allows infinite scale 2627 |
Regional Platform Dominance in Global B2B Markets
The assertion that LinkedIn or standard social feeds are universally optimal collapses when examining B2B commerce outside of North America and Western Europe. In Latin America, Southeast Asia, and China, direct messaging applications have subsumed traditional social media and email marketing, evolving into comprehensive sales funnels.
WeChat and WeCom Infrastructure in China
In the Chinese market, WeChat is the fundamental infrastructure of the internet. With over 1.3 billion monthly active users, it integrates messaging, social feeds, and payment gateways into a single application 2829. For B2B communication, WeChat and its enterprise counterpart, WeCom (which boasts over 130 million active users), are entirely non-negotiable 2930.
Traditional email marketing is largely ineffective in China. Surveys indicate that 90% of Chinese professionals prefer utilizing WeChat for business communications over email or phone calls, and 57% of all new WeChat contacts are strictly work-related 29. B2B brands operate WeChat Official Accounts - specifically Service Accounts - as replacements for corporate websites. These accounts deliver long-form thought leadership, white papers, and case studies, achieving open rates around 7%, which outpaces local email benchmarks 30. When B2B organizations tightly integrate WeChat marketing data with backend CRM systems through WeCom, the performance gains are substantial. Case studies demonstrate that unifying lead capture, behavioral tracking, and sales handoffs within the WeChat ecosystem can triple B2B conversion rates, accelerating them from 2% to 6% 31.
WhatsApp Business Optimization in Emerging Markets
A parallel phenomenon exists in Latin America, India, and Southeast Asia regarding WhatsApp. Meta's continued development of the WhatsApp Business API has transitioned the application from a peer-to-peer chat tool into a high-converting digital channel.
The engagement metrics for WhatsApp render traditional B2B email marketing obsolete in these geographies.
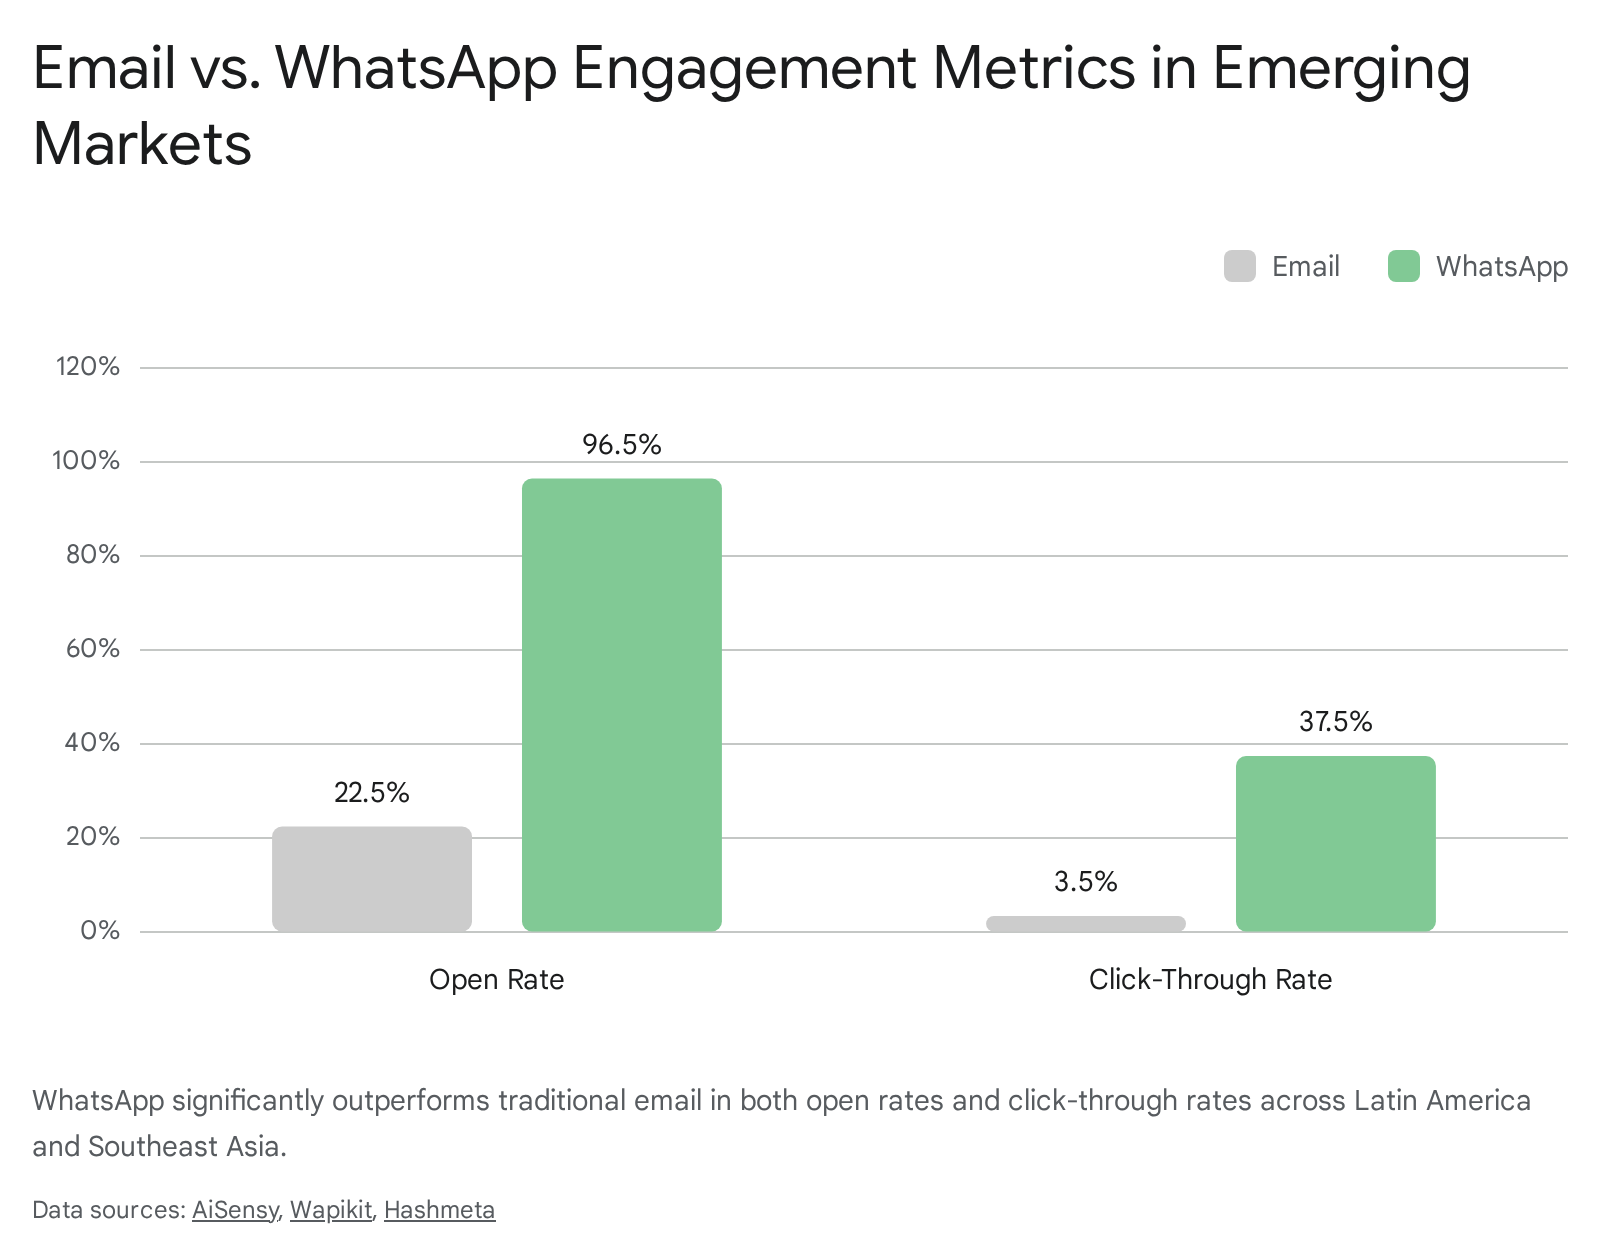
WhatsApp broadcast messages routinely achieve open rates between 95% and 98%, compared to the 15% to 25% averages seen with email campaigns 4632. Furthermore, up to 95% of WhatsApp messages are read within five minutes of delivery 46. Click-through rates on WhatsApp promotional and informational content span from 15% to 60%, drastically overshadowing email CTRs which stagnate around 2% to 5% 4632.
In Latin America, 86% of users indicate a higher likelihood to purchase if a brand is accessible via WhatsApp 3334. B2B companies that optimize their funnels to treat WhatsApp not merely as a customer support widget, but as the central hub for lead capture and qualification, report massive efficiencies. One B2B case study documented a 68% reduction in Customer Acquisition Cost (CAC) and a growth in top-of-funnel lead rates from 0.2% to 4.9% by seamlessly connecting Meta advertising directly into AI-assisted WhatsApp qualification flows 34. Southeast Asian e-commerce and retail businesses similarly report conversion rates of 8.3% via WhatsApp, driven by high customer responsiveness 32.
Academic Perspectives on Social Media Sales Performance
While industry benchmark reports provide immediate tactical data, peer-reviewed academic literature offers a rigorous analysis of how social media fundamentally alters B2B sales methodologies. Extensive bibliometric studies and systematic literature reviews utilizing the SPAR-4-SLR protocol have mapped the intellectual structure of social media's role in B2B sales from 2012 through 2026 3536.
Adaptive Selling Behavior and Relationship Quality
Academic consensus confirms a positive and significant relationship between a B2B salesperson's social media utilization and their overall sales performance 353637. However, this impact is rarely direct; it is mediated through complex relational mechanisms. Social media acts as an intelligence-gathering tool that enhances "adaptive selling behavior" 3738. By monitoring prospects' digital footprints, sales professionals can tailor their communication strategies and product positioning to meet specific client needs before initiating formal contact 3839.
Research utilizing structural equation modeling demonstrates that while social media use positively influences adaptive selling behavior, its direct influence on immediate "relationship quality" can be statistically insignificant in certain models without the mediating factor of emotional intelligence and proper management 37. This underscores that social media provides the context and data necessary to adapt, but the human element remains required to forge the actual trust needed to close complex B2B transactions.
Measuring the Shift from Vanity Metrics to Revenue
Academic literature explicitly warns against the over-reliance on vanity metrics (such as mere follower counts or superficial engagement rates) as predictors of sales performance 3640. Instead, the value of social media in B2B contexts is rooted in its ability to facilitate "customer-oriented selling" and competitive intelligence collection 3840.
The application of social CRM (Customer Relationship Management) allows organizations to integrate social data directly into their pipeline tracking 39. Studies highlight that cultural contexts also moderate these effects; Western markets may lean heavily on platforms like LinkedIn for structured professional networking, while Eastern markets integrate business interactions seamlessly into multipurpose platforms like WeChat, requiring vastly different organizational policies for social media governance 36. Ultimately, the academic consensus aligns with industry findings: social media is an accelerant to the sales process, expanding a salesperson's social capital and ability to qualify leads early in the cycle, rather than functioning as a standalone transactional storefront 3839.
Future Trajectories and 2026 Budget Allocations
Looking toward the remainder of 2026 and into 2027, the financial trajectory of B2B digital ad spending points toward continued, aggressive growth. Global social media advertising expenditure crossed $280 billion in 2025 and is projected by various models to reach between $310 billion and $376.9 billion by 2030, driven by AI-powered ad optimization and short-form video formats 1541. TechSci Research offers a more conservative estimate of $468.9 billion by 2030 at a 3.9% Compound Annual Growth Rate (CAGR), while the Business Research Company projects a more aggressive 13.4% CAGR 4142. Regardless of the specific modeling, the underlying trend demonstrates massive capital influx into the social channel.
B2B Influencer Marketing and Third-Party Validation
According to Forrester research, 83% of B2B marketing decision-makers expected their budgets to grow in 2026, marking a shift from the restrictive "do more with less" environments of previous years 4344. A significant portion of this capital is being diverted away from traditional programmatic display and toward influencer marketing.
Fully 75% of enterprise B2B companies report increasing their budgets for external influencer relations 4546. Marketing leaders are elevating industry analysts, luminaries, and subject matter experts to act as strategic growth levers 4546. This highlights a structural reality of the modern web: buyers fundamentally distrust faceless corporate entities, preferring instead to validate purchases based on the recommendations of trusted individuals. Furthermore, 45.1% of B2B brands are actively formalizing their own employees as influencers to raise awareness, capitalizing on the algorithmic preference for personal profiles over company pages 19.
Projected Social Media Advertising Expenditure
For B2B organizations, optimizing social media strategy relies on balancing acquisition channels against customer lifetime value (LTV). Healthy organizations aim for an LTV to CAC ratio of between 3:1 and 5:1, alongside an ad spend payback period of 80 to 90 days 14. Meeting these economic thresholds in a market where media costs are continually rising requires a sophisticated, multi-platform approach.
Advertisers running coordinated campaigns across three or more platforms consistently outperform single-platform strategies by 25% to 35% 15. This requires deploying highly targeted, premium platforms like LinkedIn to generate direct enterprise pipeline, while simultaneously executing high-volume, low-cost community engagement on platforms like Reddit and TikTok to establish the widespread brand ubiquity necessary for long-term survival in an AI-curated digital economy.