B2B sales pipeline construction and 2026 performance data
The landscape of business-to-business (B2B) sales in 2026 is defined by a fundamental dichotomy. On one hand, the proliferation of artificial intelligence, intent data, and autonomous sales agents offers unprecedented capabilities for targeting and automation. On the other hand, macroeconomic friction, rising customer acquisition costs (CAC), and severe shifts in buyer behavior have rendered traditional volume-based go-to-market strategies obsolete. The median B2B company now spends $2 to acquire $1 of new annual recurring revenue (ARR), representing a structural crisis in marketing economics 12. In the most severe cases, organizations are burning nearly $3 for every dollar of new revenue, indicating that lifetime value to customer acquisition cost (LTV:CAC) ratios have dropped below the sustainable 1:1 threshold for inefficient cohorts 2.
Building a B2B sales pipeline from scratch requires abandoning outdated heuristics - such as the assumption that high-volume cold outreach yields proportional pipeline - and adopting a highly structured, signal-driven methodology. Furthermore, buyers are asserting unprecedented control over the sales cycle. In 2026, 67% of B2B buyers prefer a completely rep-free purchasing experience, and digital-first buyers complete an estimated 61% to 80% of their evaluation journey before initiating contact with a vendor 23456.
This report provides an exhaustive analysis of how to construct a scalable B2B sales pipeline from the ground up. It integrates empirical benchmarks on pipeline architecture, technology stack development, conversion rates, inbound versus outbound economics, and the deployment of artificial intelligence to navigate the modern revenue environment.
Structural Evolution of Revenue Generation
A sales pipeline operates as the fundamental infrastructure for revenue generation. It is a structured operational framework that tracks the specific actions a revenue team must take to move deals forward, stage by stage. Unlike a sales marketing funnel, which maps the psychological and educational journey of the buyer from awareness to decision, the pipeline is strictly seller-focused 79. It provides revenue operations (RevOps) leaders with the necessary levers for forecasting, capacity planning, and stage governance.
Organizations that enforce a formal, disciplined pipeline process experience up to 18% to 28% higher revenue growth than those relying on ad-hoc opportunity management 98. The necessity of this structure is underscored by recent macroeconomic pressures. Following a post-pandemic rebound, average annual revenue growth among surveyed B2B companies decelerated to 16% in 2025, while sales representative quota attainment fell from 52% to 46% 9. This decline is not necessarily due to representatives performing worse on individual deals - win rates and deal durations have largely stabilized for top performers - but rather because representatives are managing fewer overall opportunities as companies focus on efficiency over sheer volume 9.
Core Infrastructure and Technology Stack
Constructing a pipeline from scratch requires establishing a technology stack that enables data collection, outreach, and engagement without overwhelming the sales team. The average enterprise B2B sales representative currently utilizes between 8.3 and 10 separate tools, resulting in overlapping functionality and an estimated $2,340 in redundant spend per representative annually 10. Early-stage organizations or teams rebuilding their operations are advised to adopt a minimalist architecture focused on core competencies, expanding only as the sales team grows.
The foundational technology requirements vary directly with the size and maturity of the sales organization. Below is a breakdown of the minimum viable technology stack required at different stages of pipeline maturity.
| Organizational Stage | Primary Objective | Required Infrastructure Components |
|---|---|---|
| Early-Stage (0 - 3 SDRs) | Prove outbound viability without overcomplicating workflows 11. | A lightweight CRM (e.g., HubSpot Free/Starter, Pipedrive), a unified prospecting and basic outbound automation tool (e.g., Apollo.io), and a basic cloud dialer if the motion relies on cold calling 11. |
| Growing Teams (3 - 10 SDRs) | Add structural governance, reduce manual data entry, and establish consistency 11. | Dedicated sales engagement platforms (e.g., Salesloft, Outreach) sitting atop the CRM to orchestrate multi-channel cadences, supported by lightweight automation (e.g., Zapier) to push form fills and tag leads 1011. |
| Scale-Ups (10 - 30+ SDRs) | Run a governed outbound machine with dedicated pods, playbooks, and specific territory divisions 11. | Enterprise CRM (e.g., Salesforce), specialized conversation intelligence (e.g., Gong, Oliv), heavy data enrichment layers, and orchestration platforms for continuous CRM hygiene 111415. |
Clean, unified CRM data remains non-negotiable. CRM systems still return approximately $8.71 for every dollar invested, but roughly one-third of companies admit that fragmented data is actively costing them revenue 10. The prevailing strategy in 2026 is to build the stack around real workflows rather than theoretical ideals, adopting a "less is more" philosophy where tools that do not integrate cleanly are discarded 1016.
Pipeline Stage Architecture and Governance
A functional pipeline requires strictly defined stages, each possessing non-negotiable entry and exit criteria. Without rigid governance, pipelines suffer from "stale deal rot," artificially inflating executive forecasts and misdirecting resources 78. Best practices mandate a 14-day inactivity rule, where deals that show no buyer engagement for two weeks are automatically flagged for removal or moved to a closed-lost status 8.
Core Stage Definitions
The architectural foundation of a standard B2B pipeline comprises six sequential stages.
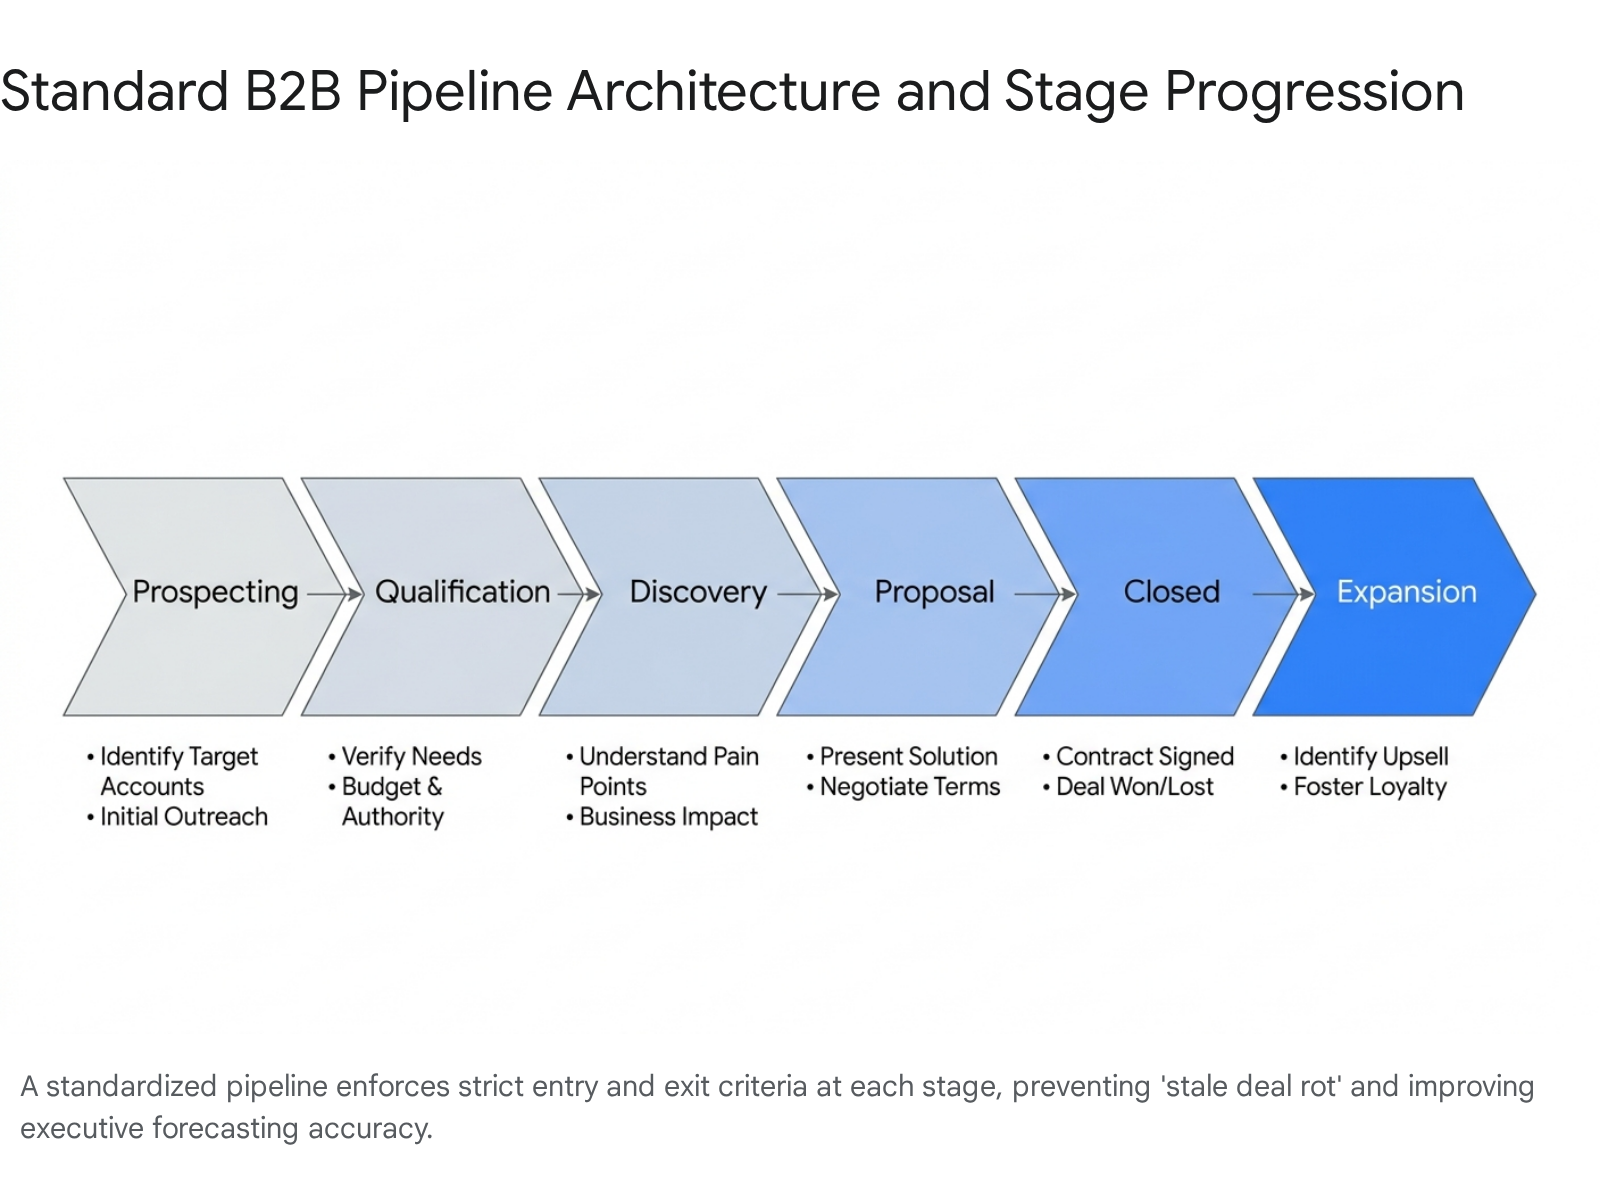
Each stage dictates specific actions required by the sales representative to advance the opportunity.
| Pipeline Stage | Primary Purpose | Entry and Exit Criteria |
|---|---|---|
| Prospecting | Identify and engage accounts fitting the Ideal Customer Profile (ICP) 7. | Entry: New lead captured or target account identified. Exit: Contact data verified and first multi-channel outreach initiated 7. |
| Qualification | Confirm fit and purchasing intent before passing the account to an Account Executive (AE) 7. | Entry: Prospect engages with outreach or requests information. Exit: Qualification framework criteria (e.g., BANT, MEDDPICC) are satisfied 78. |
| Discovery & Demo | Understand the prospect's operational pain points and demonstrate solution alignment 7. | Entry: Prospect agrees to a formal evaluation meeting. Exit: Prospect confirms the solution addresses their specific pain points 7. |
| Proposal & Negotiation | Present the formal solution, align on commercial terms, and navigate legal review 7. | Entry: Prospect requests pricing and scope details. Exit: Verbal agreement is reached and contracts are submitted 7. |
| Closed (Won/Lost) | Record the final outcome to provide visibility and calibrate forecasting models 7. | Entry: Contracts are signed or prospect officially declines. Exit: Deal is logged, and handoff to customer success is completed 7. |
| Expansion & Renewal | Capture post-sale growth opportunities and maximize lifetime value 7. | Entry: Customer achieves initial value metrics. Exit: Upsell or cross-sell contracts are finalized 78. |
Post-sale expansion opportunities are frequently neglected in pipeline models, yet they represent the highest-converting deals within the entire revenue ecosystem due to pre-established trust and reduced procurement friction 8.
Pipeline Coverage Mathematics
To achieve predictable revenue, organizations must maintain adequate pipeline coverage - the ratio of open pipeline value to the revenue quota. The standard baseline is 3x coverage, assuming a balanced sales motion 8. However, the required coverage is mathematically tied to the organization's historical win rate. The defining formula dictates that pipeline needed equals quota divided by win rate 8.
If an organization carries a $500,000 quarterly target and maintains a 25% win rate, it requires exactly $2,000,000 in active pipeline to ensure 4x coverage 8. If the win rate drops below 20%, sales leaders must aggressively push for 4x to 5x coverage to mitigate risk 8. Conversely, elite teams maintaining win rates exceeding 30% can operate efficiently on 2x to 2.5x coverage, allowing representatives to focus more deeply on fewer accounts 8. Furthermore, capping individual representatives at 20 to 40 active deals ensures opportunities receive appropriate attention, as exceeding this capacity ceiling directly correlates with neglected follow-ups and lost revenue 8.
Buyer Behavior Dynamics and Cycle Lengths
The B2B buying environment has become exceedingly complex, fundamentally altering pipeline velocity and conversion expectations. The gap between top-performing revenue organizations and the rest of the market has widened drastically, with data indicating that just 14% of sellers now drive 80% of total revenue 12.
The Preference for Rep-Free Experiences
The defining characteristic of the 2026 buyer is independence. The proliferation of accessible digital information and AI-powered research tools has led to a scenario where 67% of B2B buyers now prefer an entirely rep-free buying experience 4613. This dynamic has created a vast "dark funnel" where buyers conduct extensive, invisible research and evaluation without ever filling out a lead capture form or interacting with a vendor's tracking pixels 19.
Buyers consume an average of 13.4 pieces of content before ever contacting a vendor 20. Consequently, 92% of B2B buyers begin their formal purchasing journey with at least one vendor already in mind, and 41% have a single preferred vendor before any formal evaluation even begins 23. The implications for pipeline generation are severe: the winning vendor is present on the buyer's "Day One" shortlist 95% of the time, and the pre-contact favorite wins approximately 80% of all deals 234. Opportunities generated reactively - where the buyer initiates outreach and the vendor was not previously engaging them - yield a low win rate of 18 - 25%, compared to 33 - 41% for proactive, seller-led engagements 3.
The Buying Committee and Deal Velocity
Sales cycles have lengthened significantly as organizations enforce tighter budget scrutiny and mandate broader consensus across departments. In 2026, 75% of buyers report taking longer to make decisions than in previous years, and the average B2B buying committee for deals exceeding $50,000 now involves 11.2 stakeholders 1220. In complex enterprise scenarios, this number expands to 17 or more individuals cross-functionally 12.
The average sales cycle length varies based on Annual Contract Value (ACV) and the complexity of the solution. While broad surveys indicate an average cycle of 10.1 months spanning 88 touchpoints, granular data focusing on B2B software and services reveals specific timelines based on market segment 24.
| Market Segment | Deal Size (ACV) | Typical Sales Cycle | Buying Committee Characteristics |
|---|---|---|---|
| SMB | <$15,000 | 14 to 30 days | 1 to 3 stakeholders; single decision-maker common. Product-led growth (PLG) trials expedite closing 2114. |
| Mid-Market | $15,000 to $50,000 | 30 to 90 days | 2 to 3 stakeholders; procurement and finance involvement begins. Requires moderate multi-threading 1415. |
| Upper Mid-Market | $50,000 to $100,000 | 60 to 120 days | Security reviews, detailed legal redlines, and formal budget approval cycles add significant friction 141524. |
| Enterprise | >$100,000 | 90 to 180+ days | Formal RFP processes, cross-functional committees, and multi-quarter strategic budget planning required 1415. |
The expansion of due diligence processes, particularly security questionnaires (e.g., SOC 2, GDPR compliance), has become standard practice even for mid-market deals, routinely adding two to four weeks to the average cycle 14.
Geographic Variations in Pipeline Velocity
Sales pipeline velocity calculates how quickly revenue flows through the pipeline system. It is measured mathematically by multiplying the number of opportunities by the average deal size and the historical win rate, then dividing the product by the average sales cycle length 16. Tracking velocity on a weekly basis correlates with a 34% increase in annual revenue growth and 87% forecast accuracy, compared to irregular tracking 16.
Pipeline velocity is highly subject to both industry segment and cultural business dynamics. For organizations building multinational pipelines, understanding the divergence between North American and European buying behavior is critical for accurate forecasting.
The United States market is largely vision-driven, prioritizing scale, novelty, and rapid time-to-value 17. American buyers are generally open to transformation narratives and respond well to metrics centered on aggressive ROI 17. This optimistic, competitive psychology translates directly into higher pipeline velocity, with deals closing significantly faster through rapid pilot programs and quicker scheduling 1718.
Conversely, the European market - particularly in Northern and Central Europe - is process-driven 17. B2B sales cycles in Europe take an estimated 30% to 50% longer than comparable deals in the US, frequently spanning 6 to 12 months for technology solutions versus 3 to 6 months stateside 18. European buyers prioritize validation, rigorous security documentation, and organizational consensus 1718. Extended relationship-building periods are required before commercial commitments are made, and aggressive sales tactics often erode trust rather than accelerate the deal 1718.
Pipeline velocity also fluctuates heavily by industry, driven by capital expenditure requirements and regulatory compliance.
| Industry Segment | Average Win Rate | Typical Sales Cycle | Average Pipeline Velocity |
|---|---|---|---|
| Real Estate & Construction | 16% | 147 days | $2,456 / day 16 |
| Financial Services | 18% | 89 days | $2,134 / day 16 |
| SaaS & Technology | 22% | 67 days | $1,847 / day 16 |
| Healthcare & MedTech | 25% | 72 days | $1,523 / day 16 |
| Manufacturing | 19% | 124 days | $1,289 / day 16 |
| Professional Services | 28% | 51 days | $876 / day 16 |
Financial services and real estate lead in daily velocity despite longer sales cycles and lower win rates, primarily due to significantly higher average deal values 16. Conversely, professional services achieve the highest conversion efficiency but generate lower overall velocity due to smaller contract sizes 16.
Inbound Pipeline Generation Economics
Constructing a pipeline requires deciding how to allocate capital and human resources between inbound demand generation and outbound prospecting. Inbound marketing relies on content creation, search engine optimization (SEO), webinars, and organic social presence to attract buyers who are actively researching solutions.
The primary advantage of inbound methodology is its cost efficiency and long-term compounding return. Empirical data indicates that inbound leads cost an average of 61% to 62% less than outbound leads 281920. Because these prospects initiate the interaction while actively seeking solutions, their intent to purchase is fundamentally higher. Leads sourced organically close at significantly higher rates - averaging 14.6% for SEO leads compared to less than 2% for cold outbound methods 20212223.
Furthermore, inbound channels dominate long-term ROI metrics. SEO generates an estimated 748% Return on Investment and a 9.1 Return on Ad Spend (ROAS) over a three-year horizon, as content assets continue to drive traffic long after the initial investment is made 21. Email marketing to opted-in subscriber lists provides a 261% ROI, yielding approximately $36 to $40 for every dollar spent 202123.
However, inbound generation suffers from a significant drawback: time to value. Inbound strategies require substantial upfront effort and time to gain search authority and market momentum. The average break-even point for an SEO strategy is roughly 9 months, rendering it unsuitable as a sole strategy for early-stage startups needing immediate cash flow 21.
Outbound Prospecting Economics
Outbound sales involves direct, unprompted outreach to target accounts via cold calling, personalized email, and professional social networks like LinkedIn.
The core advantage of outbound pipeline generation is immediate velocity. Unlike inbound, outbound campaigns yield measurable results and pipeline acceleration within 4 to 8 weeks 24. This speed is vital for product launches, entering new geographic markets, or closing immediate quarterly quota gaps 2824. Additionally, outbound allows organizations to control their targeting explicitly, bypassing the wait for ideal customers to discover them and directly engaging high-value enterprise accounts. Deals generated via targeted outbound approaches are, on average, 50% larger than broad inbound conversions 24.
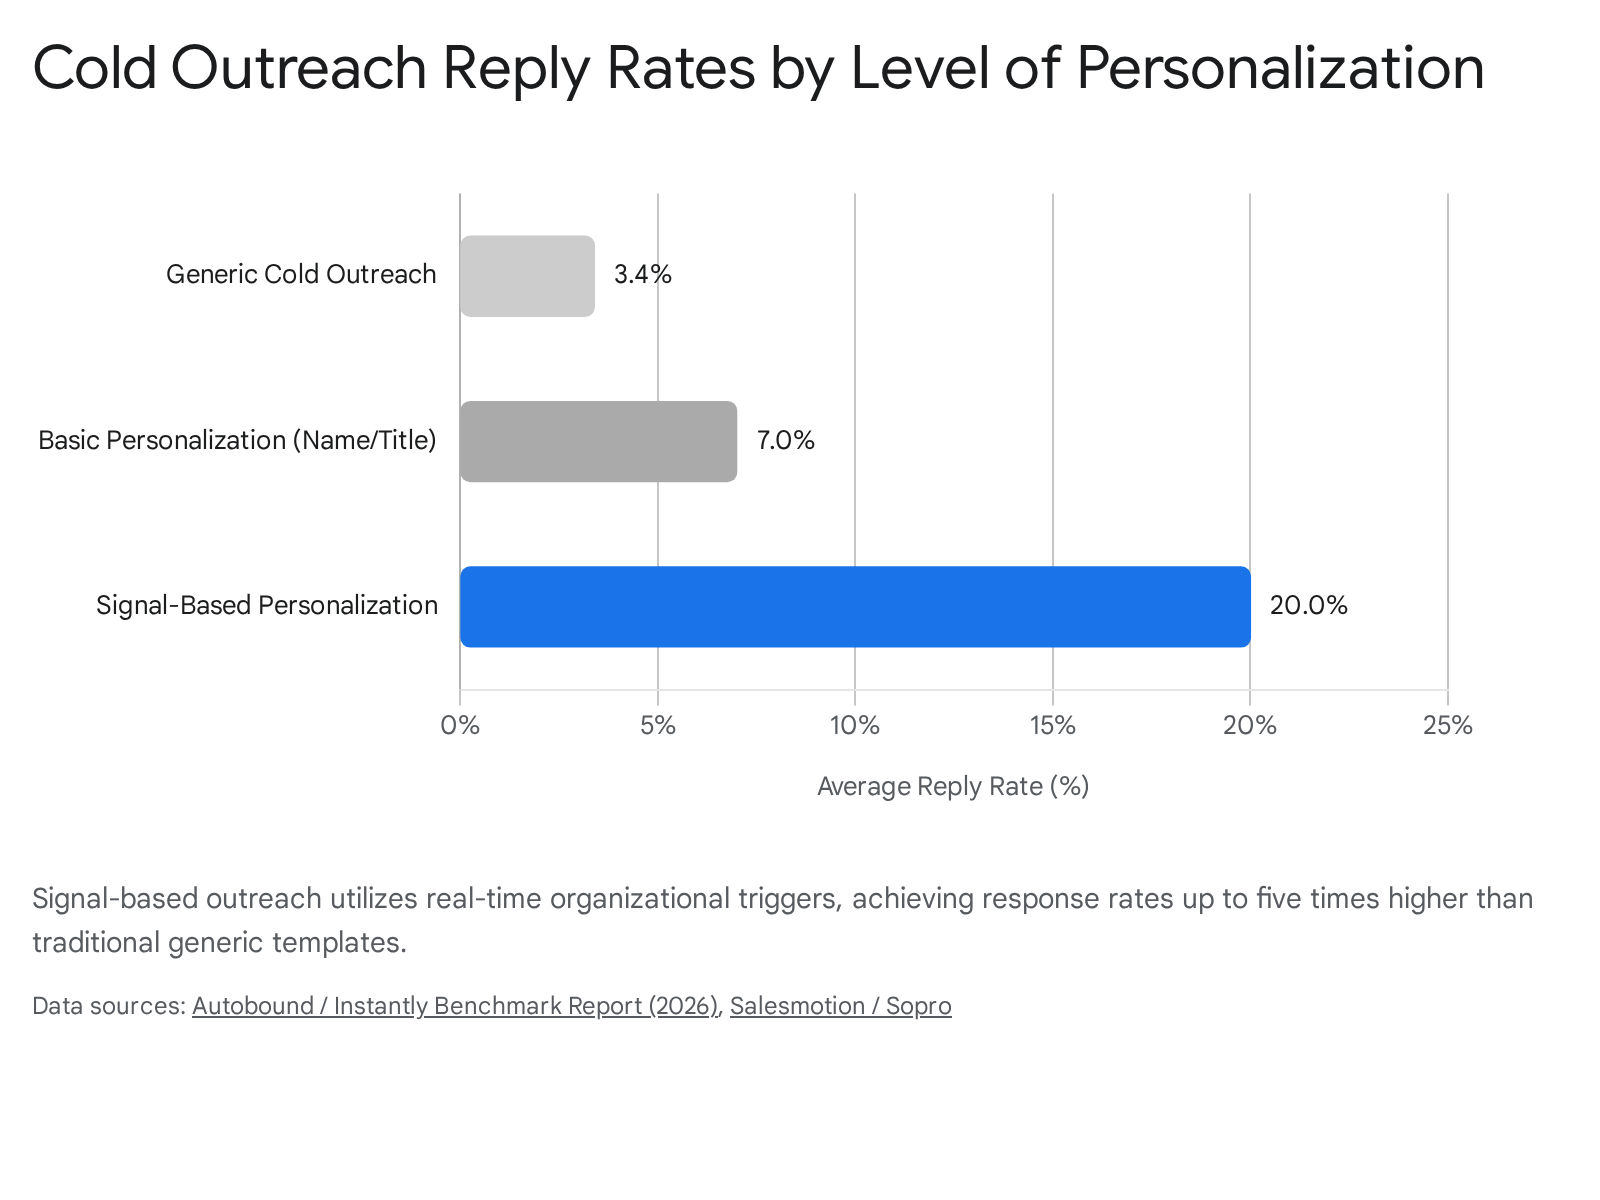
Despite these advantages, the economics of outbound are deteriorating. Outbound channels feature the highest B2B customer acquisition cost, averaging $1,980 per acquired customer, driven by the labor-intensive nature of Sales Development Representative (SDR) teams and the rising cost of accurate data infrastructure 1. Furthermore, the baseline effectiveness of broad, generic outbound has collapsed. The average reply rate for generic cold email has plummeted to 3.43%, and cold calling success metrics remain highly dependent on the representative's skill and list quality, yielding a 5% to 10% meeting booking rate at best 43525.
| Strategy / Channel | Average CAC (2025/2026) | Typical Time to Break-Even | Primary Performance Metrics |
|---|---|---|---|
| Referral Programs | $150 | Immediate | Lowest acquisition cost; highest trust transfer 1. |
| Organic Search (SEO) | $290 | 9 Months 21 | 748% ROI; 14.6% Close Rate; highest long-term efficiency 12122. |
| Paid Search (PPC) | $802 | 4 Months 121 | 36% ROI; Provides predictable volume but high Cost Per Acquisition (CPA) 12122. |
| Paid Social (LinkedIn) | $982 | Variable | 229% ROI for structured paid campaigns; highly effective for precise B2B targeting 121. |
| Outbound Sales (Cold) | $1,980 | 4 to 8 Weeks 124 | Under 2% Close Rate for broad campaigns; fastest path to high-ACV enterprise pipeline 123. |
The Hybrid Mandate and Account-Based Marketing
The escalation of B2B CAC - which surged by 40% to 60% between 2023 and 2025 - has forced a shift away from binary "inbound versus outbound" debates 119. High-performing organizations rely on an integrated, "allbound" model. The prevailing allocation strategy in 2026 directs roughly 60% of resources to inbound channels to build broader brand awareness and educate the market, while dedicating 40% to outbound channels to actively target high-value accounts 28.
This integration is operationalized through Account-Based Marketing (ABM). ABM merges inbound content strategy with outbound precision by orchestrating personalized digital advertising, customized web experiences, and direct SDR outreach against a finite list of high-value accounts. In 2026, ABM has transitioned from an experimental tactic to a mature program category, with 76% of enterprise B2B organizations utilizing formal ABM structures 20.
The empirical data demonstrates that ABM-led programs generate 2.6x more pipeline per marketing dollar than traditional broad-reach demand generation 20. ABM campaigns feature 41% higher win rates and yield 33% larger deal sizes once an account converts, primarily because the strategy aligns marketing and sales in dedicated "pods" focusing holistically on entire buying committees rather than isolated individual leads 2026. Marketing teams that successfully focus on buying committees via ABM report up to 81% higher overall ROI compared to non-ABM approaches 26.
Artificial Intelligence and Signal-Based Selling
The most consequential evolution in B2B pipeline generation heading into 2026 is the transition from volume-based prospecting to signal-based selling, enabled by the near-universal adoption of artificial intelligence. Today, 89% of revenue organizations utilize AI in some capacity 27. The performance divide is stark: sales teams actively leveraging AI report a 17-percentage-point advantage in revenue growth compared to non-adopters (83% of AI-enabled teams saw growth versus 66% of non-adopters) 1227.
The Shift to Signal-Based Intelligence
Signal-based selling is an operational methodology where representatives utilize real-time buyer triggers to prioritize accounts and personalize outreach dynamically. Rather than working through static lead lists filtered only by firmographics (e.g., industry, company size), representatives target live buying windows 352829.
High-leverage signals include: * Organizational Changes: New executive hires or leadership transitions. Incoming leaders typically deploy 75% of their strategic budgets within their first two quarters, drastically compressing evaluation windows 294130. * Technographics: Indicators that a company is migrating technology stacks, installing a competitor's software, or adopting complementary platforms 2941. * Financial and Regulatory Events: Recent funding rounds, mergers and acquisitions, or specific strategic language parsed by AI from SEC filings and quarterly earnings calls 352841. * First-Party Intent: Prospects exhibiting high-intent behaviors on owned properties, such as visiting pricing pages multiple times or engaging heavily with gated architectural content 29.
The performance gap between generic outreach and signal-based outreach is vast. While generic cold email yields an average reply rate of 1% to 5% (with an industry median of 3.43%), outreach customized to specific buying signals achieves response rates between 15% and 25% 20352831.
The AI SDR Paradox and Deliverability Collapse
Despite the profound enthusiasm surrounding autonomous AI Sales Development Representatives (AI SDRs) - a software category projected to grow at a 29.5% CAGR to reach $15 billion by 2030 - the implementation of fully autonomous outreach has revealed severe operational failure modes 2731.
An analysis of 2026 enterprise data exposes what analysts term the "AI SDR Paradox." While 22% of teams have attempted to replace human SDR functions entirely with AI agents, these software tools experience a 50% to 70% annual churn rate, nearly double the turnover of the human representatives they were intended to replace 2731. Vendors frequently sell the promise of infinite outreach volume, but email service providers (ESPs) such as Google and Microsoft have aggressively adapted their spam filtration algorithms to detect programmatic messaging.
Organizations that attempt to scale automated, agentic AI volumes face a predictable "deliverability collapse." Deliverability research from 2026 indicates a median 38-point drop in sender reputation scores (on major scales like Google Postmaster) within 90 days of launching high-volume agentic campaigns. This collapse occurs because ESPs pattern-match the homogeneity of AI-generated templates at scale 32. Furthermore, reliance on third-party intent data to feed these agents without human verification results in a 31% to 47% false-positive rate. Consequently, agents frequently spam accounts that possess zero genuine buying intent, consuming valuable outbound capacity and damaging brand equity 32.
The prevailing consensus for 2026 is that AI must be utilized to surface intelligence, summarize account research, and aid human orchestration, rather than being deployed to mindlessly automate mass communication without strategic oversight 92832.
Data Privacy and Outbound Compliance Frameworks
An outbound pipeline cannot be legally or functionally built without strict adherence to international data privacy laws. In 2026, compliance is no longer solely a legal concern; it is a fundamental operational deliverability requirement. Unsubscribe headers that fail to function, missing postal addresses, or deceptive subject lines now simultaneously violate federal laws and trigger algorithmic spam filters, permanently damaging domain reputation 3346.
The two primary frameworks governing cold B2B outreach operate on fundamentally different regulatory philosophies.
| Compliance Framework | Geographic Scope | Consent Model | Primary B2B Prospecting Requirements | Penalty Maximums |
|---|---|---|---|---|
| CAN-SPAM | United States | Opt-Out | Sender must include a valid physical postal address, clear identification that the message is an ad, accurate routing info, and honor opt-outs within 10 business days 334748. | $53,088 per individual email violation 334748. |
| GDPR | European Union | Opt-In (or Legitimate Interest) | Treats professional corporate emails as protected personal data. Requires a documented Legitimate Interest Assessment (LIA) proving business purpose outweighs privacy, plus immediate opt-out capabilities 334647. | €20 million or 4% of global turnover 3348. |
| CASL | Canada | Strict Opt-In | Extremely strict. Implied consent through existing business relationships exists, but precise wording and an 18-month expiration rule apply 4649. | Significant monetary penalties and individual liability. |
A common misconception suggests that GDPR outright bans cold B2B email. In reality, it requires a documented lawful basis for processing, which most B2B teams satisfy via the "Legitimate Interest" pathway under Article 6(1)(f) 3346. Because modern B2B campaigns frequently cross borders and IP addresses are fluid, legal and revenue operations teams strongly recommend adopting the stricter GDPR and CASL standards universally. Implementing immediate one-click opt-outs and rigorous data verification simplifies global infrastructure and safeguards sender reputation across all jurisdictions 3348.
Pipeline Conversion Rate Benchmarks
Tracking funnel conversion rates provides the diagnostic telemetry necessary to identify bottlenecks and optimize pipeline performance. Conversion metrics vary heavily depending on the organization's average contract value, their blend of inbound versus outbound generation, and the specific industry sector.
When aggregating data across various B2B sectors, the total lead-to-closed-won rate consistently sits below 1%, reflecting the rigorous disqualification processes, extensive buying committees, and high friction inherent in modern B2B purchasing 20.
The transition from Marketing Qualified Lead (MQL) to Sales Qualified Lead (SQL) remains the primary point of friction for most organizations. In 2026, MQL definitions have tightened significantly as teams rely more on intent data and behavioral scoring rather than basic content downloads. Consequently, while MQL volume has dropped, the overall B2B MQL-to-SQL conversion rate hovers around 17% 20. B2B Software-as-a-Service (SaaS) companies significantly outperform traditional industrial sectors due to product-led growth trials and streamlined digital evaluations, achieving median rates between 32% and 40% 205051.
The following table summarizes median cross-industry B2B funnel benchmarks for 2026.
| Funnel Stage Transition | Overall B2B Median | B2B SaaS Median | Professional Services Median | Manufacturing Median |
|---|---|---|---|---|
| Visitor to Lead | 2.1% | 2.8% | 1.9% | 1.4% 20 |
| Lead to MQL | 31.0% | 34.0% | 29.0% | 24.0% 20 |
| MQL to SQL | 17.0% | 32.0% - 40.0% | 16.0% | 13.0% 205051 |
| SQL to Opportunity | 58.0% | 61.0% | 57.0% | 52.0% 20 |
| Opportunity to Close | 20.0% - 24.0% | 24.0% - 25.0% | 27.0% | 21.0% 2050 |
| Compound: Lead to Close | 0.78% | 0.95% | 0.71% | 0.43% 20 |
While the aggregate metrics provide a baseline, high-performing organizations achieve significantly better outcomes. For instance, post-proposal win rates routinely rise to 31% to 50% for teams that enforce rigorous early-stage qualification and utilize signal-based selling, ensuring that only accounts with verified pain and budget reach the final stages of the pipeline 12.
Conclusion
Building a high-performing B2B sales pipeline in 2026 demands a complete departure from the volume-centric playbooks that defined the previous decade. As customer acquisition costs inflate rapidly and buyers increasingly shield themselves within self-directed digital research, revenue generation requires precision engineering rather than blunt force.
Success is contingent on establishing strict pipeline governance, adopting an integrated "allbound" allocation that leverages both inbound compounding returns and targeted outbound account-based marketing, and transitioning wholly to signal-based intelligence. Revenue organizations must utilize artificial intelligence not to spam markets blindly, but to engage buyers contextually when their intent peaks. Organizations that prioritize data hygiene, strategic alignment, and rigorous conversion tracking will achieve compounding pipeline velocity, while those relying on generic automation will inevitably succumb to deliverability failures, extended sales cycles, and declining win rates.