B2B Content Performance on LinkedIn and Other Platforms in 2026
The business-to-business marketing landscape has undergone a structural transformation in how professional attention is captured, retained, and converted. As search engines increasingly fulfill informational queries directly on search engine results pages and professional audiences fragment across niche communities and short-form video feeds, traditional inbound traffic models have destabilized. In this environment, platform-native content, algorithmic relevance, and trust-based creator networks have superseded generic broadcast marketing. This report analyzes the 2026 B2B content ecosystem, evaluating performance metrics across LinkedIn, video networks, audio formats, and emerging regional platforms to identify where active buyer attention currently resides and how it correlates with pipeline generation.
The Generative Search Decoupling and Organic Visibility
For over a decade, B2B content strategies relied on a transactional exchange: brands published educational materials, and search engines rewarded them with organic discovery traffic. By 2026, this correlation has fundamentally fractured into what industry analysts term "The Great Decoupling" 1. While global daily search volumes grew to between 9.1 and 13.6 billion queries in 2025, clicks exiting the search engine results page to external B2B websites are in steep decline 1.
The proliferation of artificial intelligence integration, specifically Google's AI Overviews and AI Mode, has transformed the search engine into an answer engine. In 2024, 58.5% of all searches were "zero-click" interactions, a figure that rises to 77.2% on mobile devices 1. When Google's full conversational AI Mode is activated for complex queries, the zero-click rate reaches 93% 2. Consequently, 73% of B2B websites experienced a significant organic traffic loss between 2024 and 2025, with an average year-over-year decline of 34% 1. News publishers and broad discovery-focused pages have been impacted the most, with organic visits to news sites dropping from over 2.3 billion to under 1.7 billion between mid-2024 and mid-2025 2.
Despite this reduction in inbound traffic, audience demand for information has not contracted. Users spend an average of 49 seconds reading AI Mode responses, and up to 77 seconds for complex B2B brand comparisons 2. Concurrently, ChatGPT processes 2 billion queries daily and serves 800 million weekly active users, acting as an alternative search interface 2. Brand visibility now occurs heavily within the search interface or conversational AI platforms, meaning B2B content must be optimized for Generative Engine Optimization and direct platform consumption rather than solely for click-through rates 134. This shift has catalyzed the reallocation of marketing resources toward platforms where audiences actively dwell and interact with native content.
B2B Buyer Journey Evolution
The contraction of traditional search traffic coincides with an increasingly complex and prolonged buyer journey. B2B decision-makers use an average of 10 interaction channels in a single purchase journey, up from five in 2016, with 42% utilizing 11 or more distinct touchpoints 5. Furthermore, 71% of B2B buyers are now Millennials or Generation Z, up from 64% in 2022, shifting the demographic preference toward self-directed digital research over traditional sales engagements 5.
The modern purchasing cycle involves 88 touchpoints across an average of four channels, and a typical B2B software purchase involves 6 to 10 stakeholders 34. Buyers are completing the majority of this process autonomously; 80% of B2B deals are ultimately won by the vendor the buyer preferred before ever engaging directly with sales representatives, and 94% of buyers utilize large language models to synthesize and organize their research during the evaluation phase 4.
To meet this self-directed research demand, content marketing has expanded to represent 26% of total marketing spend in 2026 5. The average budget directed toward content increased by 18% year-over-year, with total content marketing industry revenue projected to reach $107 billion 59. Production costs vary significantly based on format depth; while a standard blog post averages $340 including strategy and distribution, comprehensive long-form assets average $4,200 5. However, organizations with documented content strategies generate three times more leads per dollar spent than those operating without formal frameworks 5.
LinkedIn Algorithmic Architecture and Organic Reach
LinkedIn remains the dominant operating system for B2B networking and content distribution, hosting approximately 1.2 billion to 1.3 billion members globally with 310 million to 424 million monthly active users 10612. The platform is responsible for 75% to 85% of all B2B leads generated via social media channels 1013. However, the mechanics of organic distribution on the platform were rebuilt following the implementation of the "360Brew" algorithm, a 150-billion-parameter foundational model trained specifically on professional behavior and predictive tasks 1478.
The Transition to the Interest Graph
The 360Brew architecture shifted LinkedIn from a social graph, which prioritized content from direct connections, to an interest graph, which prioritizes content based on thematic relevance and past user behavior 7. This evolution resulted in a 63% to 66% decline in overall impression volume across the platform, paired with a simultaneous 12% to 39% increase in per-post engagement 7. The algorithm aggressively filters content, rewarding deep relevance and penalizing broad, generic broadcasts.
A phenomenon termed the "ghost mode trap" occurs when creators optimize for superficial viral reach. By accumulating engagement from broad, unrelated audiences, creators inadvertently train the algorithm to display future content to individuals outside their ideal customer profile, thereby suppressing commercial lead generation despite maintaining high vanity metrics 17.
Distribution Weighting Metrics
Under the current algorithmic framework, traditional engagement measurements have been recalibrated. Dwell time - the duration a user spends viewing a post - significantly outweighs standard reactions in determining distribution scope 78. Posts that retain users for 61 seconds or more achieve an average engagement rate of 15.6%, compared to just 1.2% for posts with a 0-3 second dwell time 7.
Comments remain the strongest active signal. Algorithmic weighting estimates indicate that a detailed comment carries approximately 15 times the distribution value of a simple reaction, though natural language processing systems assess the quality of the comment 7. Content that triggers three or more substantive comments within the first 60 minutes of publication receives an average 5.2x reach amplification 9. Conversely, the platform explicitly penalizes artificial engagement pods and inauthentic automation through AI detection 7.
Performance Divergence Between Profiles and Pages
The LinkedIn algorithm exhibits a pronounced structural bias toward personal profiles over corporate entities. Content shared by employees or executives achieves 561% greater reach (a 6.61x multiplier) and 2.75x more impressions than identical content shared via a company page 9.
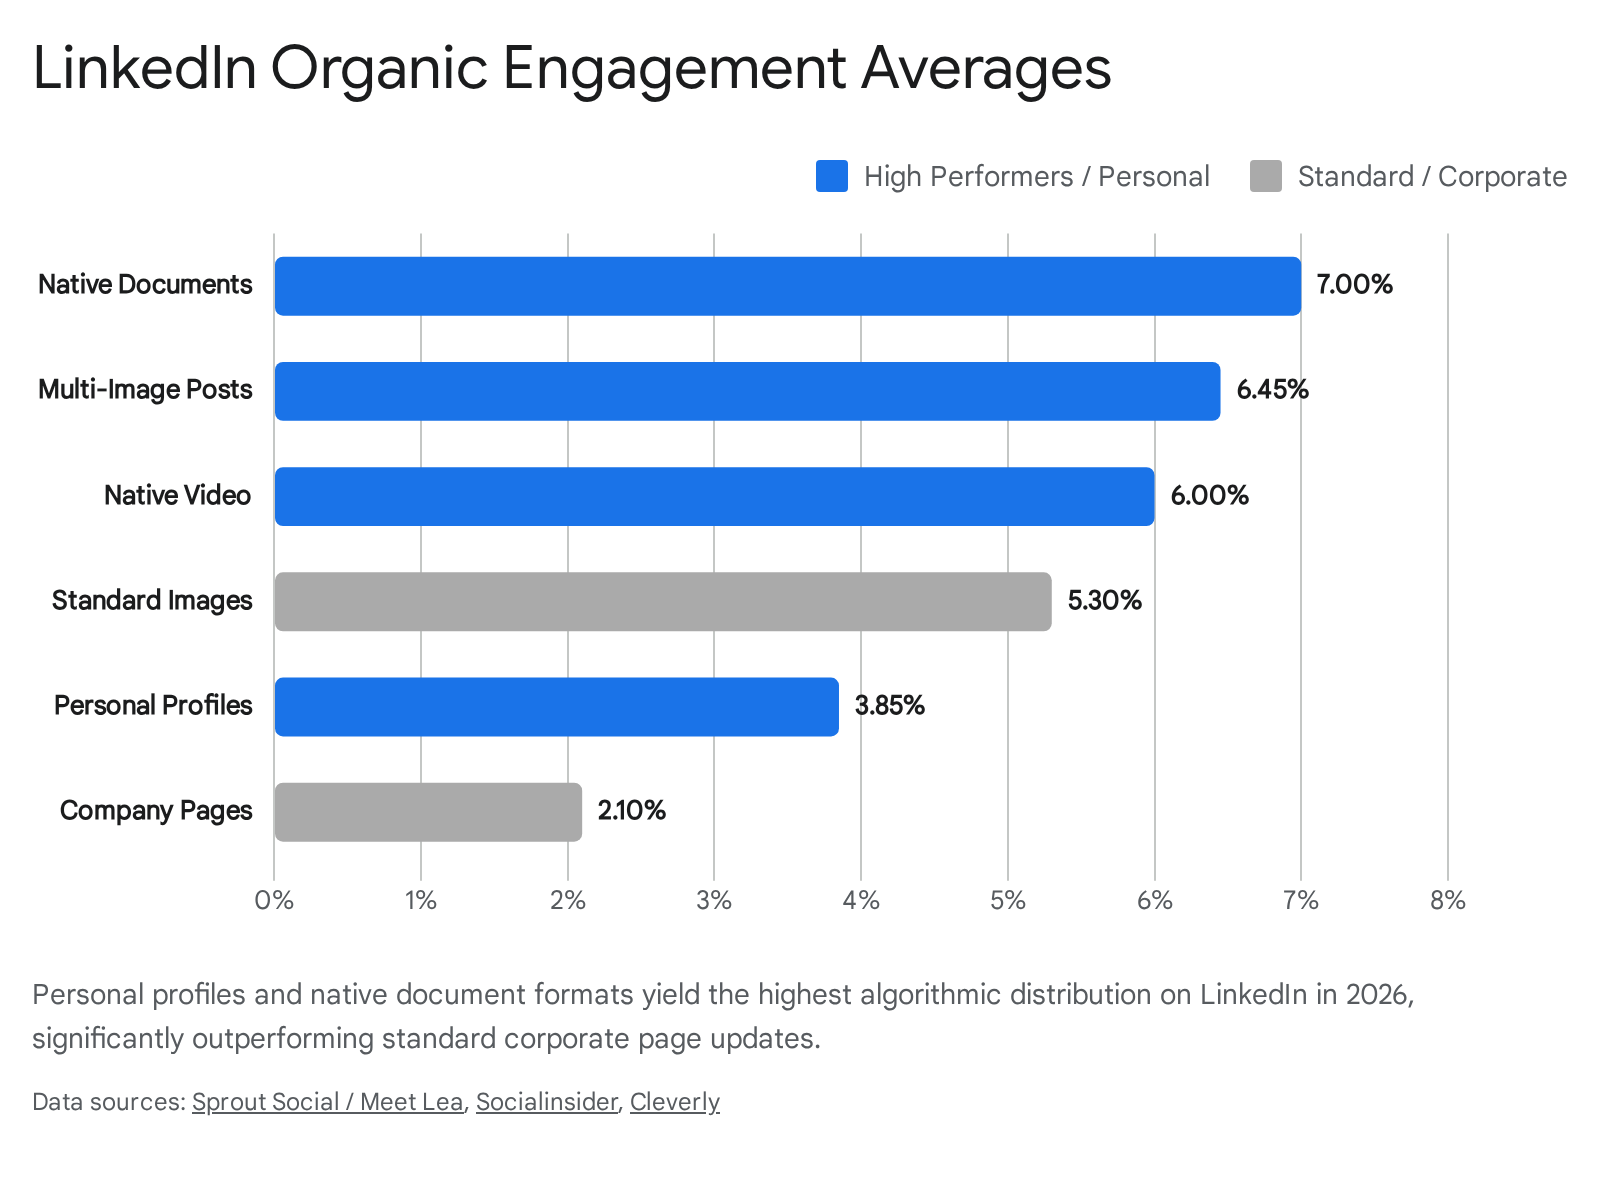
The median engagement rate for personal profile content in 2026 is approximately 3.85% to 4.7%, whereas company pages average between 1.0% and 2.1% 689. This discrepancy stems from the algorithm's preference for peer-to-peer authenticity and its mandate to limit free corporate broadcasting. Consequently, employee advocacy programs and executive thought leadership have become mandatory mechanisms for organic B2B visibility. Employee advocacy programs yield an 800% increase in overall engagement, and leads generated through these individual networks convert 7 times more frequently than traditional marketing leads 9.
The format of the content itself also dictates performance. Native document posts lead organic performance with a 7.00% average engagement rate, followed by multi-image carousels at 6.45%, video at 6.00%, single images at 5.30%, and text-only posts trailing at 4.50% 1219.
LinkedIn Paid Advertising Performance and Economics
As organic reach constrains corporate pages, paid media budgets have migrated heavily toward LinkedIn. By 2026, LinkedIn captures 41% of total B2B advertising budgets, up from 39% the previous year 310. While platforms like Meta offer lower nominal costs for reach, B2B purchasing evaluates efficiency at the account level rather than the individual contact level.
Cost Metrics and Return on Ad Spend
LinkedIn is the highest-cost major social advertising platform, reflecting its premium audience quality and limited inventory relative to consumer networks 11. In 2026, the average global CPC (Cost Per Click) across all industries reached $5.74, a 9% year-over-year increase 12. CPC inflation outpaces general search in high-seniority categories, ranging up to $7.95 for legal services and $6.84 for financial services, while education ($4.18) and nonprofit sectors ($3.12) remain more cost-efficient 12. The average CPM (Cost Per Mille) fluctuates between $30 and $50 globally 1011.
Despite high upfront costs, LinkedIn is the only major paid social channel currently delivering a positive average B2B Return on Ad Spend (ROAS) at 121%, compared to 67% for Google Search and 51% for Meta 310. This efficiency is driven by audience qualification. When analyzing pipeline efficiency, the cost per company influenced on LinkedIn dropped to €70.11, compared to €128.70 on Meta and €110.37 on Google Search 3. The high initial cost is offset by elevated downstream conversion rates, as professional targeting reduces the volume of unqualified prospects entering the sales pipeline 11.
High-Performing Ad Formats and Targeting
The maturation of specific ad formats and AI bidding integrations has altered B2B media buying strategies on the platform:
- Lead Gen Forms: Native forms that auto-populate user profile data minimize friction and maintain a 6.1% average conversion rate, approximately five times higher than external landing pages 1012. High-performing campaigns hit 10% to 15% conversion rates 1324. Consequently, Lead Gen Forms lower the Cost Per Lead by 20% to 30%, making them the default bottom-of-funnel conversion surface 1013.
- Thought Leader Ads: Promoting organic posts from executives or employees rather than standard brand creatives yields highly efficient returns. Thought Leader Ads average a CPC of $2.29 and a CTR of 2.68%, making them roughly 77% cheaper and six times more efficient than standard single-image ads, which suffer a $13.23 CPC and a 0.42% CTR 13.
- Message and InMail Ads: Direct inbox placement achieves a 57.5% average open rate, with highly targeted sends reaching up to 85% 68. Click-through rates on InMail calls-to-action average 3.2% 6.
- Predictive and ABM Audiences: Account-Based Marketing campaigns utilizing uploaded company lists combined with persona filters convert 2.7x higher than standard industry or seniority targeting 12. The sweet spot for audience sizing is 50 to 500 companies. Additionally, AI-driven Predictive Audiences yield a 19% CTR lift by building lookalike models based on active platform engagement signals, driving a 14% CPL improvement for upper-funnel campaigns 12.
Cross-Platform Video Attention Benchmarks
Video consumption is the dominant format across professional networks, growing 1.6 times faster than all other content types on B2B platforms 25. Over 60% of total social media consumption is accounted for by video content in 2026, and 91% of businesses actively use video as a marketing tool 1415. Artificial intelligence tools have reduced the median video production cost from $4,200 to $2,500 per finished minute, accelerating adoption among mid-market enterprises 15.
Short-Form Video Dominance
Short-form videos (under 60 seconds) generate 2.5x more engagement per impression than static formats and are cited by 41% of marketers as delivering the highest ROI 1516. Accordingly, 57% of marketing budgets now include a dedicated short-form video line item 15.
When comparing short-form ecosystems, YouTube Shorts leads in overall engagement rate at 5.91%, followed by LinkedIn video at 5.60%, and TikTok at 3.85% to 5.30% 1417. While TikTok offers exceptional scale with users spending an average of 52 minutes daily on the application, its B2B utility is currently best suited for broad top-of-funnel awareness 30. Videos under 30 seconds see completion rates of 35% to 45% on LinkedIn, whereas completion rates on TikTok must exceed 75% to trigger significant algorithmic distribution 1731.
Vertical video formats (4:5 or 9:16) have become mandatory for mobile feed environments. On LinkedIn, vertical video Click-Through Rates average 30% to 40% higher than traditional 16:9 landscape videos because they occupy maximum mobile screen real estate 31. Furthermore, 50% of mobile video is viewed without sound, making silent autoplay captions an absolute requirement to prevent audience drop-off 3032. Videos with subtitles see a 28% higher completion rate among B2B audiences 33.
| Platform / Format | Avg. Engagement Rate | Optimal Video Length | Target Completion Rate |
|---|---|---|---|
| YouTube Shorts | 5.91% | Under 60 seconds | 85% - 110% |
| LinkedIn Native Video | 5.60% - 6.00% | 20 - 45 seconds | 30%+ |
| TikTok | 3.85% - 5.30% | 15 - 30 seconds | 75%+ |
| Instagram Reels | 1.23% - 1.48% | Under 30 seconds | 40% - 50%+ |
| Long-Form (General) | Varies widely | 5 - 10 minutes | 50% |
Long-Form Video and Content Validation
While short-form video drives discovery, long-form video secures buyer conviction. The average length of B2B marketing videos consumed has decreased to 4 minutes and 15 seconds, but 68% of B2B buyers watch long-form videos before finalizing a purchase 1533. Videos exceeding five minutes naturally feature lower completion rates (averaging 50%), but they accumulate substantially more total watch time and rank highly for informational search queries 17. Websites that embed high-quality video on landing pages record an 86% increase in conversion rates, reducing the cognitive load required to understand enterprise software or complex industrial products 1415.
Live video streaming and webinars have also matured; 73% of B2B marketers rate webinars as a top lead generation tool 15. Webinar registration-to-attendance rates average 40%, with replay engagement demonstrating a long shelf life. Replays between 31 and 45 minutes record more than double the engagement of those under 30 minutes, indicating that intent-driven audiences value comprehensive technical detail over brevity once they enter the validation phase 34.
The B2B Influencer and Creator Economy
Influencer marketing, once relegated to B2C consumer goods, has matured into a strategic pillar for B2B demand generation. In 2026, 55% of B2B marketers leverage influencer or creator partnerships, and 75% of enterprise companies plan to increase their influencer relations budgets to offset declining institutional trust 1618. B2B buyers place a premium on third-party validation; 87% of decision-makers trust thought leadership more than traditional advertising 4.
The Superiority of Micro-Influencers
B2B influencer strategy diverges sharply from B2C tactics by prioritizing niche expertise over mass reach. Follower count is virtually irrelevant compared to audience composition. A micro-influencer possessing 8,000 to 55,000 engaged followers within a specific industry vertical will mathematically outperform a macro-influencer with 500,000 general followers 419.
Data from over 6,700 B2B campaigns reveals that micro-influencers achieve an 8.7% average engagement rate, compared to just 2.3% for macro accounts 19.
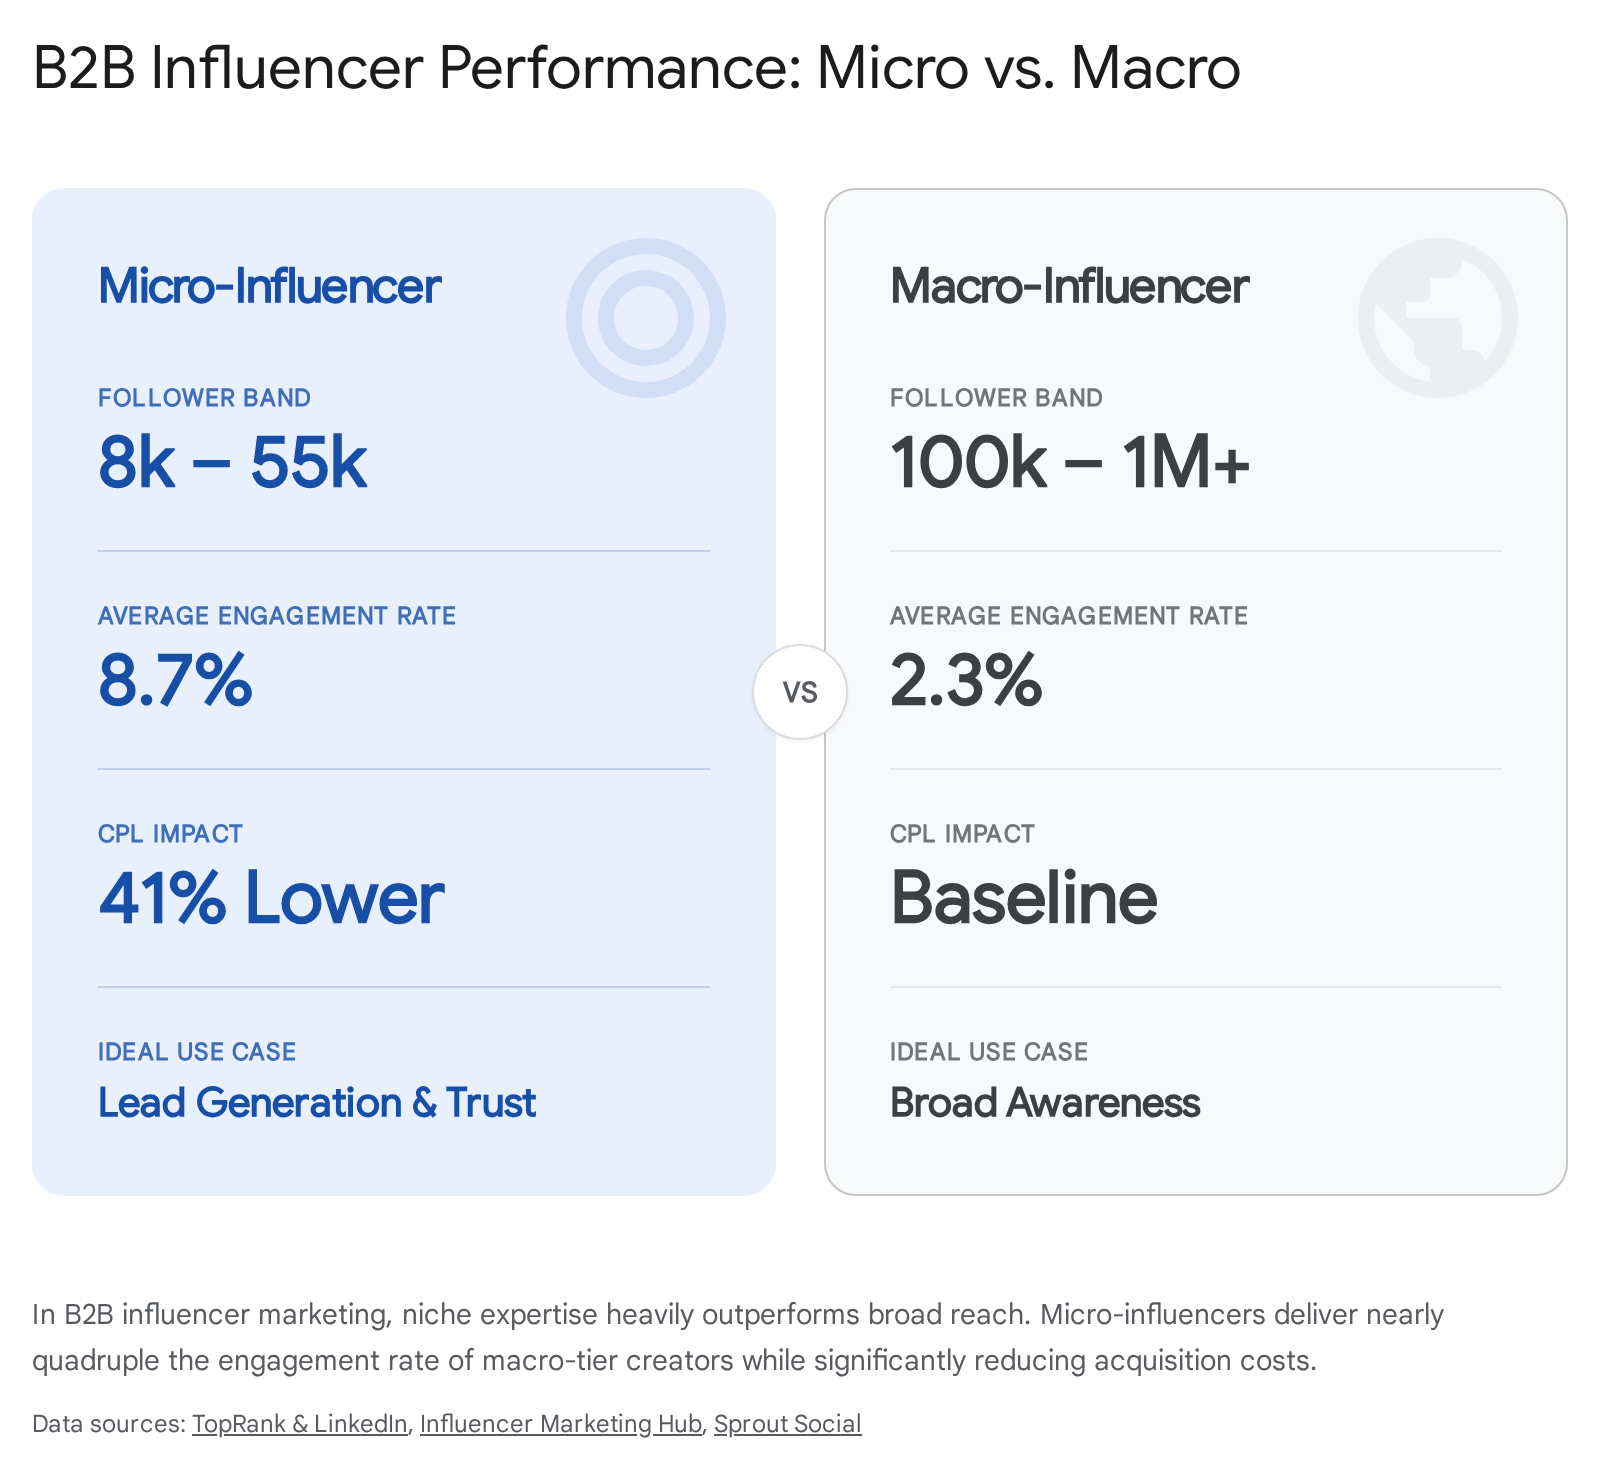
Furthermore, micro-led campaigns reduce the cost-per-qualified-lead by 41% and lift content-to-demo conversion rates by 29% 19. Because B2B purchasing decisions involve numerous stakeholders, trust built through an independent industry expert dramatically accelerates pipeline velocity.
LinkedIn as the Influencer Hub
LinkedIn accounts for 71% of all B2B influencer activity 20. The highest-performing campaigns utilize an "always-on" strategy rather than one-off sponsored posts. B2B teams employing ongoing, long-term creator collaborations are 17 times less likely to report their programs as ineffective 20. Across 22 industry verticals, mature B2B influencer campaigns have demonstrated an average ROI of 647%, with cybersecurity and SaaS sectors seeing pipeline generation ratios of $8.20 for every $1 invested 19. B2B influencer campaigns produce an average lead conversion rate of 3.4%, substantially higher than the 1.9% average seen in B2C influencer programs 20.
High-Retention Owned Media: Podcasts and Newsletters
As organic reach on rented social platforms becomes constrained by algorithmic volatility, B2B brands are aggressively investing in owned media assets. This approach focuses on creating premium, enclosed environments for high-intent buyers, prioritizing audience retention over fleeting impressions 38.
The B2B Podcasting Sector
The global podcast audience reached 638 million listeners in 2026, driving $5.03 billion in global ad spend, of which $4 billion is highly targeted B2B inventory 2140. Podcasting effectively captures the attention of the executive class; 83% of senior executives listen to podcasts weekly, utilizing audio formats during transit or off-hours when screen-based marketing cannot reach them 21.
The defining performance metric of podcasting is retention. In an era of three-second social media hooks, podcast episodes command an average completion rate of 83.4%, with business and finance genres reaching 87% 40. Branded B2B podcasts average a listener commitment of 21 minutes per episode, with completion rates climbing as high as 90% for top-tier branded shows 2122. Consequently, companies with branded podcasts record 89% higher brand awareness, and listeners are 22% more likely to consider purchasing from the sponsoring brand 2122. Despite premium production costs ranging from $18,000 to $42,000 per episode, 90% of brands investing in podcasts report satisfaction with their revenue outcomes 2122.
LinkedIn Newsletters
Complementing audio strategies, LinkedIn Newsletters have emerged as the fastest-growing text format on the platform, experiencing 150% year-over-year subscriber growth 6. With over 450 million total subscriptions across the ecosystem, LinkedIn newsletters bypass feed algorithms to deliver push notifications directly to users' devices. They boast an average open rate of 42% (compared to standard email marketing averages of 21.5%) and generate 2.1x higher engagement than standard long-form articles published on the network 6. Top-tier newsletters retain 72% of their subscribers after six months 6.
Emergent High-Intent Ecosystems: Reddit and WhatsApp
While LinkedIn controls the traditional professional networking layer, B2B attention is increasingly manifesting in untraditional arenas built around specific conversational utility.
Reddit for Peer Validation
Reddit has evolved from a broad consumer forum into a critical research hub for B2B buyers seeking unfiltered, peer-reviewed technical evaluations. Boasting 121 million daily active users, Reddit captures buyers at the exact moment of software comparison and intent formulation 23. Users frequently append "site:reddit.com" to search queries to bypass search engine optimization manipulation and access authentic user experiences 23.
B2B advertising on Reddit often yields lower CPCs than LinkedIn, with click-to-trial conversion rates hovering between 1% and 5% depending on the friction of the offer 43. Businesses integrating Reddit into their media mix report up to a 34% improvement in overall cost-per-purchase and a 257% increase in revenue attributed to community validation 23. This highlights a shift where long-term return on ad spend is unlocked through deep community conversations rather than direct-response clicks 23.
WhatsApp: The Global B2B Communication Layer
Outside of North America, WhatsApp serves as the primary infrastructure for professional commerce. By early 2026, the application hosts over 3.3 billion monthly active users across 180 countries, with 200 million businesses utilizing the WhatsApp Business platform 2445. Enterprise spending on the business platform is projected to exceed $3.6 billion annually 45.
For global B2B operations - particularly in India (535.8 million users), Brazil (148 million users), and Indonesia (112 million users) - WhatsApp has effectively replaced email as the default communication channel 46. The platform delivers extraordinary engagement metrics: open rates range from 95% to 98%, with 88% to 95% of messages read within five minutes, and 57.82% receiving a reply within one minute 24. The integration of AI chatbots and API automation allows B2B firms to qualify leads, execute support, and process transactions directly in chat. Automated WhatsApp campaigns routinely achieve lead conversion rates of 28%, generating up to five times more leads than traditional email marketing and accelerating brand response times by 225% 46.
Asia-Pacific Market Fragmentation and Platform Dominance
Global B2B marketers cannot apply Western digital playbooks to the Asia-Pacific region, which now accounts for nearly 80% of global B2B e-commerce share 47. The digital ecosystem requires structural, platform-level localization rather than simple language translation.
China: The WeChat Monolith
In China, Western platforms have limited utility. Following the shutdown of LinkedIn's localized "InCareer" application due to regulatory and competitive pressures, LinkedIn retains a minimal footprint 4825. B2B commerce and professional networking are centralized almost entirely within WeChat and its enterprise counterpart, WeChat Work 5051.
WeChat functions simultaneously as a CRM, a content distribution hub, and a direct sales channel. B2B official accounts publish technical articles that appear directly in professional message feeds, achieving open rates exceeding 20% - vastly superior to Western email benchmarks 48. WeChat Mini-Programs host product catalogs, event registrations, and gated content without requiring users to exit the application, effectively building the entire buyer journey from awareness to conversion natively 5152. Furthermore, platforms like Maimai serve as China's primary professional networking equivalent to LinkedIn, while Zhihu operates as a highly educated Q&A platform crucial for establishing B2B thought leadership and technical credibility 50.
Southeast Asia and Japan
In Southeast Asia, B2B digital transformation is accelerating rapidly. Cross-border B2B trade is growing at over 9% annually, projected to exceed $45 billion 47. The regional digital economy is powered by mobile-first super apps (e.g., Grab, Gojek) and the rapid adoption of B2B Buy Now, Pay Later credit structures seamlessly embedded into digital marketplaces 26. Between 2021 and 2026, the eB2B landscape in Indonesia is growing at a compound annual growth rate of 46% 54.
In Japan, where purchasing behaviors favor long-term trust, careful consensus decision-making, and structural alignment, templated global websites fail. Success requires high-level structural localization, understanding of thought styles, and integration with regional payment systems 4726.
Full-Funnel Conversion and E-Commerce Benchmarks
Understanding where attention lies must be paired with realistic expectations of how that attention converts into pipeline revenue. B2B sales cycles in 2026 remain complex, involving extensive buying committees and spanning an average of 75 to 180 days 27. Evaluating performance requires precise, stage-by-stage benchmarking rather than blended averages.
Funnel Stage Drop-Off Rates
Cross-industry aggregated data outlines the standard progression of a B2B lead through the sales pipeline:
- Visitor-to-Lead: The average B2B website visitor-to-lead conversion rate sits at 2.9% 2728. B2B Software-as-a-Service companies typically see lower initial rates of 1.5% to 2.5% due to higher product complexity, though top-decile performers achieve 8% to 15% through aggressive AI-driven personalization 57.
- Lead-to-MQL (Marketing Qualified Lead): Roughly 31% of raw leads transition to MQL status 2728. This fluctuates wildly based on traffic source; website-generated leads convert at 31.3%, referrals at 24.7%, and webinars at 17.8% 2757.
- MQL-to-SQL (Sales Qualified Lead): This transition is frequently the main bottleneck. The cross-industry average sits at 13% 29. However, in the B2B SaaS sector, this stage averages 32% to 40% 57. Top-performing teams utilizing behavioral intent scoring convert at 39% to 40% 29.
- SQL-to-Opportunity: Approximately 20% to 30% of sales-qualified leads become formal pipeline opportunities 27.
- Opportunity-to-Closed-Won: This final stage averages 20% to 25% across general B2B, while highly optimized B2B SaaS companies reach approximately 37% 2757.
| Funnel Stage Transition | Cross-Industry B2B Average | B2B SaaS Average | Top-Tier Performer (SaaS) |
|---|---|---|---|
| Visitor → Lead | 2.90% | 1.50% - 2.50% | 8.00% - 15.00% |
| Lead → MQL | 31.00% | ~30.00% | 40.00%+ |
| MQL → SQL | 13.00% | 18.00% - 40.00% | 39.00% - 40.00% |
| SQL → Opportunity | ~20.00% | ~20.00% | 30.00%+ |
| Opportunity → Closed-Won | 6.00% - 9.00% | 20.00% - 25.00% | 37.00%+ |
B2B E-Commerce and Cost Metrics
When analyzing B2B e-commerce platforms, distinguishing between session-to-purchase and quote-to-order metrics is essential. The best-supported range for actual B2B e-commerce purchase conversion (completed orders) is between 1.8% and 3.0% 559. However, in manufacturing sectors with complex workflows, quote request conversion may sit at 5%, but with only 15% of quotes becoming orders, the effective purchase conversion is roughly 0.75% 559.
The primary financial driver for upgrading B2B commerce systems is cost-to-serve reduction. Processing a B2B order manually costs between $50 and $150, accounting for data entry, communication, and exception handling 60. Automated e-commerce platforms reduce this to $25 or less 60. For a distributor processing 100,000 orders annually, maintaining manual processes costs approximately $8 million more per year than a self-service portal, yielding a payback period measured in months 60.
Consequently, marketers in 2026 are shifting from measuring Cost Per Lead to Cost Per Opportunity (CPO) and Pipeline Velocity 61. Tracking the speed at which high-fit leads move through the funnel provides a more accurate reflection of marketing impact, as high-volume, low-quality channels ultimately erode sales efficiency and inflate the Cost Per Opportunity 61.
Conclusion
The 2026 B2B attention economy is defined by the erosion of zero-click inbound search traffic and the ascendancy of platform-native, algorithmically curated validation. LinkedIn remains the undisputed center of gravity for professional networking and B2B media budgets, but its 360Brew architecture forces organizations to decentralize their corporate voices. Brands must leverage personal employee profiles and niche micro-influencers to achieve organic scale and bypass the algorithmic suppression of traditional company pages.
Simultaneously, content consumption has polarized into specific modalities. Short-form video serves as the primary engine for awareness and discovery across LinkedIn, YouTube Shorts, and TikTok, delivering unmatched engagement density. Conversely, long-form podcasts, webinars, and deep-dive Reddit communities serve as the validation engines that secure buyer trust and high retention. Finally, as global commerce expands, a nuanced operational integration with regional communication monopolies - like WeChat in China and WhatsApp in Latin America and India - is critical for multinational pipeline generation. The organizations accelerating growth in 2026 have abandoned the quest for generic reach, prioritizing hyper-relevant engagement within the exact feeds, audio channels, and chat applications where their buyers conduct business.