B2B content marketing and pipeline generation benchmarks 2026
The business-to-business marketing landscape is currently undergoing a structural transformation characterized by a fundamental realignment of resource allocation, shifting buyer autonomy, and the rapid deployment of advanced measurement architectures. Macroeconomic pressures have forced a recalibration of marketing budgets, which now sit at a cross-industry median of 9.1% of company revenue, representing a slight decrease from the 9.5% median observed in the previous year 1. This reduction does not indicate an industry-wide move toward austerity; rather, it reflects a strategic reallocation of capital away from untrackable, broad-reach demand generation campaigns and toward account-based marketing, artificial intelligence infrastructure, and high-fidelity intent data integration 1.
The operational mandate for content marketing has shifted strictly from audience acquisition and top-of-funnel volume to pipeline velocity and definitive revenue contribution 23. Customer acquisition costs have climbed between 40% and 60% across most sectors since 2023, while the lead-to-closed-won rate currently sits below 1% across nearly every business-to-business vertical 12. In response, marketing operations are transitioning away from vanity metrics, such as gross pageviews and unverified lead volume, toward rigorous pipeline influence scoring, pipeline velocity tracking, and the integration of algorithmic multi-touch attribution systems 225. Furthermore, the proliferation of artificial intelligence in both content creation and buyer research is forcing organizations to navigate an increasingly complex environment defined by zero-click search behavior and the expansion of the untrackable dark funnel.
Macroeconomic Environment and Marketing Budget Allocation
The allocation of marketing capital is highly dependent on specific industry verticals and the complexity of the underlying go-to-market motion. While the cross-industry median budget sits at 9.1% of revenue, the software sector commands a notably higher allocation at 11.4% of revenue, reflecting the intense competition and higher margins associated with recurring revenue models 1. Professional services organizations maintain a median allocation of 8.9%, while manufacturing firms operate with lower relative marketing overhead at 5.7% of revenue 1.
The pressure on these budgets is compounded by rising acquisition costs. Current benchmarks indicate that the cost to acquire a customer has reached between $100 and $400 for small-to-medium business segments, $400 to $800 for mid-market accounts, and exceeds $800 for enterprise engagements 2. For software-as-a-service companies, the median customer acquisition cost has reached $2.00 to acquire $1.00 of new annual recurring revenue, a 14% increase from historical baselines 3. Consequently, organizations are strictly monitoring the ratio of lifetime value to customer acquisition cost, targeting a minimum threshold of 3:1, with high-performing software companies achieving ratios between 4:1 and 7:1 2.
To maintain these efficiency ratios, marketing executives are aggressively defunding generic content syndication and broad digital advertising in favor of targeted account-based marketing. Data demonstrates that account-based marketing programs generate 2.6 times more pipeline per marketing dollar compared to traditional demand generation, yielding 41% higher win rates and 33% larger average deal sizes once a target account converts 1. This underscores a broader industry movement toward precision targeting and the integration of first-party data to maximize the yield on total marketing spend.
Buyer Journey Dynamics and Sales Disintermediation
The architecture of the purchasing process has expanded in both duration and complexity, forcing digital content to assume persuasive responsibilities historically managed by human sales representatives.
The Autonomous Buyer Preference
A structural shift has occurred in how procurement and line-of-business leaders evaluate potential vendors. Survey data indicates that 67% of business buyers explicitly state a preference for a completely rep-free purchasing experience, and 67% of the entire buyer journey is now completed autonomously before any direct engagement with vendor sales teams occurs 14. Buyers are consuming an average of 13.4 pieces of content prior to initiating contact, up from 11.6 pieces in previous reporting periods 1.
This autonomy is heavily facilitated by artificial intelligence. Approximately 94% of buyers now utilize large language models and generative artificial intelligence search applications to synthesize research, organize feature comparisons, and establish vendor shortlists 89. The impact of this early-stage, self-directed research is profound: by the time a buyer formally engages a sales representative, 80% of purchasing decisions heavily favor the vendor that the buyer had already preferred based solely on digital content consumption 8.
The implication for content strategy is that digital assets can no longer serve merely as top-of-funnel bait designed to force a preliminary sales interaction. Content must provide comprehensive value clarity - a definitive, highly contextualized understanding of how a solution improves specific business outcomes - without requiring human intervention 4. Organizations failing to provide un-gated, highly detailed technical and pricing documentation frequently find themselves excluded from artificial intelligence-generated shortlists before they are even aware an account is in-market.
Committee Expansion and Cycle Velocity
The size and composition of the buying committee have expanded, fundamentally altering the trajectory of enterprise deal cycles. For transactions exceeding $50,000, the median buying group now comprises 11.2 distinct stakeholders, an increase from 9.7 individuals in 2024 1. This expansion is driven by tighter corporate risk mitigation protocols, requiring consensus across information technology, finance, procurement, legal, and diverse end-user departments.
This expanded committee structure yields significantly extended sales cycles. The cross-industry average currently sits at 121 days for mid-market deals and extends to 218 days for enterprise-level transactions 1. To service a committee of 11.2 individuals over a seven-month period, vendors must sustain continuous engagement; the average enterprise path to a closed deal spans 211 days and requires 76 distinct, trackable marketing and sales touchpoints 210.
However, an operational divergence is occurring among vendors regarding cycle velocity. While average sales cycles remain lengthy across the broader market, organizations running sophisticated, artificial intelligence-native marketing programs that unify intent data with account-based marketing workflows have successfully compressed their average sales cycles by 17 days 1. Conversely, programs relying on traditional, siloed demand generation have seen their cycles lengthen by 9 days due to increasing buyer caution and friction in content delivery 1.
The Conversion Gap
Despite the volume of content being produced, a significant disconnect remains between marketing output and sales readiness. Approximately 61% of marketers cite generating quality leads as their primary challenge, and 85% struggle to connect their performance metrics to actual business outcomes 56. Furthermore, 79% of marketing-generated leads never convert into closed sales, primarily due to ineffective nurturing and a lack of alignment between the content provided and the specific stage of the buyer's evaluation process 56. The marketing-qualified lead to sales-qualified lead conversion rate frequently drops below 15%, an indicator that content is driving initial curiosity but failing to establish commercial intent 2.
Generative Engine Optimization and Zero-Click Search
The proliferation of artificial intelligence-mediated research tools has severely compromised traditional digital acquisition mechanisms, introducing systemic shifts in how content is discovered and measured.
The Great Decoupling
The traditional inbound marketing model relied on a straightforward transactional exchange: organizations produced educational content, search engines indexed the material, and traffic was subsequently routed to the organization's owned domain where tracking pixels captured the engagement. This dynamic has fractured in a market event frequently characterized as the Great Decoupling 7.
Artificial intelligence overviews, generative search experiences, and platform-native content summarization dictate that up to 65% to 70% of all informational search queries now end without a single click to an external website - a phenomenon classified as the zero-click environment 89. As large language models summarize proprietary research and present it directly to the user on the search engine results page, brands achieve visibility but lose trackable website traffic 710. By early 2025, artificial intelligence overviews appeared on over 13% of all desktop queries, and when these summaries are present, the zero-click rate spikes to between 80% and 83% 9. Correspondingly, 73% of business-to-business websites experienced significant traffic loss on discovery-oriented search terms over the preceding 24 months, with average declines reaching 34% year-over-year 7.
Transitioning to Answer Engine Optimization
The evaporation of traditional search traffic necessitates a strategic pivot from conventional Search Engine Optimization to Generative Engine Optimization and Answer Engine Optimization 717. Content must now be rigorously structured for machine consumption rather than human browsing.
To ensure inclusion in artificial intelligence summaries, content architectures must utilize explicit schema markup, establish clear entity relationships, and provide highly scannable, definitive answers to complex industry queries within the first few sentences of an asset 710. The objective is no longer solely to rank as a blue link, but to serve as the foundational data source upon which an artificial intelligence model builds its answer. Success in a zero-click environment is measured by "share of model," citation frequency within artificial intelligence responses, and subsequent downstream branded search volume, rather than top-of-funnel session acquisition 71011.
Furthermore, the traffic that does bypass the zero-click barrier and arrives via artificial intelligence referrals exhibits distinctly different behavioral patterns. While overall search traffic volume is declining, 58% of marketers report that artificial intelligence referral traffic demonstrates significantly higher commercial intent; visitors arriving via large language models are much further along in their buying journey and convert at accelerated rates, indicating that the artificial intelligence tool has already functioned as a preliminary qualification mechanism 12.
Dark Funnel Measurement
Beyond the zero-click search environment, the broader buyer journey is increasingly obscured within untrackable digital ecosystems, creating substantial challenges for performance measurement and capital allocation.
Defining the Invisible Pipeline
The dark funnel encompasses all buyer research, peer validation, and decision-making activity that leaves no digital footprint trackable by conventional marketing attribution software. This ecosystem consists of private Slack communities, closed Discord servers, peer-to-peer WhatsApp networking, offline word-of-mouth at industry events, untracked podcast consumption, and anonymous interactions with generative artificial intelligence tools 21321.
Because traditional digital tracking relies on UTM parameters, cookies, and pixel fires, the multi-touch attribution software stack cannot detect these critical influence events. The resulting pipeline is therefore structurally misattributed. Without sophisticated intervention, dark funnel activity often manifests in analytics dashboards as a massive, unexplainable surge in "Direct Traffic" or "Organic Search (Branded)" at the very end of the buyer journey 213. Benchmark data indicates that for high-growth software organizations, direct traffic now routinely represents an overwhelming majority of total pipeline source attribution. Specifically, direct traffic accounts for 72.1% of pipeline at Gong, 71.6% at HubSpot, 64.5% at Salesforce, and 49.9% at Demandbase 13. Rather than representing a failure of tracking, a direct traffic share exceeding 40% is now widely interpreted as a primary indicator of a highly active and healthy dark funnel 13.
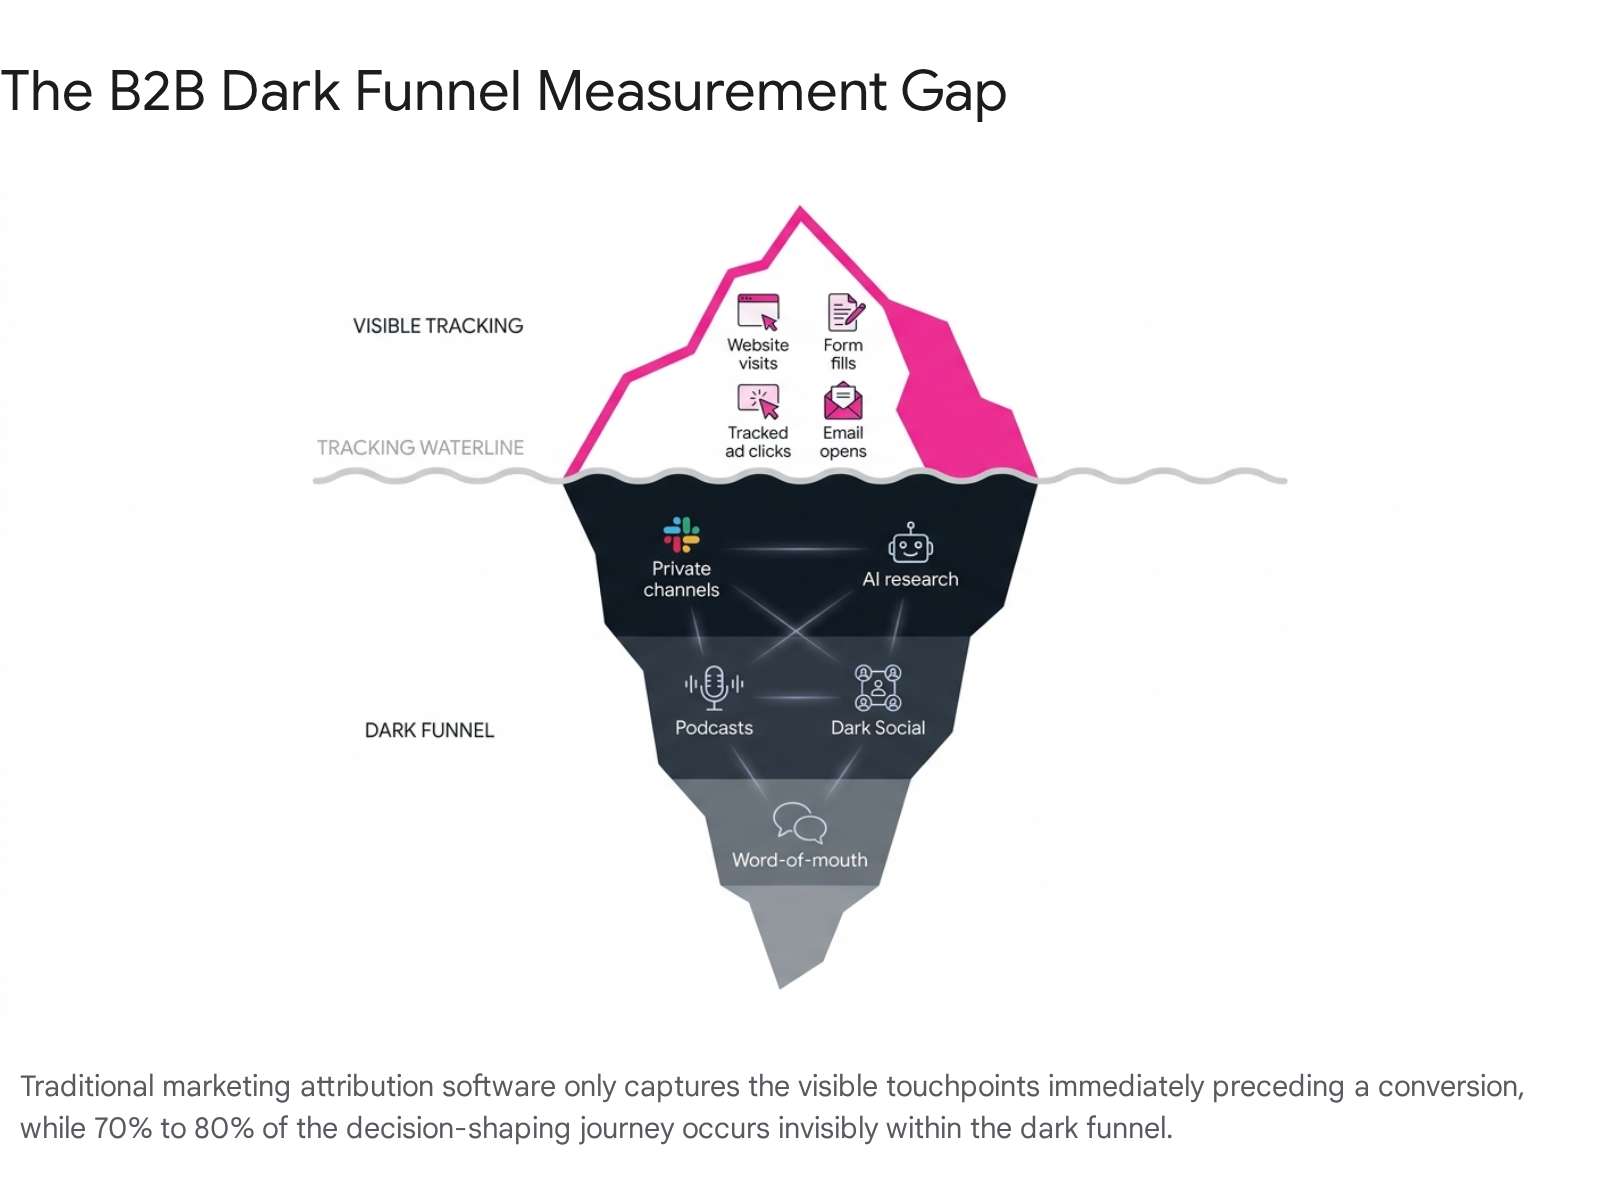
The visual representation above emphasizes the severe limitations of relying solely on digital pixels to map the buyer journey. When 70% of the research process occurs below the surface of measurable analytics, organizations optimizing their spend based strictly on software-visible touches systematically defund the very channels creating the demand.
Implementing Self-Reported Attribution
To accurately measure dark funnel effectiveness, mature organizations are augmenting their quantitative software tracking with qualitative, self-reported attribution frameworks. By mandating open-ended qualitative fields - such as requiring a prospect to answer "How did you hear about us?" at the point of high-value conversion - marketing operations teams can capture the true origin of the demand 2223.
When organizations cross-reference their software data with these qualitative responses, they frequently discover that private slack communities, specific podcast episodes, or offline peer recommendations drove the initial awareness, even though the attribution software credited the final conversion to a branded Google search or direct URL entry 2122. This hybrid measurement approach - combining the behavioral tracking of multi-touch software with the psychological truth of self-reported attribution - provides the most defensible framework for proving the revenue impact of dark social investments.
Pipeline Generation by Content Format
Content strategy demands capital allocation based strictly on demonstrated pipeline contribution rather than top-of-funnel traffic generation. An analysis of format performance reveals a sharp divergence in the commercial return on investment generated by different content archetypes.
Strategic Podcasting and Vodcasting
Audio and video podcasting has matured into one of the highest-performing pipeline channels for enterprise organizations, primarily functioning as a relationship-acceleration asset rather than a broad-reach media broadcast. The global podcast audience has expanded to an estimated 619 million listeners, with 75% of business decision-makers engaging with the medium 11.
Top-performing corporate podcasts currently drive between 8% and 12% of a company's total pipeline 11. This profound impact is driven by two distinct mechanisms. First, strategic guest selection functions as highly targeted, relationship-led account-based marketing. By inviting executive decision-makers from target accounts to appear as guests, brands effectively bypass traditional sales gatekeepers to secure 45 to 60 minutes of uninterrupted dialogue. Benchmark data reveals an average guest-to-client conversion rate of 10%, which escalates to 48% when guest selection is rigorously aligned with ideal customer profiles 111415.
Second, podcasts deliver unparalleled attention retention. While traditional video content struggles to maintain viewer attention past the 12% completion mark, branded podcasts routinely achieve episode completion rates of 80% to 90% 1526. This depth of engagement acts as a profound trust accelerator. Analysis of customer relationship management data reveals that deals influenced by podcast touchpoints progress through sales cycles 24% to 31% faster than non-podcast deals, and exhibit contract values that are up to 47% higher 1114. Furthermore, 22% of all closed-won deals in organizations utilizing strategic podcasting include at least one podcast consumption touchpoint in the buyer journey 11.
The format is also rapidly evolving toward visual consumption. Video podcasts, or vodcasts, are capturing immense market share, heavily driven by YouTube's algorithmic optimization as a primary discovery engine. Business audiences consuming vodcasts spend 1.5 times longer with the content compared to audio-only listeners and report significantly lower rates of multitasking, establishing deeper parasocial connections with the host organization 16. Global advertising revenues for combined podcast and vodcast formats are projected to reach $5 billion in 2026, underscoring the institutional confidence in the medium 16.
Original Research and Data
Despite the absolute saturation of digital content, deep-expertise written formats retain their dominance in middle-to-bottom funnel conversion events. Original, data-grounded research serves as the cornerstone for digital authority and Answer Engine Optimization. Content that presents proprietary statistics, trend analysis, and unique executive observations creates natural link-building momentum, which remains critical for traditional search visibility while simultaneously providing high-value inputs for large language model training datasets 28.
When original research is structured into long-form pillar content, it consistently generates exceptional conversion rates by satisfying the intense pre-contact diligence of the expanded buying committee 1. Organic search, driven primarily by comprehensive research and technical content, remains a dominant channel; in the software-as-a-service sector, organic search generates 44.6% of all revenue and delivers an extraordinary 702% return on investment, with a break-even time of merely seven months 3.
Middle-Funnel Assets: Case Studies and Webinars
Case studies are currently rated as the single most effective content format by 69% of marketers 29. As buyers conduct independent evaluations, they require peer-validated proof of concept before engaging a vendor. Consequently, case studies feature prominently in 26% of all closing-stage decisions across the business sector 17.
Interactive formats and immersive digital events also demonstrate strong middle-funnel performance. Webinars and digital events are utilized by 55% of marketers to capture high-intent audiences, contributing to 23% of mid-funnel influence in complex sales cycles 1731. Furthermore, interactive calculators and assessment tools generate twice the engagement of static content and provide a measurable 13% lift in last-touch conversion rates by allowing buyers to tangibly model potential business outcomes 1732.
Format Performance Summary
| Content Format | Primary Funnel Stage | Key Performance Indicator | Pipeline Impact Metric |
|---|---|---|---|
| Podcasting (Audio/Video) | Demand Generation / ABM | 80-90% episode completion rate 1526 | 24-31% faster sales cycles; 10-48% guest conversion 1114 |
| Original Research (SEO) | Awareness / Authority | 44.6% of total sector revenue generation 3 | 702% ROI; 7-month break-even 3 |
| Case Studies | Consideration / Decision | Ranked most effective by 69% of marketers 29 | Present in 26% of closing-stage decisions 17 |
| Short-Form Video | Awareness / Social | Highest reported ROI channel growth 12 | 34% multi-touch funnel attribution presence 17 |
| Interactive Content | Consideration / Modeling | 2x higher engagement vs. static 632 | +13% lift in last-touch conversion 17 |
Artificial Intelligence Versus Human Content Economics
The proliferation of generative artificial intelligence tools has fundamentally altered the baseline economics of content production. However, the anticipated absolute dominance of machine-generated content has not materialized due to a severe degradation in audience trust and engagement metrics.
The Content Paradox and the Trust Gap
In 2026, 89% of organizations utilize artificial intelligence applications to generate or optimize marketing copy 293318. While these technologies deliver unquestionable operational efficiency - accelerating content creation speed by 59% and overall volume output by 77% - they perform poorly as independent drivers of audience connection 35.
A highly measurable trust gap has emerged among professional audiences. Survey data indicates that 52% to 62% of consumers will actively disengage from an asset if they suspect it was generated entirely by artificial intelligence without rigorous human oversight 353637. Although blind tests reveal that 84% of readers cannot consciously distinguish between highly refined machine writing and human writing, subconscious behavioral metrics tell a remarkably different story 35.
Comprehensive performance studies conducted across hundreds of digital properties demonstrate that fully human-generated content receives 5.44 times more organic traffic over a five-month period compared to purely artificial intelligence-generated equivalents 363839. Furthermore, visitors spend 41% longer on pages authored by humans, generating 3.5 times more social engagement 3538. This extreme divergence occurs because large language models, which operate via predictive probability, inherently flatten nuance, strip out proprietary vocabulary, and eliminate the emotional resonance and lived experience that drives human connection 3619. As the cost of content production approaches zero, volume is no longer a competitive advantage; perspective, authenticity, and definitive subject matter expertise have become the ultimate differentiators.
The Hybrid Optimization Model
To resolve the tension between automated scale and human impact, high-performing organizations have adopted a hybrid content development framework. In this operational model, artificial intelligence is restricted to specific, high-friction workflows: processing unstructured market data, outlining structural arguments, generating first drafts of routine technical documentation, and optimizing meta-data at scale 3538.
Human subject matter experts are then deployed strictly for high-leverage qualitative injection. Human intervention is required to embed lived experience, challenge industry consensus with contrarian viewpoints, verify factual accuracy, and apply specific brand stylization 3536. Market data confirms that this hybrid approach yields content that ranks 34% higher in search visibility than unedited machine output, delivering the scale benefits of automation alongside the engagement multipliers of human authenticity 35. Furthermore, content heavily anchored by recognizable human executives - frequently termed a founder-led approach - is uniquely insulated against algorithm shifts, as social platforms increasingly index human authority and network saves over raw search volume or superficial engagement metrics 37.
Modern Attribution Architecture
The complex, 211-day buyer journey renders legacy measurement frameworks fundamentally obsolete. Without modernized attribution tracking, 30% to 40% of marketing budgets are demonstrably misallocated, resulting in catastrophic inefficiencies 22. In 2026, the reliance on single-touch attribution models is ending, replaced by complex dual-model measurement systems.
The Failure of Single-Touch Models
Historically, marketing operations relied on either first-touch attribution, which assigns 100% of pipeline credit to the channel that generated the initial anonymous visit, or last-touch attribution, which credits the final click immediately preceding a form submission. Both models systematically misrepresent the reality of the sales pipeline 222. First-touch completely ignores the months of mid-funnel content nurturing required to build consensus across an 11-person committee. Last-touch over-credits branded search and retargeting advertisements, while severely punishing the foundational thought leadership, podcasting, and organic research that actually initiated the demand 241.
Although a substantial percentage of marketers still have last-touch models active - primarily because it remains the default setting in legacy customer relationship management platforms and advertising dashboards - it is rapidly being deprecated as a strategic decision-making tool 20. Relying on restrictive 30-day attribution windows built for consumer e-commerce actively hides 40% to 50% of identifiable professional interactions, artificially starving top-of-funnel budgets while over-funding the channels that merely capture existing demand 41. Modern organizations require minimum lookback windows of 90 to 180 days to accurately capture the full breadth of the evaluation cycle 41.
The Standard: Multi-Touch and Mix Modeling
To capture the true revenue impact of content, 75% of advanced organizations have transitioned to Multi-Touch Attribution 22. This model distributes fractional credit across the dozens of touchpoints a buying committee interacts with over the entire lifecycle 2144.
The most effective rule-based approaches for complex sales are W-shaped and U-shaped models. W-shaped models typically allocate 30% credit to the first touch, 30% to lead creation, 30% to opportunity creation, and distribute the remaining 10% evenly across all middle touchpoints 22. This structure honors the reality of the pipeline, ensuring content that drives deep funnel progression is properly funded 22. Algorithmic, data-driven attribution models - which utilize machine learning to dynamically assign fractional credit based on historical close rates and actual influence - represent the definitive gold standard. Holdout testing demonstrates that these algorithmic models lift forecasting accuracy by 22 percentage points compared to deterministic single-touch models, representing the largest single accuracy improvement available in marketing operations 20.
However, because multi-touch software cannot capture offline events, broadcast media, or dark funnel activity, 26% of mature teams now run Marketing Mix Modeling in parallel with their touch-based systems 20. Marketing Mix Modeling utilizes advanced econometric and statistical analysis to measure the broader, top-down impact of brand awareness and content syndication on overall revenue, providing a macroeconomic view that perfectly complements the micro-transactional view of multi-touch software 20.
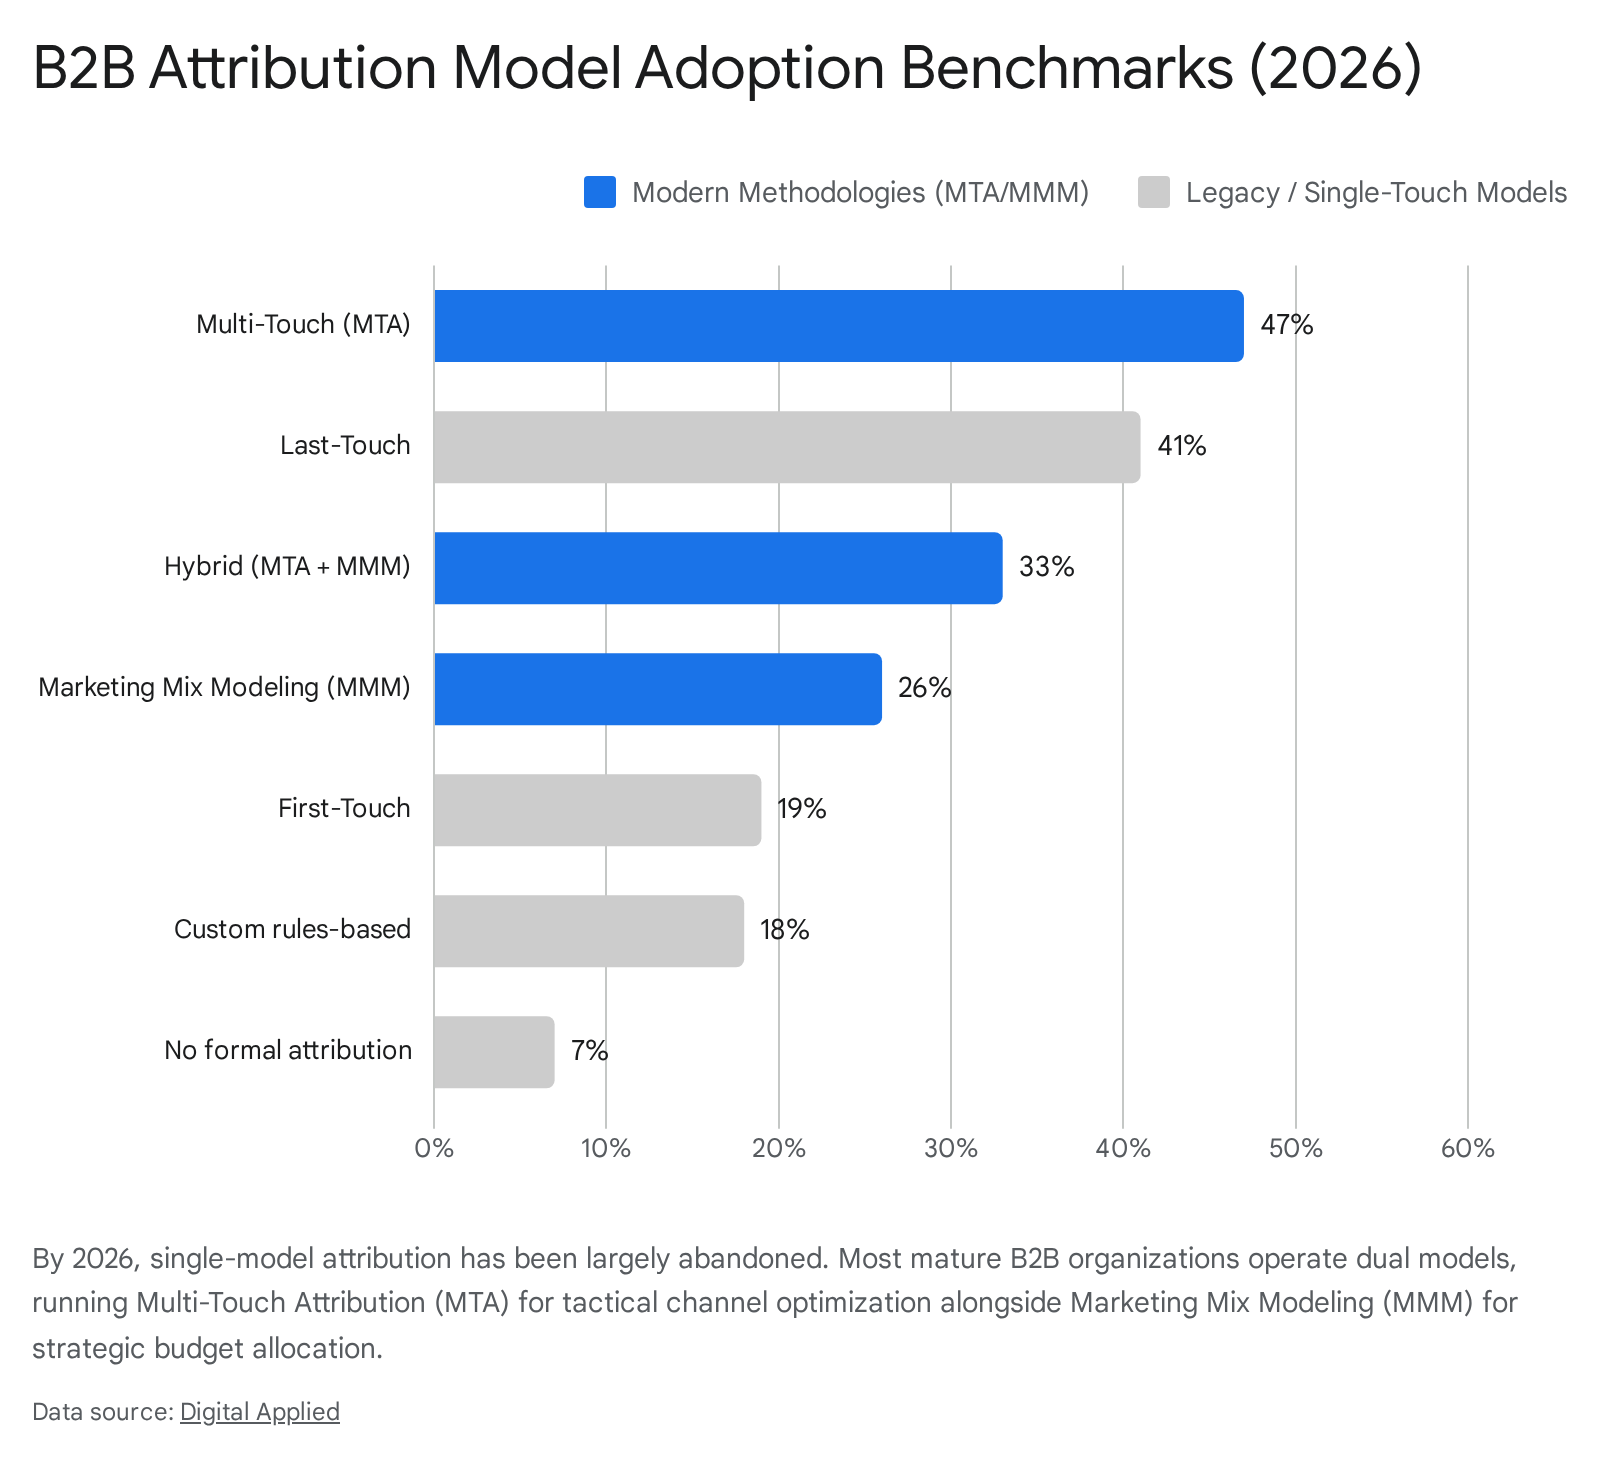
The chart illustrates the widespread normalization of dual-model architectures, where teams aggregate data across both granular tracking platforms and broad statistical models to form a complete picture of revenue influence.
Evaluating Attribution Software Architecture
The execution of these complex models requires highly specialized software architecture. Out-of-the-box analytics platforms frequently leave marketing executives unable to defend their channel mix, as default configurations often assign massive percentages of conversions to unidentifiable direct traffic 41. In selecting attribution platforms, organizations must align the software's specific technical strengths with the nature of their go-to-market motions:
| Attribution Platform | Core Architectural Strength | Best Fit For (2026 Context) |
|---|---|---|
| Dreamdata | Account-level aggregation. Maps disparate touches from multiple stakeholders into a unified buying committee timeline 4546. | Organizations managing highly complex, multi-person buying committees with defined pipeline stages 4546. |
| Cometly | Server-side tracking logic. Bypasses iOS privacy limitations and ad-blockers to restore data visibility, feeding precise signals back to ad algorithms via Conversion Sync 444547. | Paid-media-heavy teams requiring highly accurate cross-platform artificial intelligence ad optimization 4445. |
| HockeyStack | No-code implementation combined with qualitative Self-Reported Attribution modules to surface dark social influence alongside standard digital tracking 2048. | Marketing teams lacking dedicated data-engineering resources who heavily leverage community strategies 48. |
| Bizible (Adobe) | Deep, native enterprise integration. Captures and visualizes touchpoint data directly within Salesforce custom objects 4446. | Enterprise organizations operating complex funnels completely within the Salesforce and Adobe technology ecosystem 4446. |
Regional Go-To-Market Discrepancies
While the structural shift toward pipeline-focused content and advanced multi-touch attribution is a global phenomenon, the tactical application of these strategies varies substantially across North America, the Europe, Middle East, and Africa region, and the Asia-Pacific region.
North America: Artificial Intelligence Integration and Budget Optimism
The North American market demonstrates the highest level of technological aggression and structural market optimism. In 2026, 94% of North American marketers incorporate formal, documented content frameworks into their overarching digital strategy 31. Furthermore, 37% of marketing decision-makers in the United States anticipate budget increases of 5% or more over the next 12 months, signaling confidence in their ability to generate measurable pipeline 22.
North American teams lead globally in the operational integration of generative artificial intelligence; 43% of leaders report using these tools systematically to gain competitive market advantage, significantly outpacing adoption rates in other geographic territories 23. Content strategies in this region are also uniquely characterized by a heavy institutional emphasis on diversity, equity, and inclusion messaging, which approximately 70% of regional leaders cite as critical for maintaining broad perspective and informing strategic organizational decision-making 23.
Europe, Middle East, and Africa: Privacy Constraints and Brand Authority
Marketers operating in Europe, the Middle East, and Africa are navigating a highly complex environment defined by sluggish macroeconomic recovery, supply chain volatility, and incredibly strict data privacy regulations 22. Despite these persistent headwinds, regional organizations maintain robust investment, allocating a median 9% of total company revenue to marketing operations 22.
Due to stringent privacy controls that severely limit cookie-based tracking and aggressive behavioral retargeting, content strategy in this region skews heavily toward opt-in brand building and deep-expertise formats. Marketers prioritize high-quality thought leadership, original research, and long-form video content over highly automated, hyper-targeted digital advertising campaigns 23. The inability to legally track micro-interactions across the digital ecosystem has forced European teams to rely more heavily on aggregate Marketing Mix Modeling and localized experiential marketing events to both generate and measure their pipeline contribution 2022.
Asia-Pacific: Mobile-First Acceleration and Early Engagement
The Asia-Pacific region is experiencing the most rapid acceleration in content marketing adoption globally, recording a 13% year-over-year increase with 83% of companies actively investing in structured content disciplines 31. While current marketing budgets in this region represent a lower overall percentage of company revenue compared to Western markets - with roughly half of respondents investing 7.1% or less - the region is planning the highest rate of investment growth across programs, personnel, and technology over the next 12 months 22.
Content consumption throughout the Asia-Pacific region is overwhelmingly mobile-first, heavily influencing both format selection and distribution strategies. Buyers in markets such as India, Indonesia, and Vietnam show exceptional adoption of short-form video content and mobile messaging platforms for professional business research 1624. The efficacy of mobile communication is profoundly reflected in regional data collection; for example, business-to-business SMS surveys achieve remarkable 40% to 50% response rates in the Asia-Pacific region, compared to merely 15% to 25% in Western markets where desktop email remains the primary professional communication channel 24.
Additionally, buyer intent in this region solidifies notably early in the process. Research indicates that Asia-Pacific buyers engage vendors up to 12 weeks earlier than historical global benchmarks, yet remain 73% through their internal decision-making process prior to that initial contact 12. This compresses the window for vendor influence, necessitating highly aggressive account-based marketing content deployment exceptionally early in the relationship cycle 12.
Conclusion and Strategic Alignment
The state of content marketing in 2026 is entirely defined by the absolute demand for measurable revenue impact and capital efficiency. The era of optimizing digital assets for generic traffic, isolated pageviews, and unverified lead volume is fundamentally over. As the cross-industry lead-to-closed-won rate compresses below 1% and acquisition costs soar, marketing organizations must operate as rigorous revenue-engineering engines.
To successfully generate pipeline in this environment, organizations must accept the realities of the autonomous buyer and the expansive 11-person committee. Content must serve the function of a digital sales engineer - providing deep value clarity, proving return on investment via rigorous case studies, and establishing peer trust through targeted podcasting networks. Organizations must navigate the existential threat of zero-click search by optimizing for Answer Engines, while simultaneously resisting the temptation to flood the market with low-value, machine-generated content. The massive traffic premium awarded to human-generated content proves that in an era of infinite, cheap information, enterprise buyers aggressively reward authentic expertise and lived experience.
Ultimately, survival and growth are contingent on modernized measurement. Defending marketing capital requires abandoning outdated single-touch analytics in favor of multi-touch attribution platforms layered with statistical modeling and self-reported qualitative data. This composite measurement architecture is the only way to capture the invisible influence of the dark funnel. Marketing leaders who align their content strategy with these complex buying realities and rigorous tracking frameworks will not only survive the transition but secure their position as co-equal drivers of organizational revenue growth.